How we are analyzed in shops and restaurants - continuation of the story
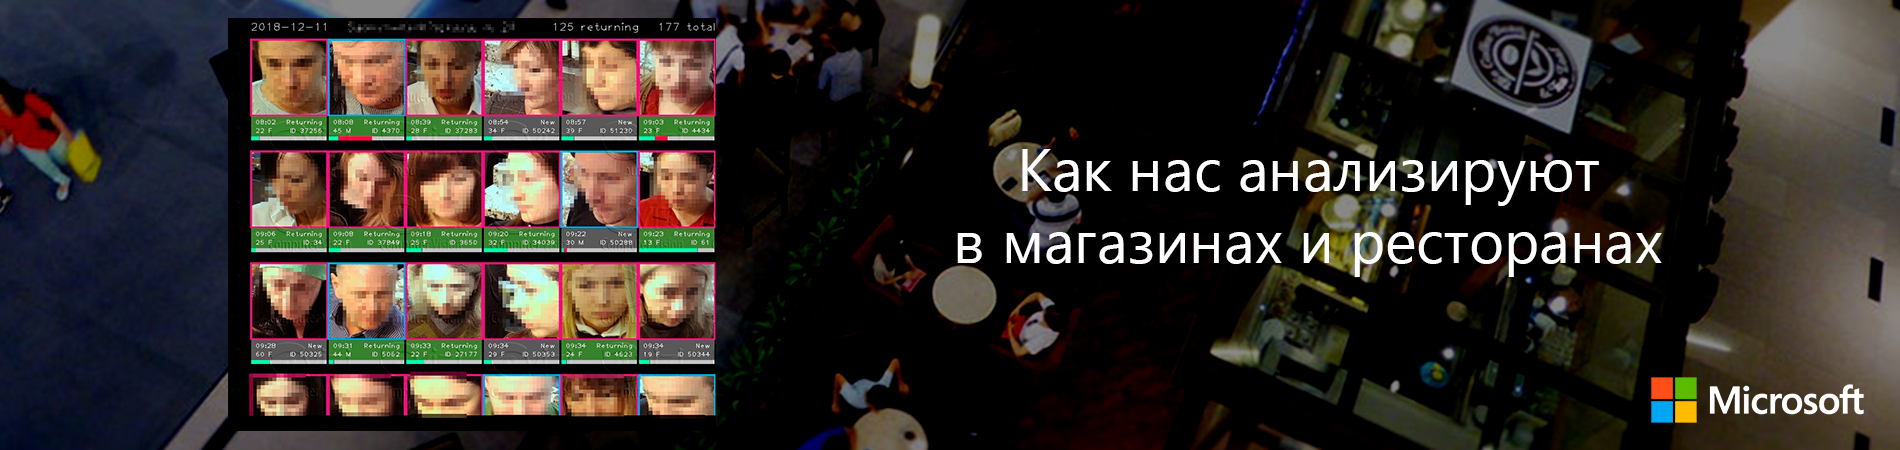
In the first part of the article, I talked about a new business tool for calculating and analyzing human traffic using video cameras. There are quite a few products on the market for counting people, but there are practically no such products that are made by analyzing a human face. When recognizing faces, you can get the following information: gender, age, emotional background and, in fact, most importantly, a unique identifier of the person. The latter is necessary in order to understand that we have seen this face before: then, so many times, with such periodicity, etc.
These video analytics are well used in retail, services, cafes and restaurants. Now it is possible to analyze buyers more objectively and accurately: their traffic, uniqueness, repeatability, gender and age, and, of course, emotions. In the counter for individuals, you can finally separate employees from visitors, count the duration of service and build marketing activities to increase customer loyalty.
Let me remind you that for example, one point was taken - a cafe (on the principle of dining) in Moscow, in which the camera is installed at the checkout.


')
In-depth analysis of recognized individuals
The results that can be obtained with the help of Track Expert , which I listed in the first part of the article are on the surface and quite obvious: the number of buyers, employees, segmentation by sex and age, emotions. But in order to make serious strategic decisions, no less serious analysis is needed.
I want to touch on the topic of loyalty. By loyalty we mean repeated visits by customers and buyers. Accordingly, the more of them, the higher the loyalty.
With the terminology defined. Now how to count? How to understand that loyalty increases, decreases or nothing happens to it?
The easiest option is to simply look at the ratio of new and returning customers and return rates.

On average, the return rate here varies around 70%. Those. about 30% of new visitors come to the cafe daily. This is very good.
Now let's look at those who go not the first time, but conditionally constantly . Question: how often or how often do visitors return here?
The purpose of my question is simple: how to make so that those who already go to a cafe (shop, salon, fitness club, etc.) go more often.
The traditional approach is discount cards. Distribute to everyone, and then "we will see." This is a normal option, but:
- Not always people carry discount cards;
- It is not always possible to identify yourself at the checkout by phone number or email. Yes, and many leave fake data about themselves in order to avoid unnecessary spam;
- Maps can be passed to each other (yes, everyone does J);
- Not every business has discount cards in principle.
Perhaps something else forgot. But it does not matter.
Therefore, the human face becomes a good alternative to identify the buyer and personal work with him.
To begin with, we propose to divide all visitors into 5 groups: New, Very rare, Rarely, Often, Very often.
Customer loyalty cannot be obtained simply by the click of a finger. You can, of course, hope that a client who went to a restaurant / cafe / shop 1 time in 3 months suddenly starts going there several times a week, but this will be rather an exceptional situation. The client must be won, and then not lost! And therefore it is better to gradually transfer it from one group to another - from “New” to “Very often.”
For each business, the concept of "Often" or "Very often" will be different. Therefore, in order not to indulge in the illusions of how often people return to you, you can use the “Prescription of visits” metric and understand the average frequency of returns of their customers.

It can be seen that the majority of visitors are those who go to the cafe on a weekly basis (from 1 time per week - up to 7). If a person walks, for example, in a cafe once every two weeks, then he already belongs to the category of "month". There are also quite a lot of them. Therefore, the analysis of loyalty is carried out primarily for two groups of clients - in which the duration of the visit is equal to "week" and "month".
There will be two goals. The first is to try to find levers to transfer the maximum visitors from the “month” group to the “week group”. And the second - within each group to influence the frequency of visits from “Very rare” to “Very often”. In general, it is a question of such a good marketing consulting.
Using the example of the “Week” group, I will show you how to sort out the issue, divide visitors into groups in terms of loyalty and what to do with all of them further. We set the frequency values for the “week” group (it can be changed) like this: “Very rarely” - once a week, “Rarely” - 2 ... 3 times a week, “Often” - 4 times a week, “Very often” - 5 ... 7 times a week.

For two months it is clear that the ratio of the number of visitors in these categories almost does not change. “Very rarely” takes at least 50% in relation to the other frequencies, therefore the stock to increase attendance is very large. To do this, you need to figure out who is who in these multi-colored columns.
I will not do further analysis in this article, although it is interesting. I can only say that, at a minimum, the following can and should be done:
- view gender and age distribution for each frequency group. Find similar behavioral characteristics and work individually in marketing with each of them.
- After each marketing step, you need to carefully measure the changes.
It should be remembered that for each visit duration (week / month / quarter / year), the effect of marketing should be expected exactly at the appropriate intervals.

Other examples of use in retail
Once again I remind you that all this data was obtained from one camera. Now let's fantasize if there are several cameras (inside the object, on different objects).
Case 1. One camera at the entrance, and the second at the checkout or exit.
Putting two or more cameras into the store at once, we get another set of metrics that allow us to measure:
- average time spent by the visitor in the store.
- average travel time from the entrance to the ticket office.
- emotions of visitors at the exit and at the box office.

Very often, customers want to get information about the customers' time in the store. Using traditional visitor counters to obtain such information can not be. One can only talk about a certain average value over a period of time. For example, in 1 hour 14 people entered, it turned out 9. Or vice versa - 8 people entered, and 12. left. Now the question. What is the average visitor’s time at the store if 5 checks were punched at the checkout?
If we use facial recognition technology, then this task immediately becomes feasible and solvable. There is another option - to track each visitor. But for this, the store needs to be covered with a grid of cameras so that, by analogy with the cellular communication system, the visitor is transferred from one cell (camera zone) to the next one, so before the exit. A solution that is not very democratic in value will be released, plus the probability of a track breaking (visitor loss) in the frame is not very small.
With face recognition, it is sufficient to remove a person at the entrance and exit, or at the entrance and at the checkout. And now you have the exact statistics of the visitor’s time in the store.
Case 2. Predictive work with customers
Imagine for a moment that visitors who have bought something from you go to your store more than once, but recently come and go without shopping. First, how to understand that such a situation occurs in principle, and, second, what is the reason for this?
The first question will be answered by information from case 1 plus data on loyalty plus information on the emotions of people leaving. And on the second question, there may be a million. For example, you have changed the line of clothes, shoes, something else, and the person was looking for exactly what he bought last year. The buyer comes once, twice, and on the third you lose it. Common situation? Would it be interesting to take the lead and predict this behavior or catch loyal visitors even before they bought something? The question is rhetorical. But it is important to know that the answer to it is already possible.
Architecture and how everything works
In the last article I already told you that the CVizi solution architecture is lightweight. No bulky servers, recorders. No need to maintain a fleet of equipment and match everything with each other.
At the same time, the architecture is not cloudy in its pure form. She's a hybrid. Such an approach in the current state of affairs in the development of household video cameras is fully justified.
Now I will try to explain. From the point of view of the Internet of things, a video camera can be considered as some kind of sensors that provide content for further automatic processing, analysis and decision making. You can drive traffic to any cloud server and process it there, but there are several pitfalls (although they are not underwater).
- The amount of Internet traffic that will be transmitted to the clouds. If the site has many cameras and / or you have a lot of objects, the volume of traffic will be enormous and you will need dedicated Internet channels. That is not always possible.
- Requirements for the server (s) that register and process the flow: computing power, redundancy, load management.
- Fault tolerance of the entire system. The strong dependence of the performance of the entire system on the performance of even a single server.
It would be cool to use video analytics not for simple cameras, but for smart cameras. The main task of which should be a preliminary analysis of the video stream "on the fly", the selection of the desired events from it, to prepare data for their analysis. Unfortunately, there are no universal smart cameras on the market for reasonable money. Therefore, we "made" it ourselves.
Let's walk briefly on the elements of architecture
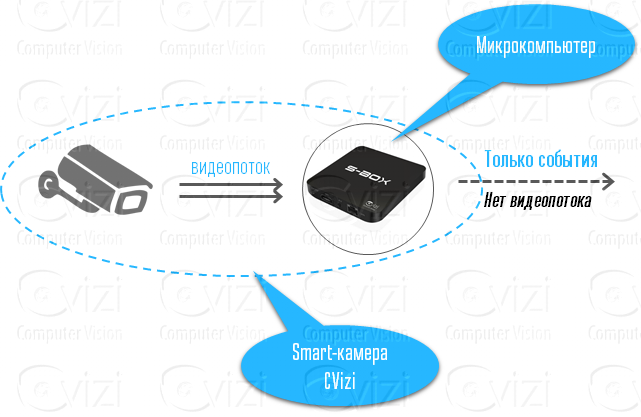
S-Box Computing Device
This is one of the device modifications:

Its main purpose is the primary processing of a stream from an IP or USB camera. At each frame, the face detection function finds faces, captures them and forms a list of face attributes (coordinates, angle, image quality on the frame, distance to the camera). This information is then sent to the cloud portal, CVizi, running on the Azure platform, over an encrypted channel. I draw your attention that the video stream itself is not transmitted to the cloud.
The code is written in C ++ and Python, which allows you to use the entire set of tools for working with images and cameras.
By the way, in the same way, S-Box is used on other video analytics tasks: detection of production processes, people, transport, and other things.
Cameras
Cameras can be very different. And there are no very rigid criteria that would limit their choice. The main thing is that these are simple household, non-industrial IP cameras (most often IP) with a democratic price tag. It should be noted that the camera is the equipment that is being upgraded on the market, probably the fastest from what we use. The main criterion of our choice of a particular camera in the Track Expert installation package is Price / Quality. To keep the cost of the installation package on the same level, but at the same time, constantly improving the quality of service, we constantly keep abreast of all the new products. In our test lab, there are always sample candidate chambers for a particular business problem.
For example, at the time of writing this article, we use these 5Mp cameras of two form factors for facial recognition.

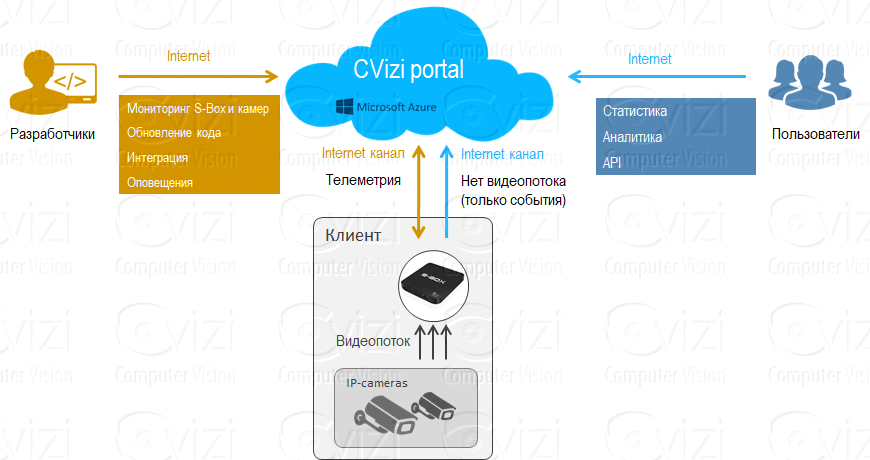
CVizi portal
The portal is actually the heart of the whole system, which has just countless functions. List the most basic.
First is the accumulation of data. SQL Azure helps us here. First, we used traditional SQL Server deployed in virtual machines. And it was a good option, as we have plenty of competencies to manage and optimize the performance of SQL Server. But at some point with the growth of clients, we realized that it becomes just physically difficult and not efficient to manage a large number of small and not very DB. SQL Azure easily solved our tasks with built-in analytics with computer training and adaptive technologies for continuous optimization of database performance in real time.
It is also convenient to dynamically control the performance of the database, which allows you to handle incredible amounts of statistics.
Secondly , Microsoft Blob Storage allows you to store all photos and videos in any quantity, get them via a hyperlink and use them, for example, in tools such as Power BI.
Third , the cognitive service Microsoft Face API. It is with the help of it that we recognize faces, group similar people and figure out which face and when it was fixed earlier.
We use Python to work with the Microsoft Face API. I do not want to repeat, in the previous article there are a couple of examples of scripts for accessing the Microsoft Face API.
Fourth , the system of monitoring and monitoring the performance of all equipment installed at customers. In fact, all S-Boxs together represent the same IoT. We have built a separate monitoring system for each device in the network and continuously monitor the health of the equipment. It would seem that this is so special? But think how much now the owner, for example, the store of all equipment that should function smoothly. It’s one thing if the refrigerator or cash register is broken and the breakdown is visible immediately, and the other is some kind of people’s counter, where the breakdown can come to light in a month or more when the owner wants to get a final report. Why not controlled? Why not reported? Who is guilty? How to recover statistics? All the marketing research in the store this quarter down the drain?
In our case, this is impossible. All interested parties will receive notification of equipment failure from a few minutes to a few hours, and our support team will help solve the problem. Moreover, remotely! For reference. As a rule, 80% -90% of incidents are related to the fall of Internet channels at the client.
And in order to keep up with the times in the Administration System Track Expert there is the possibility of remote software updates. A new successful algorithm has appeared - by pressing “one button” it will be updated for those customers who need and use it.
Architecture benefits
The CVizi architecture, as you understand it, is a hybrid. On the ground - S-Boxes, and in the cloud - Azure services and not only.
On premise: S- Box distributed network
Using a lot of small computing devices is always better than one big mega-server / cluster of servers, which all video streams from different sources connect to. No matter how powerful and cool it is, the moment will come when it will become the bottleneck in the system and the performance of the entire system will depend on its performance. In the case of a distributed computing system, each S-Box performs its own small pool of tasks and the performance of the entire system does not depend on the performance of one particular S-Box.
In addition, the total computing power of the S-Box, for example, at some fairly large object can easily surpass the computing power of top-end servers, and at the price the equipment will be several times smaller. Most importantly, learn how to properly manage these distributed computations J. And this we can do.
On Premise Infrastructure Upgrade. For many customers, this is a very sensitive issue, because always very expensive and accompanied by failures and downtime of the entire system, because seamless transitions (from iron to iron or from platform to platform) almost never happens. In the case of a distributed network of devices, everything becomes simple. The transition can be very smooth and not expensive in the part of buying a large number of devices at once. And during the upgrade will be ensured continuous operation of the entire system.
Cloud: Azure
I would like to note that Azure provides really very convenient tools in terms of scaling and managing infrastructure performance. Customers are all different with different amounts of resource consumption. It’s one thing to recognize 100 to 300 people a day at a convenience store, and a completely different situation when a large shopping center with several entrances or a chain of stores that has a total throughput of several thousand unique visitors per day.
With the traditional On Premise architecture, there may be a situation in which the server capacity may be idle, and in the second they may not be enough, especially on days with peak attendance. And the flexible and almost instantaneous management of the computing power in Azure is just a gift for us.
Summary
What I want to say in conclusion ...
Technical progress is inexorably approaching us and with each new day provides us with new and new tools and technologies. You can, of course, argue how everything became bad: your face is recognized everywhere; it is now generally better not to go out of the house because Big brother is watching you; I did not give permission for my shooting and analysis, etc. etc. But it is already there. , . . .
, . . , , , . . . . , HoReCa, Event-, – , . , - :
- ( )
- ( )
, . , , .
CVizi , , .
 — CVizi . : 'aosipov @ cvizi.com'. FB .
Source: https://habr.com/ru/post/452446/
All Articles