Optimization of garbage collection in a highly loaded .NET service
Every day tens of thousands of employees from several thousand organizations around the world work in the Pyrus service. Responsiveness of the service (speed of processing requests), we consider an important competitive advantage, since it directly affects the impression of users. The key metric for us is "the percentage of slow queries." Studying its behavior, we noticed that once a minute there are pauses about 1000 ms long on the application servers. During these intervals, the server does not respond and a queue of several dozen requests appears. The search for the causes and the elimination of bottlenecks caused by garbage collection in the application will be discussed in this article.

Modern programming languages can be divided into two groups. In languages like C / C ++ or Rust, manual memory management is used, so programmers spend more time writing code, managing the lifetime of objects, and then debugging. At the same time, bugs due to memory misuse are among the most difficult to debug, so most modern development is done in languages with automatic memory management. These include, for example, Java, C #, Python, Ruby, Go, PHP, JavaScript, etc. Programmers save development time, but they have to pay for this with additional execution time, which the program regularly spends on garbage collection — freeing up memory occupied by objects to which the program has no links left. In small programs, this time is negligible, but as the number of objects grows and the intensity of their creation increases, garbage collection begins to make a noticeable contribution to the total program execution time.
Pyrus web servers run on the .NET platform, which uses automatic memory management. Most garbage collections are blocking ('stop the world'), i.e. for the time of their work, stop all threads (threads) of the application. Non-blocking (background) assemblies actually also stop all threads, but for a very short period of time. During the blocking of threads, the server does not process requests, existing requests hang, new ones are added to the queue. As a result, requests that were processed at the moment of garbage collection are directly slowed down, requests are also slower executed immediately after the garbage collection is completed due to the accumulated queues. This impairs the percentage of slow queries.
')
Armed with the recently published book Konrad Kokosa: Pro .NET Memory Management (about how we brought its first copy to Russia in 2 days, you can write a separate post), entirely devoted to the topic of memory management in .NET, we began to study the problem.
For profiling the Pyrus web server, we used the PerfView utility ( https://github.com/Microsoft/perfview ), customized for profiling .NET applications. The utility is based on the Event Tracing for Windows (ETW) mechanism and has minimal impact on the performance of the profiled application, which allows it to be used on the combat server. In addition, the performance impact depends on what types of events and what information we collect. We do not collect anything - the application works as usual. PerfView also does not require any recompilation or application restart.
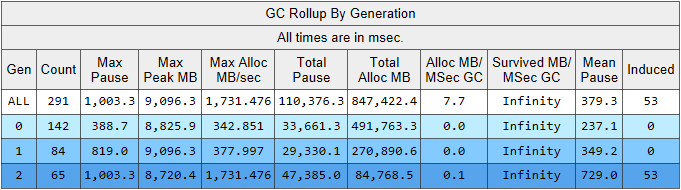
Run the PerfView trace with the / GCCollectOnly parameter (trace time 1.5 hours). In this mode, it collects only garbage collection events and has minimal impact on performance. Let's look at the Memory Group / GCStats trace report, and the summary of the garbage collector events in it:
Here we see several interesting indicators:
We explain the observation about the number of garbage collections. The idea of dividing objects by their lifetime is based on the generational hypothesis hypothesis : a significant part of the created objects dies quickly, and most of the others live for a long time (in other words, few objects have an “average” lifetime). It is under this mode that the .NET garbage collector is sharpened, and in this mode, the second generation assemblies should be much less than the 0th generation. That is, for optimal work of the garbage collector, we must adjust the work of our application to the hypothesis of generations. We formulate the rule as follows: objects must either die quickly, not living to the older generation, or live to it and live there forever. This rule also applies to other platforms that use automatic memory management with separation by generations, such as Java, for example.
Interesting data for us can be extracted from another table in the GCStats report:

Here are the cases when an application tries to create a large object (in the .NET Framework objects with a size of> 85000 bytes are created in LOH - Large Object Heap), and it has to wait until the end of the 2nd generation assembly, which occurs in parallel in the background. These allocator pauses are not as critical as garbage collector pauses, since they only affect one stream. Prior to this, we used the .NET Framework version 4.6.1, and in version 4.7.1 Microsoft finalized the garbage collector, now it allows you to allocate memory in the Large Object Heap during the background generation of the 2nd generation: https://docs.microsoft.com / en-us / dotnet / framework / whats-new / # common-language-runtime-clr
Therefore, we have updated to the latest at that time version 4.7.2.
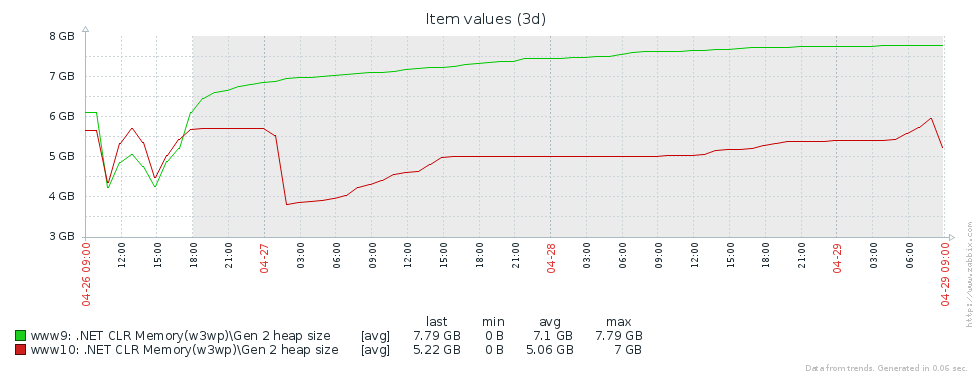
Why do we have so many older assemblies? The first assumption is that we have a memory leak. To test this hypothesis, we look at the size of the second generation (we configured monitoring of the corresponding performance counters in Zabbix). From the graphs of the size of the 2nd generation for 2 Pyrus servers, it is clear that its size first grows (mainly due to filling caches), but then stabilizes (large dips in the graph - a regular restart of the web service for updating the version):
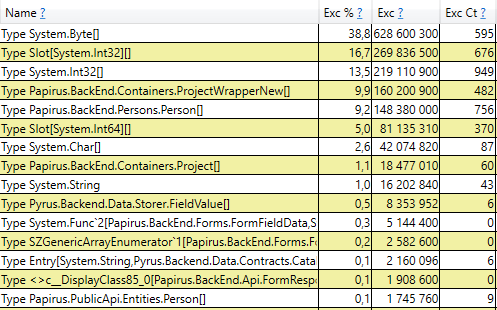
This means that there are no noticeable memory leaks, that is, a large number of assemblies of the 2nd generation arise for another reason. The next hypothesis is a large memory traffic, i.e., many objects get into the 2nd generation, and many objects die there. To find such objects in PerfView there is a / GCOnly mode. From the trace reports, look at the 'Gen 2 Object Deaths (Coarse Sampling) Stacks', which contains a selection of objects dying in the 2nd generation, along with the call stacks of the places where these objects were created. Here we see the following results:
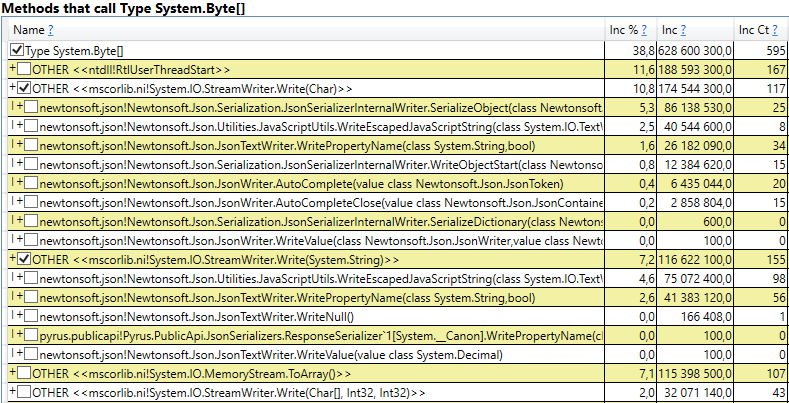
Having opened the line, inside we see a stack of calls for those places in the code that create objects that live to the 2nd generation. Among them:

Interestingly, buffers for JSON and for computing client caches are all temporary objects that live for a single request. Why do they live to the 2nd generation? Note that all these objects are arrays of rather large size. And with a size of> 85,000 bytes, the memory for them is allocated in the Large Object Heap, which is assembled only with the 2nd generation.
To check, we will open the section 'GC Heap Alloc Ignore Free (Coarse Sampling) stacks' in the perfview / GCOnly results. There we see the LargeObject line, in which PerfView groups the creation of large objects, and inside we will see all the same arrays that we saw in the previous analysis. We confirm the root cause of problems with the garbage collector: we create many temporary large objects.
According to the measurement results, we identified the main directions of further work: the fight against large objects in the calculation of client caches and serialization in JSON. There are several solutions to this problem:
Consider separately both cases of large objects - the calculation of client caches and serialization in JSON.
The Pyrus web client and mobile applications cache data that is available to the user (projects, forms, users, etc.). Caching is used to speed up work, it is also necessary for working in offline mode. Caches are calculated on the server and transferred to the client. They are individual for each user, as they depend on their access rights, and are frequently updated, for example, when the directories to which he has access are changed.
Thus, on the server a lot of client cache computations regularly occur, and many temporary short-lived objects are created. If the user is in a large organization, he can get access to many objects, respectively, client caches for him will be large. That is why we saw memory allocation for large temporary arrays in the Large Object Heap.
Let us analyze the proposed options for eliminating the creation of large objects:
We decided to go along the 3rd path andinvent our bicycle to write a List and HashSet, not loading the Large Object Heap.
Our ChunkedList <T> implements standard interfaces, including IList <T>, thanks to which minimal changes to the existing code are required. And the Newtonsoft.Json library used by us is automatically able to serialize it, since it implements IEnumerable <T>:
The standard List <T> has the following fields: an array for the elements and the number of filled elements. In ChunkedList <T> there is an array of arrays of elements, the number of fully populated arrays, the number of elements in the last array. Each of the arrays of elements with less than 85000 bytes:

Since ChunkedList <T> is rather complicated, we wrote detailed tests for it. Any operation should be tested at least in 2 modes: in the “small”, when the whole list fits in one piece up to 85000 bytes in size, and “large” when it consists of more than one piece. Moreover, for methods that change the size (for example, Add), there are even more scenarios: “small” -> “small”, “small” -> “large”, “large” -> “large”, “large” -> “ little". There are quite a few confusing boundary cases with which unit tests do a good job.
The situation is simplified by the fact that some of the methods from the IList interface are not used, and they can not be implemented (such as Insert, Remove). Their implementation and testing would be quite expensive. In addition, the writing of unit tests is simplified by the fact that we do not need to invent a new functionality, ChunkedList <T> should behave in the same way as List <T>. That is, all the tests are arranged as follows: create a List <T> and ChunkedList <T>, perform the same operations on them and compare the results.
We measured performance using the BenchmarkDotNet library to make sure that we didn’t slow down our code too much when switching from List <T> to ChunkedList <T>. Test, for example, adding items to the list:
And the same test using List <T> for comparison. Results when adding 500 elements (everything fits into one array):
Results when adding 50,000 items (split into several arrays):
If you look at the 'Mean' column, in which the average test run time is displayed, you can see that our implementation is slower than the standard by only 2-2.5 times. Taking into account the fact that in a real code, operations with lists are only a small part of all performed actions, this difference becomes insignificant. But the column 'Gen 2 / 1k op' (the number of assemblies of the 2nd generation for 1000 test runs) shows that we achieved the goal: with a large number of elements, ChunkedList does not create garbage in the 2nd generation, which was our task.
Similarly, ChunkedHashSet <T> implements the ISet <T> interface. When writing ChunkedHashSet <T> we reused the logic of breaking into small pieces, already implemented in ChunkedList. To do this, we took a ready-made implementation of the HashSet <T> from the .NET Reference Source, which is available under the MIT license, and replaced the arrays with ChunkedList.
In unit tests, we will also use the same trick as for the lists: we will compare the behavior of ChunkedHashSet <T> with the reference HashSet <T>.
Finally, performance tests. The main operation that we use is the union of sets, therefore we will test it:
And exactly the same test for the standard HashSet. The first test for small sets:
The second test for large sets that caused a problem with a bunch of large objects:
Results are similar with lists. ChunkedHashSet is 2-2.5 times slower, but at the same time on large sets the 2nd generation loads 2 orders of magnitude less.
The Pyrus web server provides several APIs that use different serialization. We found the creation of large objects in the API used by bots and the synchronization utility (hereinafter the Public API). Note that the main API uses its own serialization, which is not affected by this problem. We wrote about this in the article https://habr.com/ru/en/post/227595/ , in the section “2. You don’t know where your application’s bottleneck is. ” That is, the main API is already working well, and the problem manifested itself in the Public API as the number of requests and the amount of data in the responses grew.
We are going to optimize the Public API. For example, the main API, we know that you can return the response to the user in streaming mode. That is, it is necessary not to create intermediate buffers containing the entire answer, but to write the response immediately to the stream.
Upon closer inspection, we found that in the process of serializing the response, we create a temporary buffer for the intermediate result ('content' is an array of bytes containing JSON in UTF-8 encoding):
Let's trace where content is used. For historical reasons, the Public API is based on WCF, for which XML is the standard request and response format. In our case, there is a single 'Binary' element in the XML response, inside of which JSON encoded in Base64 is written:
Note that a temporary buffer is not needed here. JSON can be written directly to the XmlWriter buffer that WCF provides us with, encoding it in Base64 on the fly. Thus, we will go the first way, getting rid of memory allocation:
Here, Base64Writer is a simple wrapper over an XmlWriter that implements the Stream interface, which writes to the XmlWriter as Base64. In this case, of the entire interface, it is sufficient to implement only one Write method, which is called in the StreamWriter:
Let's try to deal with the mysterious garbage collections. We checked our code 10 times for the presence of GC.Collect calls, but this did not produce results. It was possible to catch these events in PerfView, but the call stack is not particularly indicative (DotNETRuntime / GC / Triggered event):
There is a small lead - calling RecycleLimitMonitor.RaiseRecycleLimitEvent before the induced garbage collection. Let's follow the call stack of the RaiseRecycleLimitEvent method:
The names of the methods fully correspond to their functions:
Further investigation reveals IObserver <RecycleLimitInfo> handlers are added in the RecycleLimitMonitor.Subscribe () method, which is called in the AspNetMemoryMonitor.Subscribe () method. Also, in the AspNetMemoryMonitor class, the default IObserver <RecycleLimitInfo> handler is hung (the RecycleLimitObserver class), which cleans ASP.NET caches and sometimes requests garbage collection.
The riddle of Induced GC is almost solved. It remains to clarify the question, why this garbage collection is called. RecycleLimitMonitor monitors memory usage of IIS (more precisely, the private bytes figure), and when its use approaches a certain limit, it starts to raise the RaiseRecycleLimitEvent event using a rather confusing algorithm. The AspNetMemoryMonitor.ProcessPrivateBytesLimit value is used as the memory limit, and in turn the following logic is contained in it:
The conclusion of the investigation is as follows: ASP.NET memory usage approaches its limit and begins to regularly trigger garbage collection. 'Private Memory Limit (KB)' was not set to a value, so ASP.NET was limited to 60% of the physical memory. The problem was masked by the fact that the Task Manager server showed a lot of free memory and it seemed to be enough. We increased the value of 'Private Memory Limit (KB)' in the settings of the Application Pool in IIS to 80% of the physical memory. This encourages ASP.NET to use more available memory. We also added the monitoring of the '.NET CLR Memory / # Induced GC' performance counter, so as not to miss the next time ASP.NET decides that it is approaching the limit of memory usage.
Let's see what happened to the garbage collection after all these changes. Let's start with perfview / GCCollectOnly (tracing time - 1 hour), GCStats report:
It is seen that the 2nd generation assemblies are now 2 orders of magnitude smaller than the 0th and 1st. Also, the time of these assemblies has decreased. Induced assemblies are no longer observed. Let's look at the list of assemblies of the 2nd generation:
From the Gen column it can be seen that all assemblies of the 2nd generation became background ('2B' means 2nd generation, Background). That is, most of the work is done in parallel with the execution of the application, and all threads are blocked for a short time (the 'Pause MSec' column). Let's look at the pauses when creating large objects:

It can be seen that the number of such pauses when creating large objects fell by several times.
Thanks to the changes described in the article, it was possible to significantly reduce the number and duration of 2nd generation assemblies. It was possible to find the cause of the induced assemblies, and get rid of them. The number of assemblies of the 0th and 1st generation increased, but their average duration decreased (from ~ 200 msec to ~ 60 msec). The maximum duration of assemblies of the 0th and 1st generations has decreased, but not so noticeably. Assemblies of the 2nd generation became faster, long pauses up to 1000ms were completely gone.
As for the key metric - “percentage of slow queries”, it decreased by 40% after all changes.
Thanks to the work done, we realized which performance counters are needed to assess the situation with memory and garbage collection, adding them to Zabbix for continuous monitoring. Here is a list of the most important, to which we pay attention, and find out the reason (for example, an increased flow of requests, a large amount of transmitted data, a bug in the application):
Modern programming languages can be divided into two groups. In languages like C / C ++ or Rust, manual memory management is used, so programmers spend more time writing code, managing the lifetime of objects, and then debugging. At the same time, bugs due to memory misuse are among the most difficult to debug, so most modern development is done in languages with automatic memory management. These include, for example, Java, C #, Python, Ruby, Go, PHP, JavaScript, etc. Programmers save development time, but they have to pay for this with additional execution time, which the program regularly spends on garbage collection — freeing up memory occupied by objects to which the program has no links left. In small programs, this time is negligible, but as the number of objects grows and the intensity of their creation increases, garbage collection begins to make a noticeable contribution to the total program execution time.
Pyrus web servers run on the .NET platform, which uses automatic memory management. Most garbage collections are blocking ('stop the world'), i.e. for the time of their work, stop all threads (threads) of the application. Non-blocking (background) assemblies actually also stop all threads, but for a very short period of time. During the blocking of threads, the server does not process requests, existing requests hang, new ones are added to the queue. As a result, requests that were processed at the moment of garbage collection are directly slowed down, requests are also slower executed immediately after the garbage collection is completed due to the accumulated queues. This impairs the percentage of slow queries.
')
Armed with the recently published book Konrad Kokosa: Pro .NET Memory Management (about how we brought its first copy to Russia in 2 days, you can write a separate post), entirely devoted to the topic of memory management in .NET, we began to study the problem.
Measurement
For profiling the Pyrus web server, we used the PerfView utility ( https://github.com/Microsoft/perfview ), customized for profiling .NET applications. The utility is based on the Event Tracing for Windows (ETW) mechanism and has minimal impact on the performance of the profiled application, which allows it to be used on the combat server. In addition, the performance impact depends on what types of events and what information we collect. We do not collect anything - the application works as usual. PerfView also does not require any recompilation or application restart.
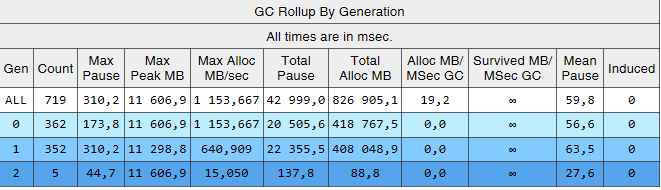
Run the PerfView trace with the / GCCollectOnly parameter (trace time 1.5 hours). In this mode, it collects only garbage collection events and has minimal impact on performance. Let's look at the Memory Group / GCStats trace report, and the summary of the garbage collector events in it:
Here we see several interesting indicators:
- The average pause time of the assembly in the 2nd generation is 700 milliseconds, and the maximum pause is about a second. This figure shows the time for which all threads in the .NET application are stopped; in particular, this pause will be added to all processed requests.
- The number of assemblies of the 2nd generation is comparable to the 1st generation and only slightly less than the number of assemblies of the 0th generation.
- The Induced column indicates 53 assemblies in the 2nd generation. Induced assembly is the result of an explicit call to GC.Collect (). In our code, we did not find a single call to this method, which means that some of the libraries used by our application are to blame.
We explain the observation about the number of garbage collections. The idea of dividing objects by their lifetime is based on the generational hypothesis hypothesis : a significant part of the created objects dies quickly, and most of the others live for a long time (in other words, few objects have an “average” lifetime). It is under this mode that the .NET garbage collector is sharpened, and in this mode, the second generation assemblies should be much less than the 0th generation. That is, for optimal work of the garbage collector, we must adjust the work of our application to the hypothesis of generations. We formulate the rule as follows: objects must either die quickly, not living to the older generation, or live to it and live there forever. This rule also applies to other platforms that use automatic memory management with separation by generations, such as Java, for example.
Interesting data for us can be extracted from another table in the GCStats report:
Here are the cases when an application tries to create a large object (in the .NET Framework objects with a size of> 85000 bytes are created in LOH - Large Object Heap), and it has to wait until the end of the 2nd generation assembly, which occurs in parallel in the background. These allocator pauses are not as critical as garbage collector pauses, since they only affect one stream. Prior to this, we used the .NET Framework version 4.6.1, and in version 4.7.1 Microsoft finalized the garbage collector, now it allows you to allocate memory in the Large Object Heap during the background generation of the 2nd generation: https://docs.microsoft.com / en-us / dotnet / framework / whats-new / # common-language-runtime-clr
Therefore, we have updated to the latest at that time version 4.7.2.
2nd generation builds
Why do we have so many older assemblies? The first assumption is that we have a memory leak. To test this hypothesis, we look at the size of the second generation (we configured monitoring of the corresponding performance counters in Zabbix). From the graphs of the size of the 2nd generation for 2 Pyrus servers, it is clear that its size first grows (mainly due to filling caches), but then stabilizes (large dips in the graph - a regular restart of the web service for updating the version):
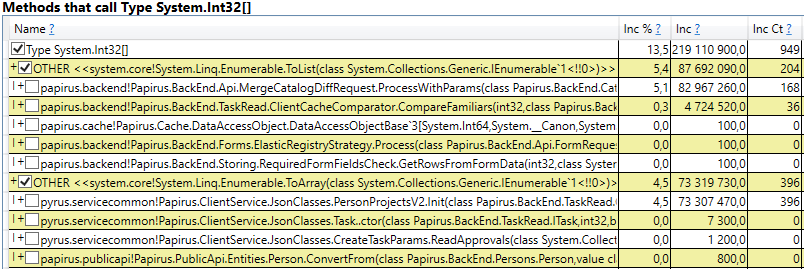
This means that there are no noticeable memory leaks, that is, a large number of assemblies of the 2nd generation arise for another reason. The next hypothesis is a large memory traffic, i.e., many objects get into the 2nd generation, and many objects die there. To find such objects in PerfView there is a / GCOnly mode. From the trace reports, look at the 'Gen 2 Object Deaths (Coarse Sampling) Stacks', which contains a selection of objects dying in the 2nd generation, along with the call stacks of the places where these objects were created. Here we see the following results:
Having opened the line, inside we see a stack of calls for those places in the code that create objects that live to the 2nd generation. Among them:
- System.Byte [] If you look inside, we will see that more than half are serialization buffers in JSON:
- Slot [System.Int32] [] (this is part of the HashSet implementation), System.Int32 [], etc. This is our code that computes client caches — those directories, forms, lists, friends, etc. that a given user sees and that are cached by him in a browser or in a mobile application:
Interestingly, buffers for JSON and for computing client caches are all temporary objects that live for a single request. Why do they live to the 2nd generation? Note that all these objects are arrays of rather large size. And with a size of> 85,000 bytes, the memory for them is allocated in the Large Object Heap, which is assembled only with the 2nd generation.
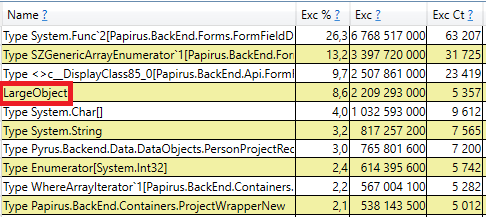
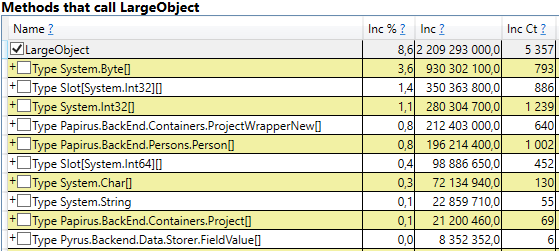
To check, we will open the section 'GC Heap Alloc Ignore Free (Coarse Sampling) stacks' in the perfview / GCOnly results. There we see the LargeObject line, in which PerfView groups the creation of large objects, and inside we will see all the same arrays that we saw in the previous analysis. We confirm the root cause of problems with the garbage collector: we create many temporary large objects.
Pyrus system changes
According to the measurement results, we identified the main directions of further work: the fight against large objects in the calculation of client caches and serialization in JSON. There are several solutions to this problem:
- The simplest thing is not to create large objects. For example, if a large buffer B is used in consecutive data transformations A-> B-> C, then sometimes these transformations can be combined, turning into A-> C, and getting rid of the creation of object B. This option is not always applicable, but it the easiest and most effective.
- Object pool Instead of constantly creating new objects and throwing them out, loading the garbage collector, we can store a collection of free objects. In the simplest case, when we need a new object, then we take it from the pool, or create a new one if the pool is empty. When the object is no longer needed, we return it to the pool. A good example is ArrayPool in .NET Core, which is also available in the .NET Framework as part of the System.Buffers Nuget package.
- Use small instead of large objects.
Consider separately both cases of large objects - the calculation of client caches and serialization in JSON.
Calculating client caches
The Pyrus web client and mobile applications cache data that is available to the user (projects, forms, users, etc.). Caching is used to speed up work, it is also necessary for working in offline mode. Caches are calculated on the server and transferred to the client. They are individual for each user, as they depend on their access rights, and are frequently updated, for example, when the directories to which he has access are changed.
Thus, on the server a lot of client cache computations regularly occur, and many temporary short-lived objects are created. If the user is in a large organization, he can get access to many objects, respectively, client caches for him will be large. That is why we saw memory allocation for large temporary arrays in the Large Object Heap.
Let us analyze the proposed options for eliminating the creation of large objects:
- Full disposal of large objects. This approach is inapplicable, since the data preparation algorithms use, among other things, sorting and union of sets, and they require temporary buffers.
- Using a pool of objects. This approach has difficulties:
- A variety of used collections and types of elements in them: HashSet, List and Array are used (the latter two can be combined). The collections contain Int32, Int64, as well as all sorts of data classes. For each type used, you will need your own pool, which will also store collections of different sizes.
- Difficult time of life collections. To take advantage of the pool, objects will have to be returned to it after use. This can be done if the object is used in the same method. But in our case, the situation is more complicated, since many large objects travel between methods, put into data structures, are shifted to other structures, etc.
- Implementation. There is an ArrayPool from Microsoft, but we also need a List and HashSet. We did not find any suitable library, so classes would have to be implemented by ourselves.
- A variety of used collections and types of elements in them: HashSet, List and Array are used (the latter two can be combined). The collections contain Int32, Int64, as well as all sorts of data classes. For each type used, you will need your own pool, which will also store collections of different sizes.
- Use small objects. A large array can be divided into several small pieces, which I will not load with the Large Object Heap, but will be created in the 0th generation, and then proceed along the standard path in the 1st and 2nd. We hope that they will not live to the 2nd, but will be collected by the garbage collector in the 0th, or at least in the 1st generation. The advantage of this approach is that the changes to the existing code are minimal. Difficulties:
- Implementation. We did not find suitable libraries, so classes would have to be written by ourselves. The absence of libraries is understandable, since the “collections that do not load the Large Object Heap” scenario is a very narrow scope.
We decided to go along the 3rd path and
Piece list
Our ChunkedList <T> implements standard interfaces, including IList <T>, thanks to which minimal changes to the existing code are required. And the Newtonsoft.Json library used by us is automatically able to serialize it, since it implements IEnumerable <T>:
public sealed class ChunkedList<T> : IList<T>, ICollection<T>, IEnumerable<T>, IEnumerable, IList, ICollection, IReadOnlyList<T>, IReadOnlyCollection<T> { The standard List <T> has the following fields: an array for the elements and the number of filled elements. In ChunkedList <T> there is an array of arrays of elements, the number of fully populated arrays, the number of elements in the last array. Each of the arrays of elements with less than 85000 bytes:
private T[][] chunks; private int currentChunk; private int currentChunkSize; Since ChunkedList <T> is rather complicated, we wrote detailed tests for it. Any operation should be tested at least in 2 modes: in the “small”, when the whole list fits in one piece up to 85000 bytes in size, and “large” when it consists of more than one piece. Moreover, for methods that change the size (for example, Add), there are even more scenarios: “small” -> “small”, “small” -> “large”, “large” -> “large”, “large” -> “ little". There are quite a few confusing boundary cases with which unit tests do a good job.
The situation is simplified by the fact that some of the methods from the IList interface are not used, and they can not be implemented (such as Insert, Remove). Their implementation and testing would be quite expensive. In addition, the writing of unit tests is simplified by the fact that we do not need to invent a new functionality, ChunkedList <T> should behave in the same way as List <T>. That is, all the tests are arranged as follows: create a List <T> and ChunkedList <T>, perform the same operations on them and compare the results.
We measured performance using the BenchmarkDotNet library to make sure that we didn’t slow down our code too much when switching from List <T> to ChunkedList <T>. Test, for example, adding items to the list:
[Benchmark] public ChunkedList<int> ChunkedList() { var list = new ChunkedList<int>(); for (int i = 0; i < N; i++) list.Add(i); return list; } And the same test using List <T> for comparison. Results when adding 500 elements (everything fits into one array):
| Method | Mean | Error | Stddev | Gen 0 / 1k Op | Gen 1 / 1k Op | Gen 2 / 1k Op | Allocated Memory / Op |
| StandardList | 1.415 us | 0.0149 us | 0.0140 us | 0.6847 | 0.0095 | - | 4.21 KB |
| ChunkedList | 3.728 us | 0.0238 us | 0.0222 us | 0.6943 | 0.0076 | - | 4.28 KB |
Results when adding 50,000 items (split into several arrays):
| Method | Mean | Error | Stddev | Gen 0 / 1k Op | Gen 1 / 1k Op | Gen 2 / 1k Op | Allocated Memory / Op |
| StandardList | 146.273 us | 3.1466 us | 4.8053 us | 124.7559 | 124.7559 | 124.7559 | 513.23 KB |
| ChunkedList | 287.687 us | 1.4630 us | 1.2969 us | 41.5039 | 20.5078 | - | 256.75 KB |
Detailed description of the columns in the results
BenchmarkDotNet=v0.11.4, OS=Windows 10.0.17763.379 (1809/October2018Update/Redstone5) Intel Core i7-8700K CPU 3.70GHz (Coffee Lake), 1 CPU, 12 logical and 6 physical cores [Host] : .NET Framework 4.7.2 (CLR 4.0.30319.42000), 64bit RyuJIT-v4.7.3324.0 DefaultJob : .NET Framework 4.7.2 (CLR 4.0.30319.42000), 64bit RyuJIT-v4.7.3324.0 // * Hints * Outliers ListAdd.StandardList: Default -> 2 outliers were removed ListAdd.ChunkedList: Default -> 1 outlier was removed // * Legends * Mean : Arithmetic mean of all measurements Error : Half of 99.9% confidence interval StdDev : Standard deviation of all measurements Gen 0/1k Op : GC Generation 0 collects per 1k Operations Gen 1/1k Op : GC Generation 1 collects per 1k Operations Gen 2/1k Op : GC Generation 2 collects per 1k Operations Allocated Memory/Op : Allocated memory per single operation (managed only, inclusive, 1KB = 1024B) 1 us : 1 Microsecond (0.000001 sec) If you look at the 'Mean' column, in which the average test run time is displayed, you can see that our implementation is slower than the standard by only 2-2.5 times. Taking into account the fact that in a real code, operations with lists are only a small part of all performed actions, this difference becomes insignificant. But the column 'Gen 2 / 1k op' (the number of assemblies of the 2nd generation for 1000 test runs) shows that we achieved the goal: with a large number of elements, ChunkedList does not create garbage in the 2nd generation, which was our task.
Piece set
Similarly, ChunkedHashSet <T> implements the ISet <T> interface. When writing ChunkedHashSet <T> we reused the logic of breaking into small pieces, already implemented in ChunkedList. To do this, we took a ready-made implementation of the HashSet <T> from the .NET Reference Source, which is available under the MIT license, and replaced the arrays with ChunkedList.
In unit tests, we will also use the same trick as for the lists: we will compare the behavior of ChunkedHashSet <T> with the reference HashSet <T>.
Finally, performance tests. The main operation that we use is the union of sets, therefore we will test it:
public ChunkedHashSet<int> ChunkedHashSet(int[][] source) { var set = new ChunkedHashSet<int>(); foreach (var arr in source) set.UnionWith(arr); return set; } And exactly the same test for the standard HashSet. The first test for small sets:
var source = new int[][] { Enumerable.Range(0, 300).ToArray(), Enumerable.Range(100, 600).ToArray(), Enumerable.Range(300, 1000).ToArray(), } | Method | Mean | Error | Stddev | Gen 0 / 1k Op | Gen 1 / 1k Op | Gen 2 / 1k Op | Allocated Memory / Op |
| StandardHashSet | 30.16 us | 0.1046 us | 0.0979 us | 9.3079 | 1.6785 | - | 57.41 KB |
| ChunkedHashSet | 73.54 us | 0.5919 us | 0.5247 us | 9.5215 | 1.5869 | - | 58.84 KB |
The second test for large sets that caused a problem with a bunch of large objects:
var source = new int[][] { Enumerable.Range(0, 30000).ToArray(), Enumerable.Range(10000, 60000).ToArray(), Enumerable.Range(30000, 100000).ToArray(), } | Method | Mean | Error | Stddev | Gen 0 / 1k Op | Gen 1 / 1k Op | Gen 2 / 1k Op | Allocated Memory / Op |
| StandardHashSet | 3,031.30 us | 32.0797 us | 28.4378 us | 699.2188 | 667.9688 | 664.0625 | 4718.23 KB |
| ChunkedHashSet | 7,189.66 us | 25.6319 us | 23.9761 us | 539.0625 | 265.6250 | 7.8125 | 3280.71 KB |
Results are similar with lists. ChunkedHashSet is 2-2.5 times slower, but at the same time on large sets the 2nd generation loads 2 orders of magnitude less.
JSON serialization
The Pyrus web server provides several APIs that use different serialization. We found the creation of large objects in the API used by bots and the synchronization utility (hereinafter the Public API). Note that the main API uses its own serialization, which is not affected by this problem. We wrote about this in the article https://habr.com/ru/en/post/227595/ , in the section “2. You don’t know where your application’s bottleneck is. ” That is, the main API is already working well, and the problem manifested itself in the Public API as the number of requests and the amount of data in the responses grew.
We are going to optimize the Public API. For example, the main API, we know that you can return the response to the user in streaming mode. That is, it is necessary not to create intermediate buffers containing the entire answer, but to write the response immediately to the stream.
Upon closer inspection, we found that in the process of serializing the response, we create a temporary buffer for the intermediate result ('content' is an array of bytes containing JSON in UTF-8 encoding):
var serializer = Newtonsoft.Json.JsonSerializer.Create(...); byte[] content; var sw = new StreamWriter(new MemoryStream(), new UTF8Encoding(false)); using (var writer = new Newtonsoft.Json.JsonTextWriter(sw)) { serializer.Serialize(writer, result); writer.Flush(); content = ms.ToArray(); } Let's trace where content is used. For historical reasons, the Public API is based on WCF, for which XML is the standard request and response format. In our case, there is a single 'Binary' element in the XML response, inside of which JSON encoded in Base64 is written:
public class RawBodyWriter : BodyWriter { private readonly byte[] _content; public RawBodyWriter(byte[] content) : base(true) { _content = content; } protected override void OnWriteBodyContents(XmlDictionaryWriter writer) { writer.WriteStartElement("Binary"); writer.WriteBase64(_content, 0, _content.Length); writer.WriteEndElement(); } } Note that a temporary buffer is not needed here. JSON can be written directly to the XmlWriter buffer that WCF provides us with, encoding it in Base64 on the fly. Thus, we will go the first way, getting rid of memory allocation:
protected override void OnWriteBodyContents(XmlDictionaryWriter writer) { var serializer = Newtonsoft.Json.JsonSerializer.Create(...); writer.WriteStartElement("Binary"); Stream stream = new Base64Writer(writer); Var sw = new StreamWriter(stream, new UTF8Encoding(false)); using (var jsonWriter = new Newtonsoft.Json.JsonTextWriter(sw)) { serializer.Serialize(jsonWriter, _result); jsonWriter.Flush(); } writer.WriteEndElement(); } Here, Base64Writer is a simple wrapper over an XmlWriter that implements the Stream interface, which writes to the XmlWriter as Base64. In this case, of the entire interface, it is sufficient to implement only one Write method, which is called in the StreamWriter:
public class Base64Writer : Stream { private readonly XmlWriter _writer; public Base64Writer(XmlWriter writer) { _writer = writer; } public override void Write(byte[] buffer, int offset, int count) { _writer.WriteBase64(buffer, offset, count); } <...> } Induced GC
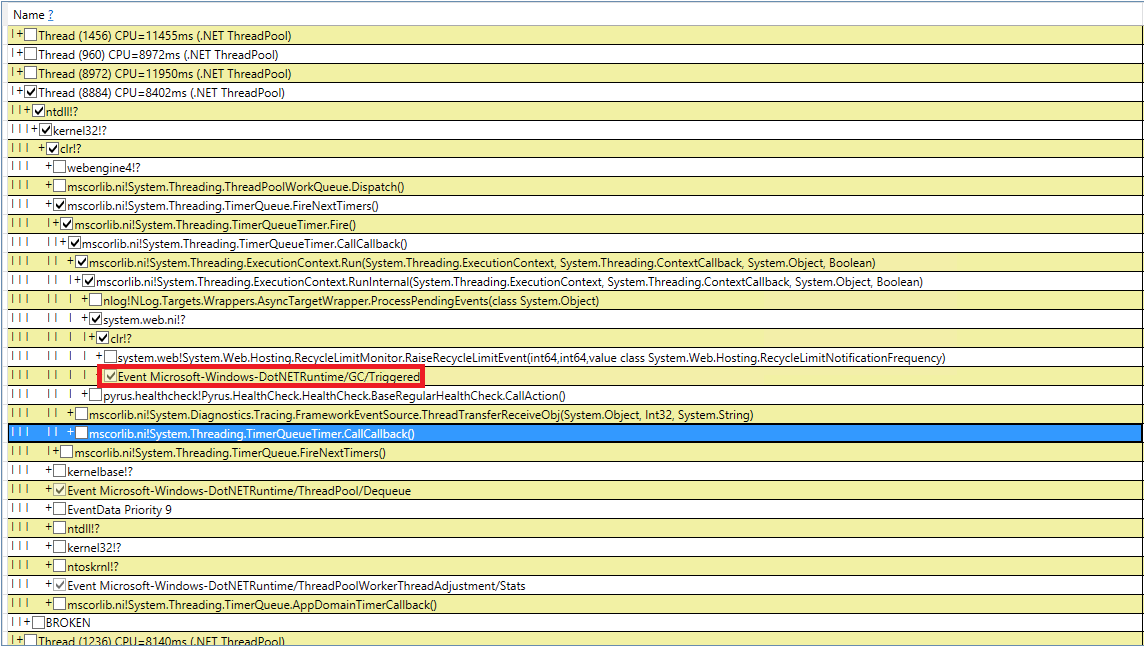
Let's try to deal with the mysterious garbage collections. We checked our code 10 times for the presence of GC.Collect calls, but this did not produce results. It was possible to catch these events in PerfView, but the call stack is not particularly indicative (DotNETRuntime / GC / Triggered event):
There is a small lead - calling RecycleLimitMonitor.RaiseRecycleLimitEvent before the induced garbage collection. Let's follow the call stack of the RaiseRecycleLimitEvent method:
RecycleLimitMonitor.RaiseRecycleLimitEvent(...) RecycleLimitMonitor.RecycleLimitMonitorSingleton.AlertProxyMonitors(...) RecycleLimitMonitor.RecycleLimitMonitorSingleton.CollectInfrequently(...) RecycleLimitMonitor.RecycleLimitMonitorSingleton.PBytesMonitorThread(...) The names of the methods fully correspond to their functions:
- In the RecycleLimitMonitor.RecycleLimitMonitorSingleton constructor, a timer is created that calls the PBytesMonitorThread at a certain interval.
- PBytesMonitorThread collects statistics on memory usage and, under some conditions, calls CollectInfrequently.
- CollectInfrequently calls AlertProxyMonitors, results in a bool, and calls GC.Collect () if it receives true. He also keeps track of the time that has passed since the last call of the garbage collector, and does not cause it too often.
- AlertProxyMonitors goes through the list of running IIS web applications, for each raises the corresponding RecycleLimitMonitor object, and calls RaiseRecycleLimitEvent.
- RaiseRecycleLimitEvent raises the list of IObserver <RecycleLimitInfo>. Handlers receive as a RecycleLimitInfo parameter, in which they can set the RequestGC flag, which is returned in CollectInfrequently, causing an induced garbage collection.
Further investigation reveals IObserver <RecycleLimitInfo> handlers are added in the RecycleLimitMonitor.Subscribe () method, which is called in the AspNetMemoryMonitor.Subscribe () method. Also, in the AspNetMemoryMonitor class, the default IObserver <RecycleLimitInfo> handler is hung (the RecycleLimitObserver class), which cleans ASP.NET caches and sometimes requests garbage collection.
The riddle of Induced GC is almost solved. It remains to clarify the question, why this garbage collection is called. RecycleLimitMonitor monitors memory usage of IIS (more precisely, the private bytes figure), and when its use approaches a certain limit, it starts to raise the RaiseRecycleLimitEvent event using a rather confusing algorithm. The AspNetMemoryMonitor.ProcessPrivateBytesLimit value is used as the memory limit, and in turn the following logic is contained in it:
- If IIS is configured to 'Private Memory Limit (KB)' for the Application Pool, then the value in kilobytes is taken from there.
- Otherwise, for 64-bit systems, 60% of physical memory is taken (for 32-bit, logic is more complicated).
The conclusion of the investigation is as follows: ASP.NET memory usage approaches its limit and begins to regularly trigger garbage collection. 'Private Memory Limit (KB)' was not set to a value, so ASP.NET was limited to 60% of the physical memory. The problem was masked by the fact that the Task Manager server showed a lot of free memory and it seemed to be enough. We increased the value of 'Private Memory Limit (KB)' in the settings of the Application Pool in IIS to 80% of the physical memory. This encourages ASP.NET to use more available memory. We also added the monitoring of the '.NET CLR Memory / # Induced GC' performance counter, so as not to miss the next time ASP.NET decides that it is approaching the limit of memory usage.
Repeated measurements
Let's see what happened to the garbage collection after all these changes. Let's start with perfview / GCCollectOnly (tracing time - 1 hour), GCStats report:
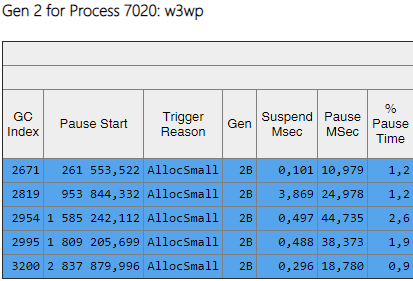
It is seen that the 2nd generation assemblies are now 2 orders of magnitude smaller than the 0th and 1st. Also, the time of these assemblies has decreased. Induced assemblies are no longer observed. Let's look at the list of assemblies of the 2nd generation:
From the Gen column it can be seen that all assemblies of the 2nd generation became background ('2B' means 2nd generation, Background). That is, most of the work is done in parallel with the execution of the application, and all threads are blocked for a short time (the 'Pause MSec' column). Let's look at the pauses when creating large objects:
It can be seen that the number of such pauses when creating large objects fell by several times.
Results
Thanks to the changes described in the article, it was possible to significantly reduce the number and duration of 2nd generation assemblies. It was possible to find the cause of the induced assemblies, and get rid of them. The number of assemblies of the 0th and 1st generation increased, but their average duration decreased (from ~ 200 msec to ~ 60 msec). The maximum duration of assemblies of the 0th and 1st generations has decreased, but not so noticeably. Assemblies of the 2nd generation became faster, long pauses up to 1000ms were completely gone.
As for the key metric - “percentage of slow queries”, it decreased by 40% after all changes.
Thanks to the work done, we realized which performance counters are needed to assess the situation with memory and garbage collection, adding them to Zabbix for continuous monitoring. Here is a list of the most important, to which we pay attention, and find out the reason (for example, an increased flow of requests, a large amount of transmitted data, a bug in the application):
| Performance counter | Description | When should I pay attention |
| \ Process (*) \ Private Bytes | The amount of memory allocated for the application | Values greatly exceed the threshold. As a threshold, you can take the median for 2 weeks from the maximum daily indicators. |
| \ .NET CLR Memory (*) \ # Gen 2 Collections | The amount of memory in the older generation | |
| \ .NET CLR Memory (*) \ Large Object Heap size | Memory size for large objects | |
| \ .NET CLR Memory (*) \% Time in GC | The percentage of time spent on garbage collection | The value is greater than 5%. |
| \ .NET CLR Memory (*) \ # Induced GC | The number of induced assemblies | Value is greater than 0. |
Source: https://habr.com/ru/post/452298/
All Articles