The experience of creating position maps for Wikipedia
For several years I worked on maps that are used in Russian and other language sections of Wikipedia. In total, I created more than 300 cards . I am not a professional cartographer, and I have no special education in this area. Apparently, I just liked to make cards :)
In this article, I want to share the experience of creating maps for Wikipedia, with a focus on positional maps.
Position Cards
All graphic materials for Wikipedia, published under free licenses, are posted on Wikimedia Commons , this allows them to be used in any Wikimedia projects and in all language sections of Wikipedia.
Among all types of maps on Wikipedia, the so-called “position maps” stand out. The peculiarity here is that it is not just an image of a map, but an image in a known projection, with known geographic coordinates for corners. For such a map, in each language section where it is used, a special template is created that describes this metadata. Having such a template, we can apply it on any page, placing markers for objects of interest on top of the map. The coordinates of the objects are described in the form of geographical coordinates, the formulas in the templates are calculated exactly where to put the marker. For example, on the page about the region, you can insert a map of this region and mark regional centers and major cities on it.

An example of using a positional card in a Pebble Island article card. The red marker and the inscription are automatically placed in place of the object on top of the map image.
Position maps are used in all articles on administrative units: countries / districts / cities / towns, etc., as well as in many articles on geographical features. It often turns out that immediately after creating a positional map, it is used in 20-50 existing Wikipedia articles.
In a positional map template, in theory, two map drawings should be used at once: a “contour” / “political” map, and a “physical” / “geographical” map with the same coordinates, projection, and dimensions. The contour map is usually vector (SVG), the physical map can be vector, but most often it is raster (usually PNG).
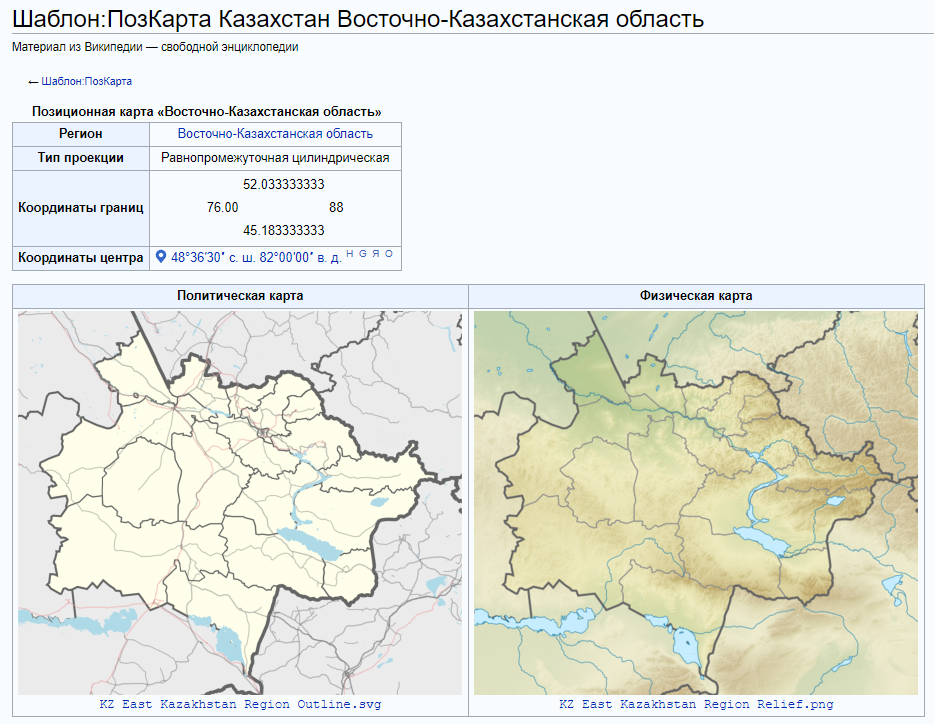
Example of a positional map template with two types of maps
There are a lot of positional maps: they must cover all levels from the world as a whole to individual regions, small islands, etc. In addition to the positional map, so-called so-called is created for all administrative objects “Locator” is a map on which the region of interest is highlighted with a bright color ( an example of a map-locator). At the “upper” level (world, country) with position maps, everything is relatively good, but at the “lower” level (level of districts) everything is often quite bad: there are no position maps or there are, but of insufficient quality, or made in an inappropriate / non-standard style.
Only for the Russian Federation, we have 83 subjects, if we add to this area, then we’ll probably get a thousand or more administrative units, each of which needs a position map, including a contour map, a physical map, a locator card ... In addition, from time to time there are changes in the form “a new decree has been issued”: a legal document appears that changes the boundaries of administrative units, divides / unites them, etc. And of course, in all such cases, you need to redraw one or more position maps.
In general, I think you already understood - the cards are very necessary and they need a lot :)
Initial data for maps
For position maps, images with a free license should be used. This means that the source data for such cards must be free.
Baseline data for the maps I used:
- OpenStreetMap - the main source of vector data; but it should be borne in mind that the data obtained by crowdsourcing, therefore, in some places they are dense and high-quality, sometimes very incomplete. There are also errors in the data, so the resulting cards must be carefully checked.
- GSHHG - vector data in GMT (see below); can be used for maps of large scales, poorly suited for small scales.
- ETOPO1 (resolution ~ 1.85 km, volume ~ 890 MB), ETOPO2 (resolution 2 '= 3.6 km) - elevation maps, including the seabed topography (bathymetry).
- TOPO30 (resolution ~ = 0.9 km, volume ~ 1800 MB) - elevation map, including the seabed topography.
- GLOBE (resolution 30 "~ = 0.9 km) - elevation map.
- SRTM (SRTM3 resolution: 3 "~ = 90m) is a rather detailed height map, but because of this it is rather heavy (each 1x1 degree file weighs ~ 2.8 MB), so you usually have to download only the files you need. In addition, the SRTM source data has gaps that need to be closed by interpolating the missing points by adjacent ones. You can do this yourself, or use “void-filled" source code, such as SRTM-Plus. SRTM is a height map only for sushi, does not contain data on the seabed topography.
Projections
In the overwhelming majority of cases we work with a projection which is called “equidistant cylindrical”. This same family of projections includes the Mercator projection and its special case - “Google projection” or “Web Mercator projection”, which is used by all major web maps. The formulas for this projection are fairly simple, moreover, the templates of positional maps already “know” this projection.
In the remaining few cases, you will have to google the desired projection and read the special literature in order to understand exactly how the x, y coordinates are derived from latitude and longitude. Mediawiki has an advanced mechanism for calculating expressions (including those with trigonometric functions), you can use it to check your maps, even before you make a position map template on them (examples can be viewed here ).
Map Creation Tools
There are a lot of tools for creating maps (geographic information systems, GIS), including free and open source. But in order for a card to be open it is not necessary to use an open and free system, it is enough that the original data is open, and that you yourself put an open license on the finished card. (But there must be a lot of nuances here, I don’t dare to get into the area of copyright, not mine :)
To create maps, I used mainly three programs described below.
Maaperitive
Maperitive is a free, but closed product. It is extremely useful when working with data OpenStreetMap, works with data from both the OSM site, and with saved dumps. Allows you to select a stylus and save the map in SVG format. There are a number of ready-made stylists and you can write your own. I have prepared several style files, and use them for exporting to the SVG borders of the districts, and maps of the districts with settlements.
Generic Mapping Tools (GMT)
In general, Generic Mapping Tools (GMT) is a free set of command line utilities designed to process and visualize scientific data, including a number of its tools that allow you to work with geodata, i.e. we can use GMT as a console GIS. The finished map (or a separate layer for the future map) is obtained as a result of a sequence of invoking utilities. Usually I write a batch file in which all parameters are set and utilities are invoked. At first glance it looks difficult, but to me as a programmer, this approach seems clear and familiar. In addition, repeatability is provided here: to create the map again, I can always run the script again.
An example of a batch file (see also here ):
set PATH=C:\programs\GMT5\bin;%PATH% set GSBIN=C:\PROGRA~1\gs\gs9.04/bin set COORDSCUT=144.7492/157.3007/42.9694/51.3837 rem width = xmaxsvg / 150.0 * 2.54 set PAPERX=14.9352 rem height = ymaxsvg / 150.0 * 2.54 set PAPERY=16.0189333333333 grdcut.exe ETOPO1_Bed_g_gmt4.grd -R%COORDSCUT% -Gh_cor_cut.grd grdgradient h_cor_cut.grd -Ne0.3 -A315 -M -Ghi.grd grdimage h_cor_cut.grd -Ihi.grd -Cwiki-water-verlauf2.cpt -P -R%COORDSCUT% -JX%PAPERX%cd/%PAPERY%cd --PAPER_MEDIA=Custom_%PAPERX%cx%PAPERY%c -X0 -Y0 -K > map.eps pscoast.exe -JX%PAPERX%cd/%PAPERY%cd -R%COORDSCUT% -Gc -P -Df --PAPER_MEDIA=Custom_%PAPERX%cx%PAPERY%c -X0 -Y0 -O -K >> map.eps grdimage h_cor_cut.grd -Ihi.grd -Cmount.cpt -P -R%COORDSCUT% -JX%PAPERX%cd/%PAPERY%cd --PAPER_MEDIA=Custom_%PAPERX%cx%PAPERY%c -X0 -Y0 -O -K >> map.eps pscoast.exe -JX%PAPERX%cd/%PAPERY%cd -R%COORDSCUT% -Q -P -Df --PAPER_MEDIA=Custom_%PAPERX%cx%PAPERY%c -X0 -Y0 -O -K >> map.eps pscoast.exe -JX%PAPERX%cd/%PAPERY%cd -R%COORDSCUT% -Na -Ia/0.25p,#0978AB -W0.25,#0978AB -P -Df --PAPER_MEDIA=Custom_%PAPERX%cx%PAPERY%c -X0 -Y0 -O >> map.eps %GSBIN%\gswin32c.exe -dSAFER -dBATCH -dNOPAUSE -dGraphicsAlphaBits=4 -sDEVICE=pngalpha -dEPSCrop -r150 -sOutputFile=Oblast_etopo.png map.eps Result:
As part of GMT, along with the command line tools, data is also supplied, this set is called GSHHG , maps from this data are created using the pscoast utility included in GMT.
Inkscape
Inkscape is a free and open vector graphics editor, the main format of which is SVG.
Maperitive and GMT I usually use as tools for the preparation of individual layers of the future map. Then the resulting layers are imported into separate layers in the Inkscape document, and all the final work on the map is already there. For example, for a positional map, it is necessary that the area shown on the map be “highlighted” —the color on the outline map and the shading on the physical map. This is already manual work on objects and layers in Inkscape.
The final step in preparing the map images will be to save the SVG (for the vector map) or export the PNG (for the raster).
Card making process
- I usually begin by taking the area of the future map and looking at the source data that I have for this area. I create a primitive contour map via GMT on GSHHG data, try to render the relief of the same area on ETOPO1, TOPO30 data, see how this area looks in OpenStreetMap. It happens that I refuse to create a map at this stage, if I see that the available data is not enough or they are of poor quality, contain errors or large gaps.
- Next, based on approximate renders, I choose on which data I will make the map.
- Create separate layers of the map. As a rule, a layer of boundaries is obtained separately (for example, a vector from OSM), a separate relief pattern for land and a separate layer of underwater relief (bathymetry), a separate coastline layer and a layer of rivers and reservoirs. It often happens that two raster layers have different resolutions, and here you have to play with interpolation, so that they look more or less organic. For example, the terrain map for sushi is taken from ETOPO1, because this area is better represented there, and bathymetry is taken from TOPO30, and the resolution of these two sources differs twice. Then, for a lower resolution, we do an increase in the resolution with interpolation so that no “squares” appear, no moire effect appears, etc.
- Using Inkscape, we put together separate layers of the map. We perform the necessary manual work, if necessary. We try to export the map to a raster, carefully review and identify shortcomings, correct and repeat. The result is map files ready for uploading to Commons.
- We upload map files to Wikimedia Commons; we document there. Each file should be written about what kind of map it is, which object, with which coordinates and in which projection, which source data was used with which licenses, and which tools the work was done.
- Create or update a positional card template in ru-wiki, check its use. Make sure that the objects are placed in the right places of the map, i.e. that the coordinates of the corners of the map are set correctly, and the map itself corresponds to these coordinates. After that, we update the templates for this positional map in other language sections.
Conclusion
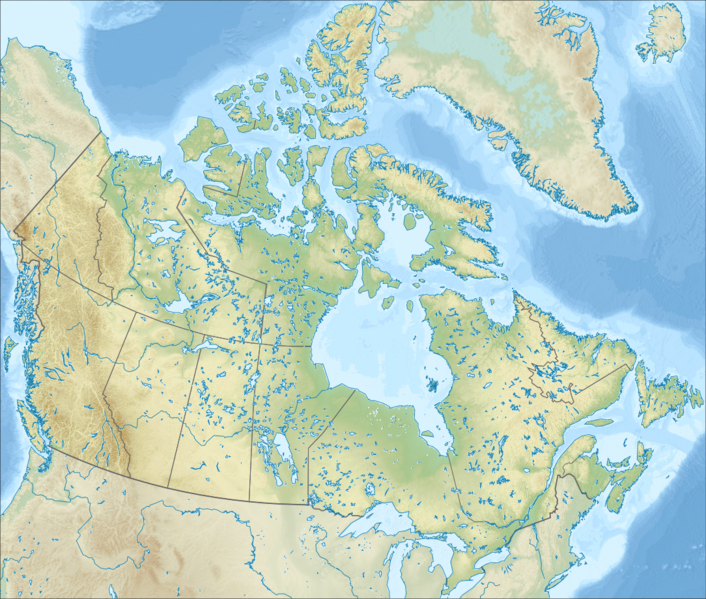
It took me from 20-30 minutes to create one map (in simple cases, when a number of similar maps of regions are done as on a conveyor), up to 4-6 hours (in difficult cases, when there were problems with the source data and a lot of manual work was needed work). It took me several days to go to the physical map of Canada (see KDPV): it took me to select a projection that was already used on the contour map.
If we talk about "what I get from this," then probably - a lot of aesthetic pleasure, from what cards are obtained.
Thank you for reading, I hope my experience will somehow come in handy :)
')
Source: https://habr.com/ru/post/451418/
All Articles