What is the perfect reporting system. Is it possible to understand what is happening in the company?
What should an ideal reporting system look like in a project management system? Can the company bring real benefits by unloading something from the management system, or will it always be just formalities? Is it possible to find in the data management system something interesting and new for the company itself?
I am particularly concerned about these issues. I've been working on YouGile control system for the last two years.
The key problem of reporting is that the information in any one data slice will always be incomplete, no matter how hard the company tries to note and fix everything. The simplest example is to look at the list of completed tasks for people, and this is true, at best, only by 80%. Not all tasks are fixed, not all are marked as completed, some metrics are systemically distorted.
')
At the same time, the requirement for reports from incomplete information is very high - reports must form an objective understanding of what is happening.
What we finally did after studying this question is below in a short video. And under the cut description of the process, how to come to this.
The reality in companies is somewhat worse than just 20% of incompleteness in each specific report. Usually the situation is such that in general “at least somewhere” only half of the tasks are fixed, and at the same time in different places: in messengers, in the mail, in oral conversations ...
With the emergence of a centralized management system and the formation of at least some culture of setting tasks, the situation improves slightly, but the information system cannot and should not become a control and accounting system. The more rigid rules there are regarding what should be recorded in the system, the more accurate the reports will be. But the system will voluntarily use less. The circle of the struggle for transparency closes.
What about a company that develops a management system? How to create an objective picture of what is happening without the condition that all information will be recorded?
2 years ago - we start to do a project management system with an emphasis on communication. We implement the approach when each task is a chat and we try to tighten the teams in the project activity through communication. Reports are ignored. We believe that such a tool does not affect the use of the system, but rather only repels the real team from a free planning tool.
1.5 years ago - regularly receive a certain number of requests for reports. The most common request for a list of tasks for people. We are starting to learn how reports are used by our customers who come from other systems. We understand that reports are there. In the most popular systems, you can get on several different reports: by people, by time, by completeness, by projects. BUT, talking to users, it turns out that no one really uses it. Exceptions are only cases of initially strictly regulated processes, such as HelpDesk or BugTracker.
1 year ago - we are releasing such a function as a configurator that allows you to write your own scripts within the system. Including upload any data. From time to time, large customers set up uploads directly under their requests. And a slightly strange situation occurs - sometimes companies manage to extract real benefits from this - they tell us that they are uploading a lot of data, analyzing them and making any decisions. And sometimes it becomes a ballast that no one uses.
8 months ago - we go about the requests from customers and make several reports like in most other systems: a tape of all events and a special board with tasks for employees. The function is rarely used, but those who use are satisfied and want more of this information. They explain that they would like to see more details on these or other processes.
5 months ago - all large customers are starting to immediately deliver the system with all sorts of reports on scripts that were developed earlier. There are many, they are very different, but not very convenient, since there are no normal interfaces. But at the same time customers are quite satisfied with this approach. We notice a very simple truth: when there are many reports, for some reason they start to work. Companies report that they are able to extract information on the basis of which certain decisions can be made. There are requests for reports on project viewing by employees and the distribution of team attention.
3 weeks ago - once again we speak with clients and come to a simple conclusion: the number of reports from different sides is justified by the fact that some kind of understanding can be created only if the picture is viewed from many different sides. However, these parties in different situations may be very different.
We release the report designer. We try to do so that you can get anything, but at the same time maintain the simplicity of the interface.
Let's start with the simple. Everything that is to system, it is possible to filter, sort and display in the form of the table. Download in Excel format or set up regular mail delivery. All information, of course, changes dynamically with changes in projects.
The report generation interface looks like this:
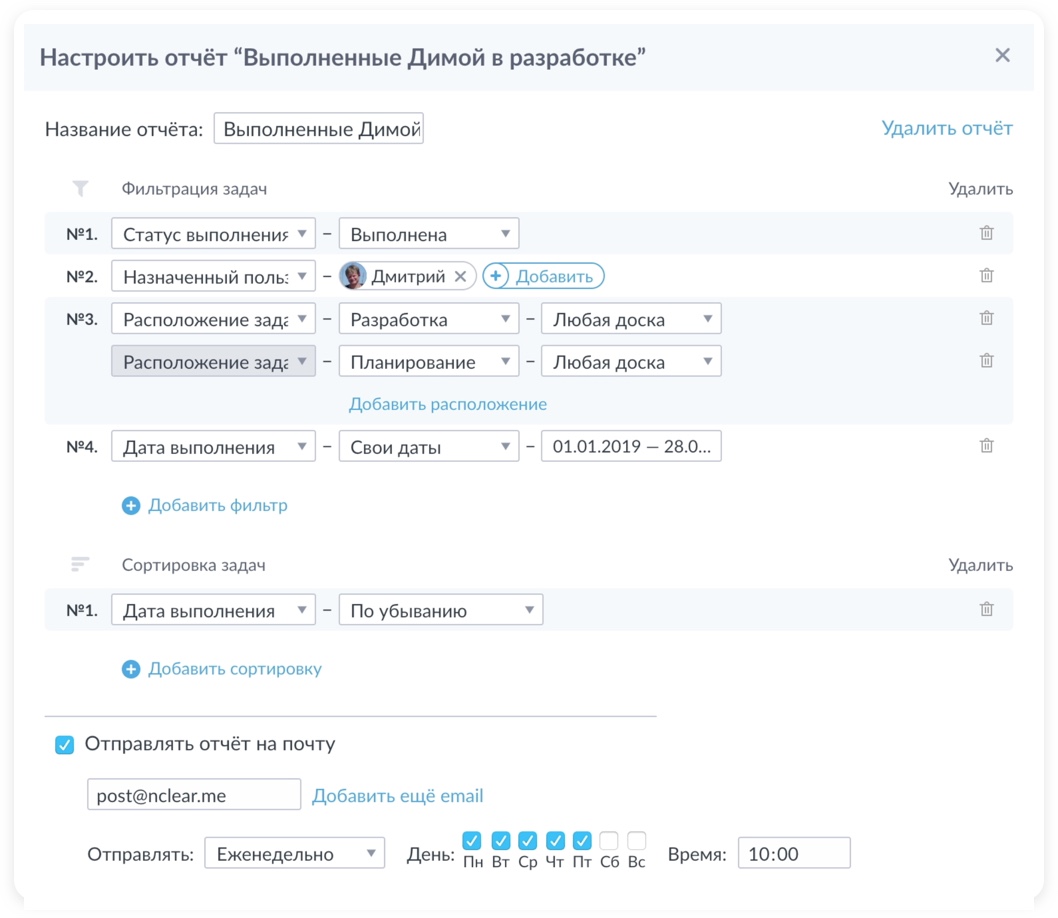
The report can be formed by 15 parameters and set up rules for multisorting. There are a couple of unusual parameters: the date of the last move and the date of the last message. For example, you can select and view the tasks for which the most active communication was. If we consider that each task is a separate chat and we communicate a lot, then the download is very interesting.
As a result, the report looks like a table with the possibility of multi-sorting.

And here, to be honest, while there is nothing supernatural - just a good flexible system for receiving reports on tasks, with accessible interfaces. Yes, there are a couple of interesting parameters and a system for sending reports on a schedule. But a truly powerful tool for creating transparency in a company is “bulletins”.
Reports
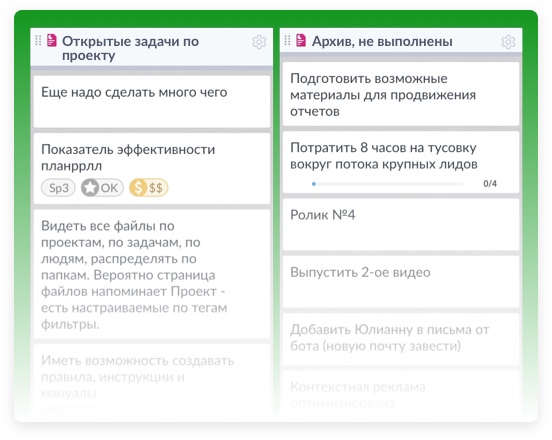
Reports are all the same as reports, but tasks are not displayed as a table with many parameters, but as a column on the board. That is, along with the usual columns, on the board you can create a special column where tasks are displayed according to specified filtering principles from other projects and boards for arbitrary periods of time. The tasks in the bulletins are read-only, they cannot be changed, but you can participate in chatting.
Here is the simplest example of several such columns:

This tool, along with the reporting system, has many applications for creating an understanding of what is happening in the company. You can make separate boards for observation, you can add to the work board a list of current tasks from the neighboring department, you can display all the important tasks for yourself, one column for each project and so on.
1. We want to know what the team does
In a normal situation, we would have to upload a report on completed tasks and maybe on new assigned tasks.
Now we can make a summary: in the first column display the completed tasks for the last 7 days, in the second all new tasks in the last 7 days, in the third column all tasks in which there were movements or dialogues in the last 7 days, in the fourth just everything with the highest priority.

And, of course, such a summary does not tell all the teams what the department is busy with. But after watching the dynamics for a couple of weeks, there will be conclusions about where the bottlenecks are in the process and ideas on how to improve monitoring.
2. How to understand who is busy
In a normal situation, it would be possible to derive all open tasks for people.
Now you can make a separate column for each person, display all his open tasks there and set the sort by the date of the last message. Upstairs will be those cards in which there is an active discussion. If you, for example, have a photo studio and have messages or files in all tasks, then this approach will work well.

3. How to understand what the team decided not to do
In the first column we display all open tasks for the project and raise the oldest ones to the top. In the second we display the archived, but not marked as completed.
These are the simplest examples that are applicable even in small teams. When it comes to a company of at least 100 people, there are much more interesting sections for different departments, but the picture still can be created quite clear. And most importantly - all this without additional efforts to collect data. The team can work as it is accustomed to it, and at the same time it is possible to create an understanding of what is happening, not being directly in the processes.
In order to create an objective picture of what was happening in the company, where to spend resources, to assess the risks that the company faces ahead, it is necessary to generate many different reports from several sides. Carefully analyze, draw conclusions and if the information is not enough - to form new reports and monitor them. It always takes time. For example, you can watch a week for a column with tasks from all projects by priorities. But after that a magical feeling is formed that you understand what is happening with the company without direct participation in the process.
In large teams it is more difficult, in smaller ones, but one way or another, the reporting system can really be a decision-making tool.
PS At 8.00 a small fragment of the discussion of reports at the plant for the production of construction cranes.
I am particularly concerned about these issues. I've been working on YouGile control system for the last two years.
The key problem of reporting is that the information in any one data slice will always be incomplete, no matter how hard the company tries to note and fix everything. The simplest example is to look at the list of completed tasks for people, and this is true, at best, only by 80%. Not all tasks are fixed, not all are marked as completed, some metrics are systemically distorted.
')
At the same time, the requirement for reports from incomplete information is very high - reports must form an objective understanding of what is happening.
What we finally did after studying this question is below in a short video. And under the cut description of the process, how to come to this.
Reality
The reality in companies is somewhat worse than just 20% of incompleteness in each specific report. Usually the situation is such that in general “at least somewhere” only half of the tasks are fixed, and at the same time in different places: in messengers, in the mail, in oral conversations ...
With the emergence of a centralized management system and the formation of at least some culture of setting tasks, the situation improves slightly, but the information system cannot and should not become a control and accounting system. The more rigid rules there are regarding what should be recorded in the system, the more accurate the reports will be. But the system will voluntarily use less. The circle of the struggle for transparency closes.
What about a company that develops a management system? How to create an objective picture of what is happening without the condition that all information will be recorded?
Our history of reporting
2 years ago - we start to do a project management system with an emphasis on communication. We implement the approach when each task is a chat and we try to tighten the teams in the project activity through communication. Reports are ignored. We believe that such a tool does not affect the use of the system, but rather only repels the real team from a free planning tool.
1.5 years ago - regularly receive a certain number of requests for reports. The most common request for a list of tasks for people. We are starting to learn how reports are used by our customers who come from other systems. We understand that reports are there. In the most popular systems, you can get on several different reports: by people, by time, by completeness, by projects. BUT, talking to users, it turns out that no one really uses it. Exceptions are only cases of initially strictly regulated processes, such as HelpDesk or BugTracker.
1 year ago - we are releasing such a function as a configurator that allows you to write your own scripts within the system. Including upload any data. From time to time, large customers set up uploads directly under their requests. And a slightly strange situation occurs - sometimes companies manage to extract real benefits from this - they tell us that they are uploading a lot of data, analyzing them and making any decisions. And sometimes it becomes a ballast that no one uses.
8 months ago - we go about the requests from customers and make several reports like in most other systems: a tape of all events and a special board with tasks for employees. The function is rarely used, but those who use are satisfied and want more of this information. They explain that they would like to see more details on these or other processes.
5 months ago - all large customers are starting to immediately deliver the system with all sorts of reports on scripts that were developed earlier. There are many, they are very different, but not very convenient, since there are no normal interfaces. But at the same time customers are quite satisfied with this approach. We notice a very simple truth: when there are many reports, for some reason they start to work. Companies report that they are able to extract information on the basis of which certain decisions can be made. There are requests for reports on project viewing by employees and the distribution of team attention.
3 weeks ago - once again we speak with clients and come to a simple conclusion: the number of reports from different sides is justified by the fact that some kind of understanding can be created only if the picture is viewed from many different sides. However, these parties in different situations may be very different.
We release the report designer. We try to do so that you can get anything, but at the same time maintain the simplicity of the interface.
What system of reports and reports we built in YouGile
Let's start with the simple. Everything that is to system, it is possible to filter, sort and display in the form of the table. Download in Excel format or set up regular mail delivery. All information, of course, changes dynamically with changes in projects.
The report generation interface looks like this:
The report can be formed by 15 parameters and set up rules for multisorting. There are a couple of unusual parameters: the date of the last move and the date of the last message. For example, you can select and view the tasks for which the most active communication was. If we consider that each task is a separate chat and we communicate a lot, then the download is very interesting.
As a result, the report looks like a table with the possibility of multi-sorting.
And here, to be honest, while there is nothing supernatural - just a good flexible system for receiving reports on tasks, with accessible interfaces. Yes, there are a couple of interesting parameters and a system for sending reports on a schedule. But a truly powerful tool for creating transparency in a company is “bulletins”.
Reports
Reports are all the same as reports, but tasks are not displayed as a table with many parameters, but as a column on the board. That is, along with the usual columns, on the board you can create a special column where tasks are displayed according to specified filtering principles from other projects and boards for arbitrary periods of time. The tasks in the bulletins are read-only, they cannot be changed, but you can participate in chatting.
Here is the simplest example of several such columns:
This tool, along with the reporting system, has many applications for creating an understanding of what is happening in the company. You can make separate boards for observation, you can add to the work board a list of current tasks from the neighboring department, you can display all the important tasks for yourself, one column for each project and so on.
Some examples from practice
1. We want to know what the team does
In a normal situation, we would have to upload a report on completed tasks and maybe on new assigned tasks.
Now we can make a summary: in the first column display the completed tasks for the last 7 days, in the second all new tasks in the last 7 days, in the third column all tasks in which there were movements or dialogues in the last 7 days, in the fourth just everything with the highest priority.
And, of course, such a summary does not tell all the teams what the department is busy with. But after watching the dynamics for a couple of weeks, there will be conclusions about where the bottlenecks are in the process and ideas on how to improve monitoring.
2. How to understand who is busy
In a normal situation, it would be possible to derive all open tasks for people.
Now you can make a separate column for each person, display all his open tasks there and set the sort by the date of the last message. Upstairs will be those cards in which there is an active discussion. If you, for example, have a photo studio and have messages or files in all tasks, then this approach will work well.
3. How to understand what the team decided not to do
In the first column we display all open tasks for the project and raise the oldest ones to the top. In the second we display the archived, but not marked as completed.
These are the simplest examples that are applicable even in small teams. When it comes to a company of at least 100 people, there are much more interesting sections for different departments, but the picture still can be created quite clear. And most importantly - all this without additional efforts to collect data. The team can work as it is accustomed to it, and at the same time it is possible to create an understanding of what is happening, not being directly in the processes.
Practical conclusion
In order to create an objective picture of what was happening in the company, where to spend resources, to assess the risks that the company faces ahead, it is necessary to generate many different reports from several sides. Carefully analyze, draw conclusions and if the information is not enough - to form new reports and monitor them. It always takes time. For example, you can watch a week for a column with tasks from all projects by priorities. But after that a magical feeling is formed that you understand what is happening with the company without direct participation in the process.
In large teams it is more difficult, in smaller ones, but one way or another, the reporting system can really be a decision-making tool.
PS At 8.00 a small fragment of the discussion of reports at the plant for the production of construction cranes.
Source: https://habr.com/ru/post/451256/
All Articles