Random permutations and random partitions
For many years I have been reading courses in combinatorics and graphs for students of mathematics and computer scientists (how is it in Russian, computer scientists?), Earlier at the Academic University, and now at St. Petersburg State University . Our program is structured in such a way that these topics pass as part of “theoretical computer science” (other topics in it are algorithms, complexity, languages, and grammar). I can not say how justified it is metaphysically or historically: nevertheless, combinatorial objects (graphs, set systems, permutations, checkered figures, etc.) began to be studied long before the advent of computers, and now the latter is an important, but by no means the only reason for by him. But so look at the most specialists in combinatorics and theoretical computer science - it is surprisingly often the same people: Lovas, Alon, Smeredi, Razbor and more. Probably for good reason. In my lessons, very often non-trivial solutions to complex problems are offered by champions of olympiad programming (I won’t list them, who are curious about the top codeforces.) In general, I think that some things from combinatorics can be interesting to the community. Say if something is wrong or not.
Suppose you need to construct a random permutation of numbers from 1 to $ inline $ n $ inline $ so that all permutations are equally likely. This can be done in many ways: for example, you should first randomly select the first element, then from the remaining second, and so on. And you can do otherwise: randomly choose points $ inline $ t_1, t_2, \ ldots, t_n $ inline $ in the segment $ inline $ [0,1] $ inline $ and see how they are ordered. Replacing the smallest of the numbers by 1, the second by 2, and so on, we get a random permutation. Easy to see that all $ inline $ n! $ inline $ permutations are equally likely. Possible and not in the segment $ inline $ 0.1 $ inline $ choose points, for example, among the numbers from 1 to $ inline $ n $ inline $ . There are possible coincidences (for the segment are also possible, but with a zero probability, so they don’t care about us) - they can be fought differently, for example, reordering the matching numbers additionally. Or take N more so that the probability of coincidence is small (a case where $ inline $ N = 365 $ inline $ , but $ inline $ n $ inline $ there is a number of students in your class, and talking about the coincidence of two birthdays.) Variation of this method: note randomly $ inline $ n $ inline $ points in the unit square and see how their ordinates are ordered relative to the abscissas. Another variation: tick off $ inline $ n-1 $ inline $ point and see how ordered the lengths of the segments into which it broke. The key point in these approaches is the independence of the tests, the results of which are used to construct a random permutation. Andrei Nikolaevich Kolmogorov said that the theory of probability is a theory of measure plus independence — and this will be confirmed by anyone who has dealt with probability.
I will show how this helps, using the example of the hook formula for trees :
')
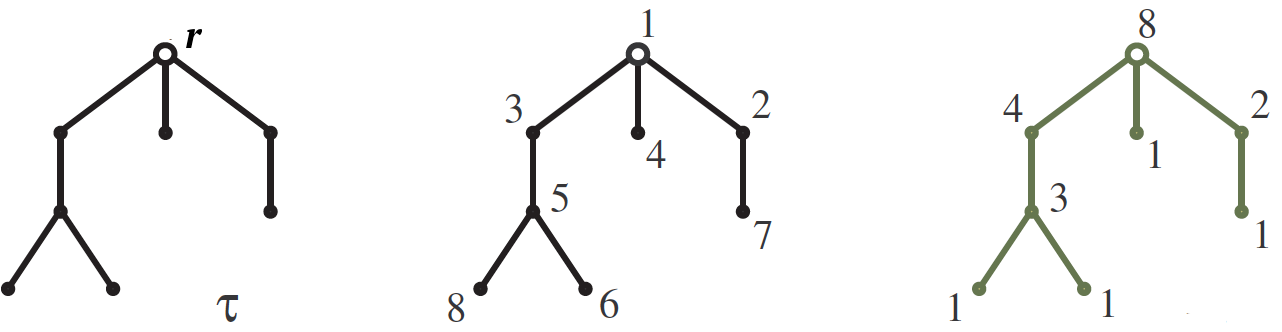
Let be $ inline $ \ tau $ inline $ - suspended by root $ inline $ r $ inline $ tree with $ inline $ n $ inline $ tops growing down as in the picture. Our goal is to calculate the number $ inline $ S (\ tau) $ inline $ tree numbering $ inline $ \ tau $ inline $ numbers from 1 to $ inline $ n $ inline $ such that for each edge the number at its upper vertex is greater than at the bottom. One such numbering is shown in the middle picture. The answer is formulated using hook sizes . Hook $ inline $ H (v) $ inline $ tops $ inline $ v $ inline $ we call a subtree growing from this vertex, and its size is simply the number of vertices in it. The hook lengths are written on the right picture next to the corresponding vertices. So, the number of numbering is $ inline $ n! $ inline $ divide by hook sizes, so for our example
We can prove that formula in different ways, for example, by induction on the number of vertices, but our view of random permutations allows us to carry out the proof without any calculations at all. It is better not only by elegance, but also by the fact that it is well summarized into more subtle numbering questions with prescribed inequalities, but not about that now. So, take n different real numbers and arrange them randomly at the vertices of the tree, each with one number, all $ inline $ n! $ inline $ permutations are equally likely. What is the probability that for each edge the number at the top of the edge is greater than the number at its bottom? Answer: $ inline $ S (\ tau) / n! $ inline $ , and it does not depend on a set of numbers. And since it does not depend, let's consider the numbers also chosen randomly - for definiteness, in the segment $ inline $ [0,1] $ inline $ . Instead of first randomly choosing numbers and then randomly placing them at the tree's vertices, we can simply randomly and independently choose a number at each vertex: their permutation will turn out to be random automatically. In this way, $ inline $ S (\ tau) / n! $ inline $ this is the probability that for random independent numbers $ inline $ \ xi (v) $ inline $ selected one for each vertex $ inline $ v $ inline $ wood $ inline $ \ tau $ inline $ , all inequalities of the form are satisfied $ inline $ \ xi (v)> \ xi (u) $ inline $ for all ribs $ inline $ v \ to u $ inline $ , $ inline $ v $ inline $ - the top vertex of the edge, and $ inline $ u $ inline $ - bottom. We formulate these conditions in an equivalent form, but a little differently: for each vertex $ inline $ v $ inline $ such an event should occur - I will designate it
$ inline $ Q (v) $ inline $ : number $ inline $ \ xi (v) $ inline $ - the maximum among all numbers in the tops of the subtree-hook $ inline $ H (v) $ inline $ .
notice, that $ inline $ \ frac {1} {| H (v) |} $ inline $ this is the probability of an event $ inline $ Q (v) $ inline $ . In fact, in the hook $ inline $ H (v) $ inline $ there is $ inline $ | H (v) | $ inline $ vertices and the maximum number of hooks are compared with each of them with equal probability $ inline $ \ frac {1} {| H (v) |} $ inline $ . So the hook formula $ inline $ S (\ tau) / n! = \ prod_v \ frac {1} {| H (v) |} $ inline $ can be stated as follows: the probability that all events occur at once $ inline $ Q (v) $ inline $ , is equal to the product of the probabilities of these events. There may be many different reasons for this, but the first one that comes to mind here is that these events are independent. To understand this, see, for example, the event $ inline $ Q (r) $ inline $ (corresponding to the root). It consists in the fact that the number at the root is more than all the other numbers at the vertices, and other events relate to comparisons between themselves of numbers written not at the root. I.e $ inline $ Q (r) $ inline $ concerns the number $ inline $ \ xi (r) $ inline $ and sets of numbers in the remaining vertices, and all other events are of the order of the numbers in the vertices other than the root. As we have already discussed, the “order” and “set” are independent, therefore the event $ inline $ Q (r) $ inline $ does not depend on others. Going down the tree further, we obtain that all these events are independent, from which the required follows.
Usually, a hook formula is a formula for numbering not the vertices in the tree, but the cells in the Young diagram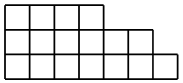 , increasing in the directions of the coordinate axes, and the hooks there are more like hooks than for trees. But this formula is proved more difficult and deserves a separate post.
Since I had to, by the way, I can not tell you about the model of the random Jung diagram . Jung's diagram is such a figure from $ inline $ n $ inline $ unit squares, the lengths of its rows increase from bottom to top, and the length of the columns from left to right. Number of young diagrams area $ inline $ n $ inline $ denoted by $ inline $ p (n) $ inline $ , this important function behaves interesting and unusual: for example, it grows faster than any polynomial, but slower than any exponent. Therefore, in particular, to generate a random Jung diagram (if we want all the area diagrams $ inline $ n $ inline $ had an equal probability $ inline $ 1 / p (n) $ inline $ ) is not trivial. For example, if you add cells one by one, choosing a place to add one randomly, different charts will have different probabilities (for example, the probability of a single-line chart is equal to $ inline $ 1/2 ^ {n-1} $ inline $ .) It turns out an interesting measure in the diagrams, but not uniform. Uniform can be obtained as follows. Take a number $ inline $ t \ in (0,1) $ inline $ , the numbers in the area are best suited for our purposes. $ inline $ 1- \ mathrm {const} / \ sqrt {n} $ inline $ . For each $ inline $ k = 1,2, \ ldots $ inline $
consider the geometric distribution on nonnegative integer numbers with mean $ inline $ t ^ k $ inline $ (i.e. the probability of the number $ inline $ m = 0,1, \ ldots $ inline $ equals $ inline $ t ^ {km} (1-t ^ k) $ inline $ ). We choose a random variable according to it. $ inline $ m_k $ inline $ (there are many ways to organize it). For large $ inline $ k $ inline $ most likely 0. Let's look at the Young diagram, in which $ inline $ m_k $ inline $ strings have length $ inline $ k $ inline $ at every $ inline $ k = 1,2, \ ldots $ inline $ . I call this the ship method , because the total area is sometimes $ inline $ n $ inline $ . If not equal, then repeat the experiment. Actually equal to $ inline $ n $ inline $ she is often enough if you choose wisely $ inline $ t \ in (0,1) $ inline $ . I suggest the reader to independently prove that all the charts of a given area are equally likely and estimate the number of steps.
Suppose you need to construct a random permutation of numbers from 1 to $ inline $ n $ inline $ so that all permutations are equally likely. This can be done in many ways: for example, you should first randomly select the first element, then from the remaining second, and so on. And you can do otherwise: randomly choose points $ inline $ t_1, t_2, \ ldots, t_n $ inline $ in the segment $ inline $ [0,1] $ inline $ and see how they are ordered. Replacing the smallest of the numbers by 1, the second by 2, and so on, we get a random permutation. Easy to see that all $ inline $ n! $ inline $ permutations are equally likely. Possible and not in the segment $ inline $ 0.1 $ inline $ choose points, for example, among the numbers from 1 to $ inline $ n $ inline $ . There are possible coincidences (for the segment are also possible, but with a zero probability, so they don’t care about us) - they can be fought differently, for example, reordering the matching numbers additionally. Or take N more so that the probability of coincidence is small (a case where $ inline $ N = 365 $ inline $ , but $ inline $ n $ inline $ there is a number of students in your class, and talking about the coincidence of two birthdays.) Variation of this method: note randomly $ inline $ n $ inline $ points in the unit square and see how their ordinates are ordered relative to the abscissas. Another variation: tick off $ inline $ n-1 $ inline $ point and see how ordered the lengths of the segments into which it broke. The key point in these approaches is the independence of the tests, the results of which are used to construct a random permutation. Andrei Nikolaevich Kolmogorov said that the theory of probability is a theory of measure plus independence — and this will be confirmed by anyone who has dealt with probability.
I will show how this helps, using the example of the hook formula for trees :
')
Let be $ inline $ \ tau $ inline $ - suspended by root $ inline $ r $ inline $ tree with $ inline $ n $ inline $ tops growing down as in the picture. Our goal is to calculate the number $ inline $ S (\ tau) $ inline $ tree numbering $ inline $ \ tau $ inline $ numbers from 1 to $ inline $ n $ inline $ such that for each edge the number at its upper vertex is greater than at the bottom. One such numbering is shown in the middle picture. The answer is formulated using hook sizes . Hook $ inline $ H (v) $ inline $ tops $ inline $ v $ inline $ we call a subtree growing from this vertex, and its size is simply the number of vertices in it. The hook lengths are written on the right picture next to the corresponding vertices. So, the number of numbering is $ inline $ n! $ inline $ divide by hook sizes, so for our example
$$ display $$ S (\ tau) = \, \ frac {8!} {8 \ cdot 4 \ cdot 3 \ cdot 2 \ cdot 1 \ cdot 1 \ cdot 1 \ cdot 1} = 210. $$ display $ $
We can prove that formula in different ways, for example, by induction on the number of vertices, but our view of random permutations allows us to carry out the proof without any calculations at all. It is better not only by elegance, but also by the fact that it is well summarized into more subtle numbering questions with prescribed inequalities, but not about that now. So, take n different real numbers and arrange them randomly at the vertices of the tree, each with one number, all $ inline $ n! $ inline $ permutations are equally likely. What is the probability that for each edge the number at the top of the edge is greater than the number at its bottom? Answer: $ inline $ S (\ tau) / n! $ inline $ , and it does not depend on a set of numbers. And since it does not depend, let's consider the numbers also chosen randomly - for definiteness, in the segment $ inline $ [0,1] $ inline $ . Instead of first randomly choosing numbers and then randomly placing them at the tree's vertices, we can simply randomly and independently choose a number at each vertex: their permutation will turn out to be random automatically. In this way, $ inline $ S (\ tau) / n! $ inline $ this is the probability that for random independent numbers $ inline $ \ xi (v) $ inline $ selected one for each vertex $ inline $ v $ inline $ wood $ inline $ \ tau $ inline $ , all inequalities of the form are satisfied $ inline $ \ xi (v)> \ xi (u) $ inline $ for all ribs $ inline $ v \ to u $ inline $ , $ inline $ v $ inline $ - the top vertex of the edge, and $ inline $ u $ inline $ - bottom. We formulate these conditions in an equivalent form, but a little differently: for each vertex $ inline $ v $ inline $ such an event should occur - I will designate it
$ inline $ Q (v) $ inline $ : number $ inline $ \ xi (v) $ inline $ - the maximum among all numbers in the tops of the subtree-hook $ inline $ H (v) $ inline $ .
notice, that $ inline $ \ frac {1} {| H (v) |} $ inline $ this is the probability of an event $ inline $ Q (v) $ inline $ . In fact, in the hook $ inline $ H (v) $ inline $ there is $ inline $ | H (v) | $ inline $ vertices and the maximum number of hooks are compared with each of them with equal probability $ inline $ \ frac {1} {| H (v) |} $ inline $ . So the hook formula $ inline $ S (\ tau) / n! = \ prod_v \ frac {1} {| H (v) |} $ inline $ can be stated as follows: the probability that all events occur at once $ inline $ Q (v) $ inline $ , is equal to the product of the probabilities of these events. There may be many different reasons for this, but the first one that comes to mind here is that these events are independent. To understand this, see, for example, the event $ inline $ Q (r) $ inline $ (corresponding to the root). It consists in the fact that the number at the root is more than all the other numbers at the vertices, and other events relate to comparisons between themselves of numbers written not at the root. I.e $ inline $ Q (r) $ inline $ concerns the number $ inline $ \ xi (r) $ inline $ and sets of numbers in the remaining vertices, and all other events are of the order of the numbers in the vertices other than the root. As we have already discussed, the “order” and “set” are independent, therefore the event $ inline $ Q (r) $ inline $ does not depend on others. Going down the tree further, we obtain that all these events are independent, from which the required follows.
Usually, a hook formula is a formula for numbering not the vertices in the tree, but the cells in the Young diagram
, increasing in the directions of the coordinate axes, and the hooks there are more like hooks than for trees. But this formula is proved more difficult and deserves a separate post.Since I had to, by the way, I can not tell you about the model of the random Jung diagram . Jung's diagram is such a figure from $ inline $ n $ inline $ unit squares, the lengths of its rows increase from bottom to top, and the length of the columns from left to right. Number of young diagrams area $ inline $ n $ inline $ denoted by $ inline $ p (n) $ inline $ , this important function behaves interesting and unusual: for example, it grows faster than any polynomial, but slower than any exponent. Therefore, in particular, to generate a random Jung diagram (if we want all the area diagrams $ inline $ n $ inline $ had an equal probability $ inline $ 1 / p (n) $ inline $ ) is not trivial. For example, if you add cells one by one, choosing a place to add one randomly, different charts will have different probabilities (for example, the probability of a single-line chart is equal to $ inline $ 1/2 ^ {n-1} $ inline $ .) It turns out an interesting measure in the diagrams, but not uniform. Uniform can be obtained as follows. Take a number $ inline $ t \ in (0,1) $ inline $ , the numbers in the area are best suited for our purposes. $ inline $ 1- \ mathrm {const} / \ sqrt {n} $ inline $ . For each $ inline $ k = 1,2, \ ldots $ inline $
consider the geometric distribution on nonnegative integer numbers with mean $ inline $ t ^ k $ inline $ (i.e. the probability of the number $ inline $ m = 0,1, \ ldots $ inline $ equals $ inline $ t ^ {km} (1-t ^ k) $ inline $ ). We choose a random variable according to it. $ inline $ m_k $ inline $ (there are many ways to organize it). For large $ inline $ k $ inline $ most likely 0. Let's look at the Young diagram, in which $ inline $ m_k $ inline $ strings have length $ inline $ k $ inline $ at every $ inline $ k = 1,2, \ ldots $ inline $ . I call this the ship method , because the total area is sometimes $ inline $ n $ inline $ . If not equal, then repeat the experiment. Actually equal to $ inline $ n $ inline $ she is often enough if you choose wisely $ inline $ t \ in (0,1) $ inline $ . I suggest the reader to independently prove that all the charts of a given area are equally likely and estimate the number of steps.
Source: https://habr.com/ru/post/451012/
All Articles