The performance of animations on sites
When developing sites that go beyond the conventional bootstrap, sooner or later there are issues related to the performance of animations. Especially important they are in design sites, such as those that go to the catalogs Awwwards, FWA, CSS Design Awards, etc. In this case, often the task of creating animations and subsequent optimization, if it is needed, falls on the shoulders of not very experienced developers who do not even know where to start. Usually, all this results in slowing down sites that cannot be used, and the subsequent negative attitude towards the entire class of such projects. In this article, we will try to make out where the border of acceptable animation performance is, which bottlenecks are often found and where to look in the developer’s tools first.
A small note: since this article is intended more for novice developers and its goal is to show general approaches to optimizing animations, many things will be given in a simplified, not quite academic form.
How the browser displays the page
First of all, it is useful to understand what happens when the browser displays the current state of the page to us. There are four basic steps:
- Style calculation (browser parses CSS selectors, determines which styles to apply to).
- Layout creation (the page layout is actually formed)
- Painting (creates pixel representations of elements for later rendering)
- Layer composition (the browser puts everything together and displays it on the screen)
In this case, the browser always acts in this sequence and goes to the end. At initial display of the page after its loading there pass all four steps. In the future, our actions can cause the execution of one of them, but at the same time all the subsequent ones will be executed. But not the previous ones.
We will consider the bottlenecks of each of these steps further, and now let us ask ourselves one stupid at first glance question that we should start with ...
Brakes or does not brake, that is the question ...
Very often, you can meet people who do not do anything with a clearly inhibiting site and say “and my page speed gives 100 points, all is well”. Or vice versa, on a well-functioning website, people have been doing some kind of optimization for a long time, because some algorithm works inefficiently for some mysterious metrics. But between these extremes should be the middle of common sense, so where is it?

To learn zen to understand whether you need to optimize your animations, you need to realize a deep philosophical thought:
If you see that the site slows down, then it slows down. If you do not see that the site slows down, it means it does not slow down.
Many people for some reason consider this statement very stupid, but is it so? For the end user, performance is not some metrics or ideal algorithms with a rigorous mathematical justification. For him, performance is one of two things: slows down or does not slow down.
How does he define it? The eye of a person who spends a lot of time behind the monitor begins to react sharply to a drop in fps. This causes a strange feeling of discomfort. Accordingly, our task as developers is to prevent subsidence. Is the user accustomed to seeing the browser work at 60fps? Well, then we do everything so that all remains so. Take a laptop with an average iron and look. We see much less than 60fps - we optimize. We see about 60 - do not touch anything. The user will still not notice the difference, and we will spend a lot of time optimizing for the sake of optimizations.
Don't do optimizations for the sake of optimizations.
16.5ms
It is not convenient to express in terms of fps, so let's move on to milliseconds. With a simple 1000ms / 60fps division, we get about 16.5ms of time per frame.
What does this mean? For 16.5ms, the browser should show us the current state of the page with the animation, going through the steps that we saw above, and at the same time there should be resources for the work of other scripts, communication with the server, etc. If the display of the current state of the page will spend more time - we will see through the eyes of the lag. If it is about 16ms, there will be no sagging, but it is likely that the iron load will be very high, the coolers will buzz and the phones will warm up. Thus, we need to ensure that the rendering of one frame does not approach this value in time, and even better was not more than 10ms, so that the performance margin remains. Do not forget also that the tests are always carried out on the middle gland - for example, in the following examples, screenshots will be taken on a Pentium Silver with integrated graphics.
Perform tests on the hardware that your users are more likely to have. If you have a workbench processor and a mining farm under the table, then everything will work well for you, while your users with budget laptops can be very sad.
In order not to rely only on your keen eye and intuition, it is useful to master the developer tools, at least at a basic level. They will not only give accurate performance data, but also tell you where to look for the problem if everything is not working very well.
Google Chrome Developer Tools
Many web designers are afraid of developer tools in the browser almost more than the linux console. But in reality there is nothing to fear. Yes, there are a lot of buttons, but they are redundant to solve our problems. Now we will see where to pay attention in the first place, to understand what to do with the animation, and whether we need to do anything at all.
When it comes to performance, we will spend most of the time in the performance tab and will press the same button.

The keyboard shortcut Ctrl-E or the round button on the left starts and stops recording what is happening. Results are displayed here. The browser writes a lot of things, but it's better to see it once than to read it many times, so take some animation and look at it. Let it be a simple CSS animation first. If you open it to full screen, then you will see that it works with noticeable jams:
We will record a few seconds in full screen mode and see what happens there:
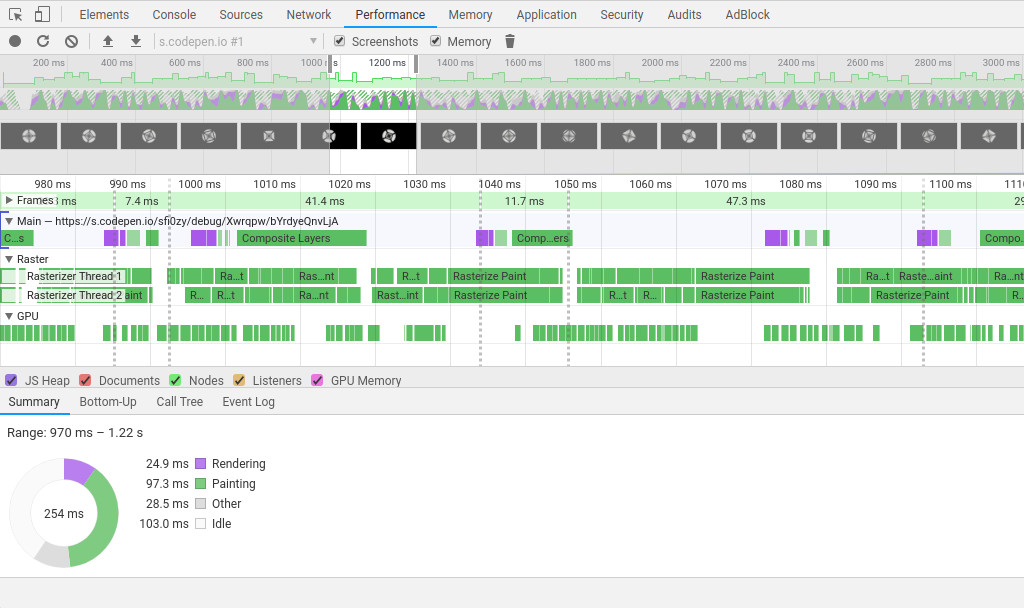
The browser records everything that it does. At the top of the window we see the fps graph. On it you can easily detect the anomaly, if in the process of working with the page it begins to drastically slow down. If you click on the graph with the mouse and pull it to the side or twist the wheel, you can select this time range and detailed information for it will be displayed below. In our simple example, there are no anomalies, but it is clearly seen that everything does not work very evenly.
Immediately pay attention to the line Frames , it contains information about the time spent on each frame. You can see that this time constantly jumps and noticeably exceeds 16ms (below, in practical examples, we will slightly improve this animation).
Next we see a few lines in which the load is displayed in different colors - you can see how much time the browser has spent on different activities. We have a uniform animation and for each frame the same operations are performed, indicated by purple and green. If you hover the mouse over the colored blocks, it will become clear that we are dealing with those points that were mentioned at the beginning — recalculate style and update layer tree — purple, and paint and composite layers — green.
Consider another animation. This time with scripts - a simple noise generator. This is a pretty illustrative example, although it is of no interest from the point of view of design:
You may notice that yellow blocks have been added to display the execution of scripts. If there are a lot of function calls, then one more block will be added for each call - it is easy to find the heaviest function with their size, with which it is probably worth starting optimization.
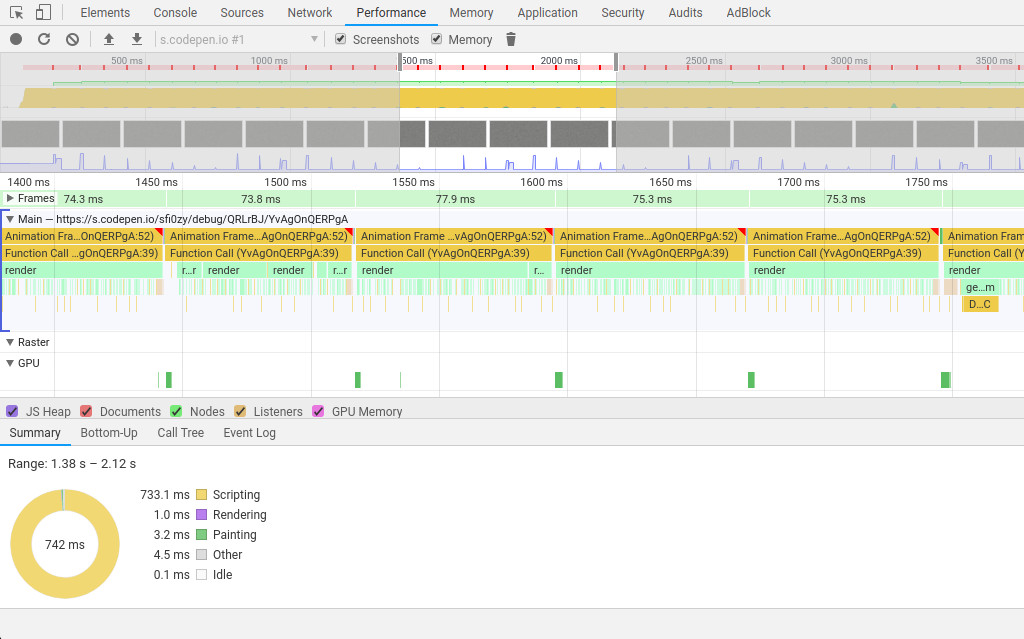
In the example, the time taken for one frame varies around 80ms. But what’s really there, even with the naked eye, you can clearly see how everything is jerking. Looking at the summary section below, we see that the most time is occupied by scripts. Compared to them, rendering and painting look like errors that can be neglected. Not always, of course, it happens, but quite often.
If you click on the block marked as function call , then below there will be a link to the function in the script code. If you go through it, you can see that in this example, there is a cycle for all pixels on the screen. Such a task would be more logical to do on shaders, then the performance would be much better. But we will look at it in practical examples.
What to do, if...
We learned what steps there are when displaying the current state of the page in the browser, and where to see which one takes the most time. It is time to get acquainted with the most common reasons why a particular step begins to require too many resources and give a couple of tips on what to do in this or that case.
Style calculation
If you see that already at this step the problems begin - most likely the point is not even in animation, but in the fact that there are too many elements on the page. In design sites, this is quite rare, usually such a problem is a satellite of large tables with thousands of elements, but if you still encounter this:
Reduce the number of elements on the page, simplify the markup. Pay special attention to duplicate pieces of code with wrappers, it is likely that they can be removed.
The second reason related to the first is complex CSS selectors. If on small pages it is quite possible to use deep nesting, tricky hacks with neighboring elements, etc., then on a really large page this can all lead to poor performance.
Simplify CSS selectors, use BEM.
Layout creation
This item is closer to the design and animations, here begin interesting things. The first thing that is important to understand is that the layout is formed entirely. If we change something, it is formed again. For this reason, on a large page, even minor changes can cause noticeable delays in this step.
The main rule that we follow when creating animations is to not allow the restructuring of the layout at any cost. Therefore, we usually do not try to optimize it (and there are no special opportunities), but we try to avoid it.
There are many properties that can cause a lot of rebuilding of the layout, you can find lists on the Internet, for example, at csstriggers.com there is a good one. More often than others in animations one can come across properties:
display position / top / left / right / bottom width / height padding / margin border font-size / font-weight / line-height ... You may notice that all these properties combine one thing - they describe the geometric characteristics of the elements - the display parameters, size and physical location. So instead of remembering them all, remember what they refer to.
Do not change the geometric properties of elements, it is better to use transform and opacity.
Separately, it is worth noting that changing the background of the element will also take us back to this step. We constantly forget about it, so we will highlight it into a separate recommendation:
Do not change the background elements.
In some browsers ( I will not poke a finger in Firefox ) a characteristic lag of CSS animations with transformations may appear, especially if more than one animation is performed per unit of time. Outwardly, this may look not only as a pause in her work, but also as a “breakdown” of the animation to its very beginning. It seems that the browser is constantly relying on something. This behavior is almost always improved with the help of the backface-visibility property.
If possible, add backface-visibility: hidden elements to be animated.
Also, the restructuring of the layout is caused by our calls to the elements from the scripts. Moreover, it does not have to be a direct change in CSS, it can be an appeal to certain properties and methods of elements. The most common:
offset*** client*** inner*** scroll*** In animations, be careful with them, because if we begin to address these properties and methods for a large number of elements, each time this will cause a restructuring of the layout.
Avoid referring to the mentioned properties and methods for individual elements in cycles.
Painting and layer composition
These two steps will be considered together, because they are to some extent related and usually if there is a problem with one, they will be with the other. Skip these steps, avoid them, will not work, so we are trying to somehow optimize them.
The browser does not prepare the pixel image of the page entirely, but in parts - in layers. There may be many. Each layer exists as if in itself and does not affect the rest, which sets the stage for some CSS hacks. But we will talk about them another time. Then from these layers the final image is collected. In the context of animations, it is very useful to render the animated elements in a separate layer so that their changes do not affect everything around. It is desirable that the contents of the elements was small. We can do this using the will-change property or, as it was done before, transform: translateZ (0) . The only thing to remember is that you cannot increase the number of layers indefinitely. At some point, it will play a cruel joke and the performance on the contrary will fall. So there will be two tips:
Use will-change or transform: translateZ (0) to place animated elements on a separate layer.
But at the same time
Do not overdo it with this case. Check in the developer’s tools that it’s not getting worse.
Very often, serious problems are caused by filters that somehow transform the image of elements. These may be simple CSS filters with blur or confused variants with SVG, but the effect will be the same - noticeable performance degradation.
Do not use complex filters. If you still need the intended effect - consider the option of implementing it on WebGL.
How do these tips work?
Work, but do not need to expect a miracle from them. On the network, newbies sometimes say “I added will-change, but nothing has changed.” This usually means that the main problem was elsewhere, and this technique gave such a small performance boost that it went unnoticed. That is why it is important to use developer tools to clearly understand exactly where the bottleneck is and not to waste time and energy on trying to optimize what works fine.
From all this we can conclude that there are not so many ways to influence the rendering of the page, and the effect of them will not always be significant. These techniques are not silver bullets, they are rather needed for polishing the animation. If we look at sites with really bad performance, we note that in most cases our own scripts will be to blame, and not mysterious problems with parsing CSS somewhere in the bowels of the browser.
Scripts ...
Do you know where the problems with dragging animations grow most often (according to my observations)? From this development approach:
It sounds silly, but it is. Constantly there are solutions, clearly from somewhere copied completely without an understanding of what is what. It even happens that you can delete half of the code and everything will continue to work. Often the code in the responses to the SO or Toaster is not intended for your production. This should be obvious. It shows the idea, answers the question, but is not at all the best final option for your specific task.
If you already copy, then at least look at the code for unnecessary actions.
RequestAnimationFrame
People often talk about this method and recommend using it instead of setTimeout / setInterval in animations. This makes sense, since those methods tend to become out of sync with the frames that the browser redraws and as a result, small lags are obtained. But there are two comments.
First, if more than one element is animated on the page and we will call requestAnimationFrame many times, this will lead to a sharp subsidence of fps. In theory, this should not be so, but in practice everything happens that way. Read the tests here .
Merge all callbacks for animations into one requestAnimationFrame.
The second point is rather related to the situation when we already have a heavy animation, possibly with the use of canvas, which we cannot get rid of or have no time to redo, and the following happens: let's say the animation should run in N seconds and we already use requestAnimationFrame . But it takes a lot of resources to calculate the current state and we see the following picture: the animation works smoothly and beautifully, but in 2N or even 3N seconds. As a result, everything is perceived by the ooochchchcheeenn meeeeddlleennym. In order to at least somehow correct this behavior, you can go against all recommendations, thereby taking advantage of setInterval / setTimeout and linking the states of the elements being animated to physical time, and not to abstract frames. As a result, we get a formal decrease in fps, but with the psychological effect of productivity gains.
In the case of extremely slow animations, it may make sense to refuse requestAnimationFrame in favor of setInterval / setTimeout.
Canvas and Shaders
Much of the animations on non-standard sites are related to canvas. This is quite understandable, CSS is a limited thing, but here we can realize any designer fantasies. But it must be borne in mind that the usual 2d canvas is far from the most productive technology. If you start to draw a lot of elements on it or work with pixels directly, then you will quickly encounter the fact that fps sags, or all of a sudden, painting and layer composition start to take an indecent amount of time. This problem can be clearly seen in the example:
Let's take a look at what the browser does (the latest Google Chrome under Linux):

Pay attention to how much the layer has expanded. It looks a bit illogical, because there is only one element, what can be arranged there for so long? But when using 2d canvas, this behavior is not uncommon, and something very difficult to do with it. This is one of the reasons why we usually tend to use WebGL, there are no such questions.
If there is a choice between 2d canvass and WebGL, choose the second one. This will give an initial performance bonus on the same tasks.
What is WebGL usually associated with? With shaders. Shader debugging is a headache for anyone working with them. And developer tools are practically powerless here. Usually, if there are too many calculations in shaders, we see in the summary below that the “idle time” is most of the time, which in fact is the execution of our shaders independently of the browser, and we cannot get any useful details.
There are various recommendations on which functions to prefer to others in shaders, because they are supposedly better optimized. Or that you need to avoid blocking operations. This is all true, but according to my observations, in most cases, shaders, which too slow down the work of the site, are just very large shaders. If you wrote 100 GLSL lines in one place, this is almost guaranteed to work poorly. And if there are also different nested constructions, cycles, then all - write gone. It is difficult to give any recommendations here, except that:
If during your work you understood that everything is more complicated than it seemed initially, and that there will be a lot of code and it will slow down - it is better to discuss this with the designer and customer as early as possible and think about what can be changed.
It is often possible to conclude that a pre-prepared video will work much better than trying to render some kind of a confused piece in real time. Remember this. Yes, everyone wants to show themselves, they want to show off “and I still can do it like this,” but do not forget about the end users.
In connection with this idea, the “disease” is remembered, to which former Olympiads are especially susceptible. For some reason, it manifests itself strongly when working with canvass. For her reason, you should always carefully copy the code of such people. They try to use “correct” mathematical algorithms, complex physical formulas, calculate all the movements of elements with great accuracy, even where it is completely useless. This leads to an increase in the load on the processor and to the fact that it does not have time to calculate anything for our conditional 10ms. In practice, it is often possible to do with approximate formulas and school knowledge of physics. No need to complicate things, we make websites, not software for ballistic missiles.
Use simple algorithms.
There is another trick called RayMarching . Some people consider creating different effects with its help something like a challenge, warming up for the mind, and sometimes the results make a strong impression. For example, a whole underwater world is generated here (put in a video, because from the calculations of this in real time the phone / laptop can easily hang itself):
You can familiarize yourself with the shader here .
In practice, this all requires incredible resources for work. In full-screen mode, we have 400-800ms per frame (and in general in this example, up to 1500ms can rise):
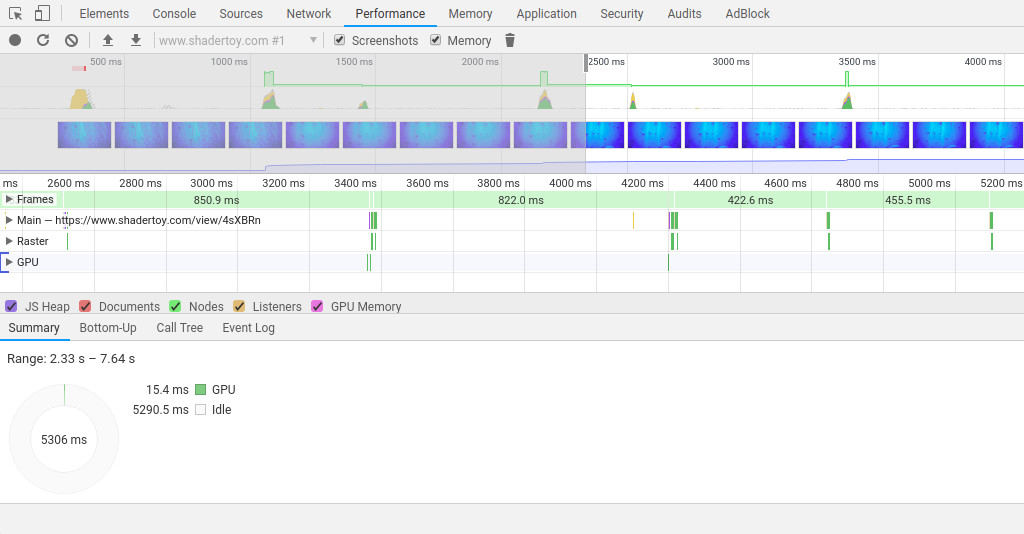
So if you catch yourself thinking to do something on the combat site - give yourself a keyboard over the head, drink tea and think about alternative effects.
Do not use RayMarching, this is a sure way to kill performance.
Practical example
In the articles about performance, there are often not enough examples, and it is difficult to believe in the word. So consider a couple. Remember the first example with a rotating tunnel on CSS? The browser did a lot of things:
We want to speed it up a bit. Where to begin? We see purple blocks, which means that the browser is constantly rebuilding the layout. There are no scripts there, but there are CSS animations in which something changes. Let's look at their code:
@keyframes rotate { from { transform: rotate(0); } to { transform: rotate(360deg); } } @keyframes move-block { from { transform: translateX(0); background: @color1; } to { transform: translateX(-@block-size * 6); background: @color2; } } Transformations do not frighten us, but we see a change in the background of the elements. We recall that this may cause a restructuring of the layout, and we think what can be done in this situation ...
Changing the background should be removed at any cost, so based on the general idea of the animation, we decide that we can put a radial gradient on top, which will create almost the same volume effect. Someone will say that gradients are bad for performance, but we are not going to change it. Let it be better once it has a bad impact, than we will have a whole mountain of constantly badly influencing elements. The result is:
Let's see what the browser does:

Wow ... Instead of a heap of actions, we see rare references to the GPU and nothing more, while the animation itself began to work noticeably smoother.
Another example
Recall how the browser looked like in a noise generator:
The problem is definitely in the scripts. It can be seen that the block "render" is the largest. This is our main function for image rendering. Let's look at it:
function render() { let imageData = CTX.createImageData(CTX.canvas.width, CTX.canvas.height); for (let i = 0; i < imageData.data.length; i += 4) { const color = getRandom(); imageData.data[i] = color; imageData.data[i + 1] = color; imageData.data[i + 2] = color; imageData.data[i + 3] = 255; } CTX.putImageData(imageData, 0, 0); requestAnimationFrame(render); } There is definitely work with individual pixels. This is not very cool. We said that, if possible, it’s better to use not 2d canvas, but WebGL, and this task just wants to be parallelized using a shader. Let's do it:
What happens in the end? See for yourself:

Time per frame decreased to almost 16ms. Of course this is not ideal, but still better than 80ms. In complex beautiful animations such a performance boost can be very noticeable. Taking this opportunity I recommend beginners to get acquainted with the introduction to programming of shaders and with continuation with examples .
Conclusion
In this article, we figured out when to optimize animation performance, how to use Chrome’s developer tools in this context, and what to look for first. I hope this information will be useful to developers who first encountered such tasks and do not know where to start.
')
Source: https://habr.com/ru/post/450484/
All Articles