Determine the load on the Apache server

How to get data on the work of the Apache web server and present them in a convenient form for analysis.?
Let's start by getting the data.
')
For this, it is necessary to connect the mod_status module. It monitors the server and shows the data in the form of a normal html page. With it you can find out:
1 number of processes performing request processing;
2 the number of processes that are pending;
3 state of each process, the number of requests processed by them and the data transferred;
4 total number of requests and data transferred;
5 server uptime (start, restart and total uptime);
6 general statistics: average number of requests per second, bytes per request, bytes per second;
7 use of CPU by each process separately and apache in general at the moment;
8 hosts and their requests that are currently being processed.
Go to setting
1 We connect the module.
To do this, in the httpd.conf file, remove the comment from the line
LoadModule status_module modules/mod_status.so
2 And open access to statistics. Add the following lines to httpd.conf
#
ExtendedStatus On

<Location /server-status>
SetHandler server-status

Order Deny,Allow
Deny from all
Allow from 127.0.0.1
Note. Here we allowed access to statistics only for the address 127.0.0.1 (localhost). To test a remote server, you will need to change this setting.
3) Restart apache.
Now you can view statistics.
To do this, enter in the browser URL
localhost/server-status
or if you want the page to be updated automatically
localhost/server-status?refresh=15
(instead of 15, set the delay in seconds).
There is another version of the page with the same data:
localhost/server-status?auto&refresh=3
As you can see, we received the data, but analyzing them, looking at the standard page is not very convenient.
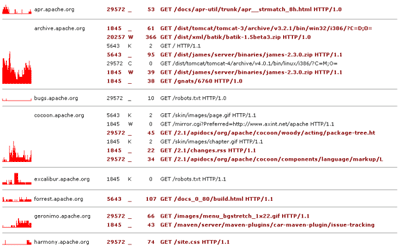
For example, the screenshot shows the status of apache processes.

The underscore symbol means that the process is waiting for a connection, the letter “W” is the response sending, the dot is an open slot without a process.
Note. The screenshot was taken for local north, so the only process that sends the request is the one that forms the statistics page.
In addition, if your data is constantly updated (the refresh parameter is used), it will be very difficult to visually assess the changes.
In this case, it is convenient to use a script that will collect data and display it, for example, as a graph.
You can write it yourself, but it's easier to use ready-made.
As an example of such a script, consider the Visualize Apache Server Status (distributed under the LGPL license).
The script consists of 3 parts.
1 Configuration file (inc.config.php). Here you need to specify the address of the page with statistics:
$statusurl = "http://localhost/server-status";
Data refresh time and scale (used for plotting).
$refreshtime = 2;
$scalefaktor = 1;
2 Two scripts (serverstatus.php and serverstatus2.php). Used to display data. You can run any of them. The information is the same, only presented in different ways.
serverstatus.php
serverstatus2.php

3) The class that performs the analysis of the page with statistics (class.parse_server_status.php). The most interesting component;). It can be used in your own scripts.
During the work you will need 2 methods of this class.
1 parse_server_status ($ url) - in the $ url parameter we set the address of the page with statistics.
2 getActiveConnections () - returns an array with information about active connections. At the moment, this array contains: process identifier, operation mode, process operation time, CPU usage, virtual host name and request URI.
Thus, it is easy to write your own script that will store data on the server.
Good luck!
Source: https://habr.com/ru/post/45028/
All Articles