Yury Bushmelev "Map of the rake in the field of collecting and delivering logs" - decoding the report
Logs - an important part of the system, allowing to understand that it works (or does not work), as expected. In the conditions of microservice architecture, work with logs becomes a separate discipline of a special Olympiad. Need to solve a bunch of questions right away:
- how to write logs from the application;
- where to write logs;
- how to deliver logs for storage and processing;
- how to process and store logs.
The use of currently popular containerization technologies adds sand over the rake to the field of solutions to the problem.
Just about this, the transcript of the report of Yury Bushmelev "Map of the rake on the field of collecting and delivering logs"
Who cares, I ask under the cat.
My name is Yury Bushmelev. I work in Lazada. Today I will talk about how we made our logs, how we collected them, and what we write there.

Where are we from? Who are we? Lazada is the # 1 online store in six countries in Southeast Asia. All of these countries we have distributed data centers. Total data centers are now 4. Why is this important? Because some decisions were due to the fact that there is a very weak link between the centers. We have microservice architecture. I was surprised to find that we already have 80 microservices. When I started the task with logs, there were only 20. Plus, there is a fairly large piece of PHP legacy, with which you also have to live and put up. All this generates us at the moment more than 6 million messages per minute on the system as a whole. Then I will show how we are trying to live with it, and why this is so.

With these 6 million messages you need to somehow live. What should we do with them? 6 million messages you need:
- send from app
- accept for delivery
- deliver for analysis and storage.
- to analyze
- somehow stored.

When there were three million posts, I had about the same look. Because we started with some cents. It is clear that application logs are written there. For example, I could not connect to the database, I could connect to the database, but I could not read something. But besides this, each of our microservice also writes an access-log. Every request that arrives at microservice falls into the log. Why do we do this? Developers want to be able to trace. In each access-log there is a traceid field, through which the special interface further spins the whole chain and beautifully shows the trace. Trace shows how the request passed, and it helps our developers to quickly deal with any unidentified garbage.

How to live with it? Now I will briefly tell the field of options - how is this problem solved at all? How to solve the problem of collecting, transmitting and storing logs.

How to write from the application? It is clear that there are different ways. In particular, there is a best practice, as fashionable comrades tell us. There are old school in two forms, as the grandfathers said. There are other ways.

With the collection of logs about the same situation. There are not many solutions to this particular part. They are already more, but not so much.

But with the delivery and subsequent analysis - the number of variations begins to explode. I will not describe each option now. I think the main options are heard by everyone who was interested in the topic.

I will show how we did it in Lazada, and how it all began.

A year ago, I came to Lazada, and they sent me to a project about logs. There was something like this. The log from the application was written to stdout and stderr. All done in a fashionable way. But then the developers have thrown it out of the standard streams, and then somehow the infrastructure specialists will sort it out. Between the infrastructure specialists and the developers, there are still releasers who said: "uh ... well, let's wrap them in a file just with the shell, that's all." And since all of this is in a container, it is wrapped right in the container itself, the catalog inside the container and put it there. I think it’s pretty obvious to everyone what came out of it.

Let's look a little further away. How we delivered these logs. Someone chose a td-agent, which is actually fluentd, but not quite fluentd. I still do not understand the relationship of these two projects, but they seem to be about the same thing. And this fluentd, written in Ruby, read log files, parsed them in JSON for some regulars. Then they sent them to Kafka. And in Kafka for each API we had 4 separate topics. Why 4? Because there is live, there is staging, and because there is stdout and stderr. The developers of them produce, and the infrastructure workers should create them in Kafka. Moreover, Kafka was controlled by another department. Therefore, it was necessary to create a ticket, so that they created there 4 topics for each api. Everyone forgot about it. In general, there was trash and waste.
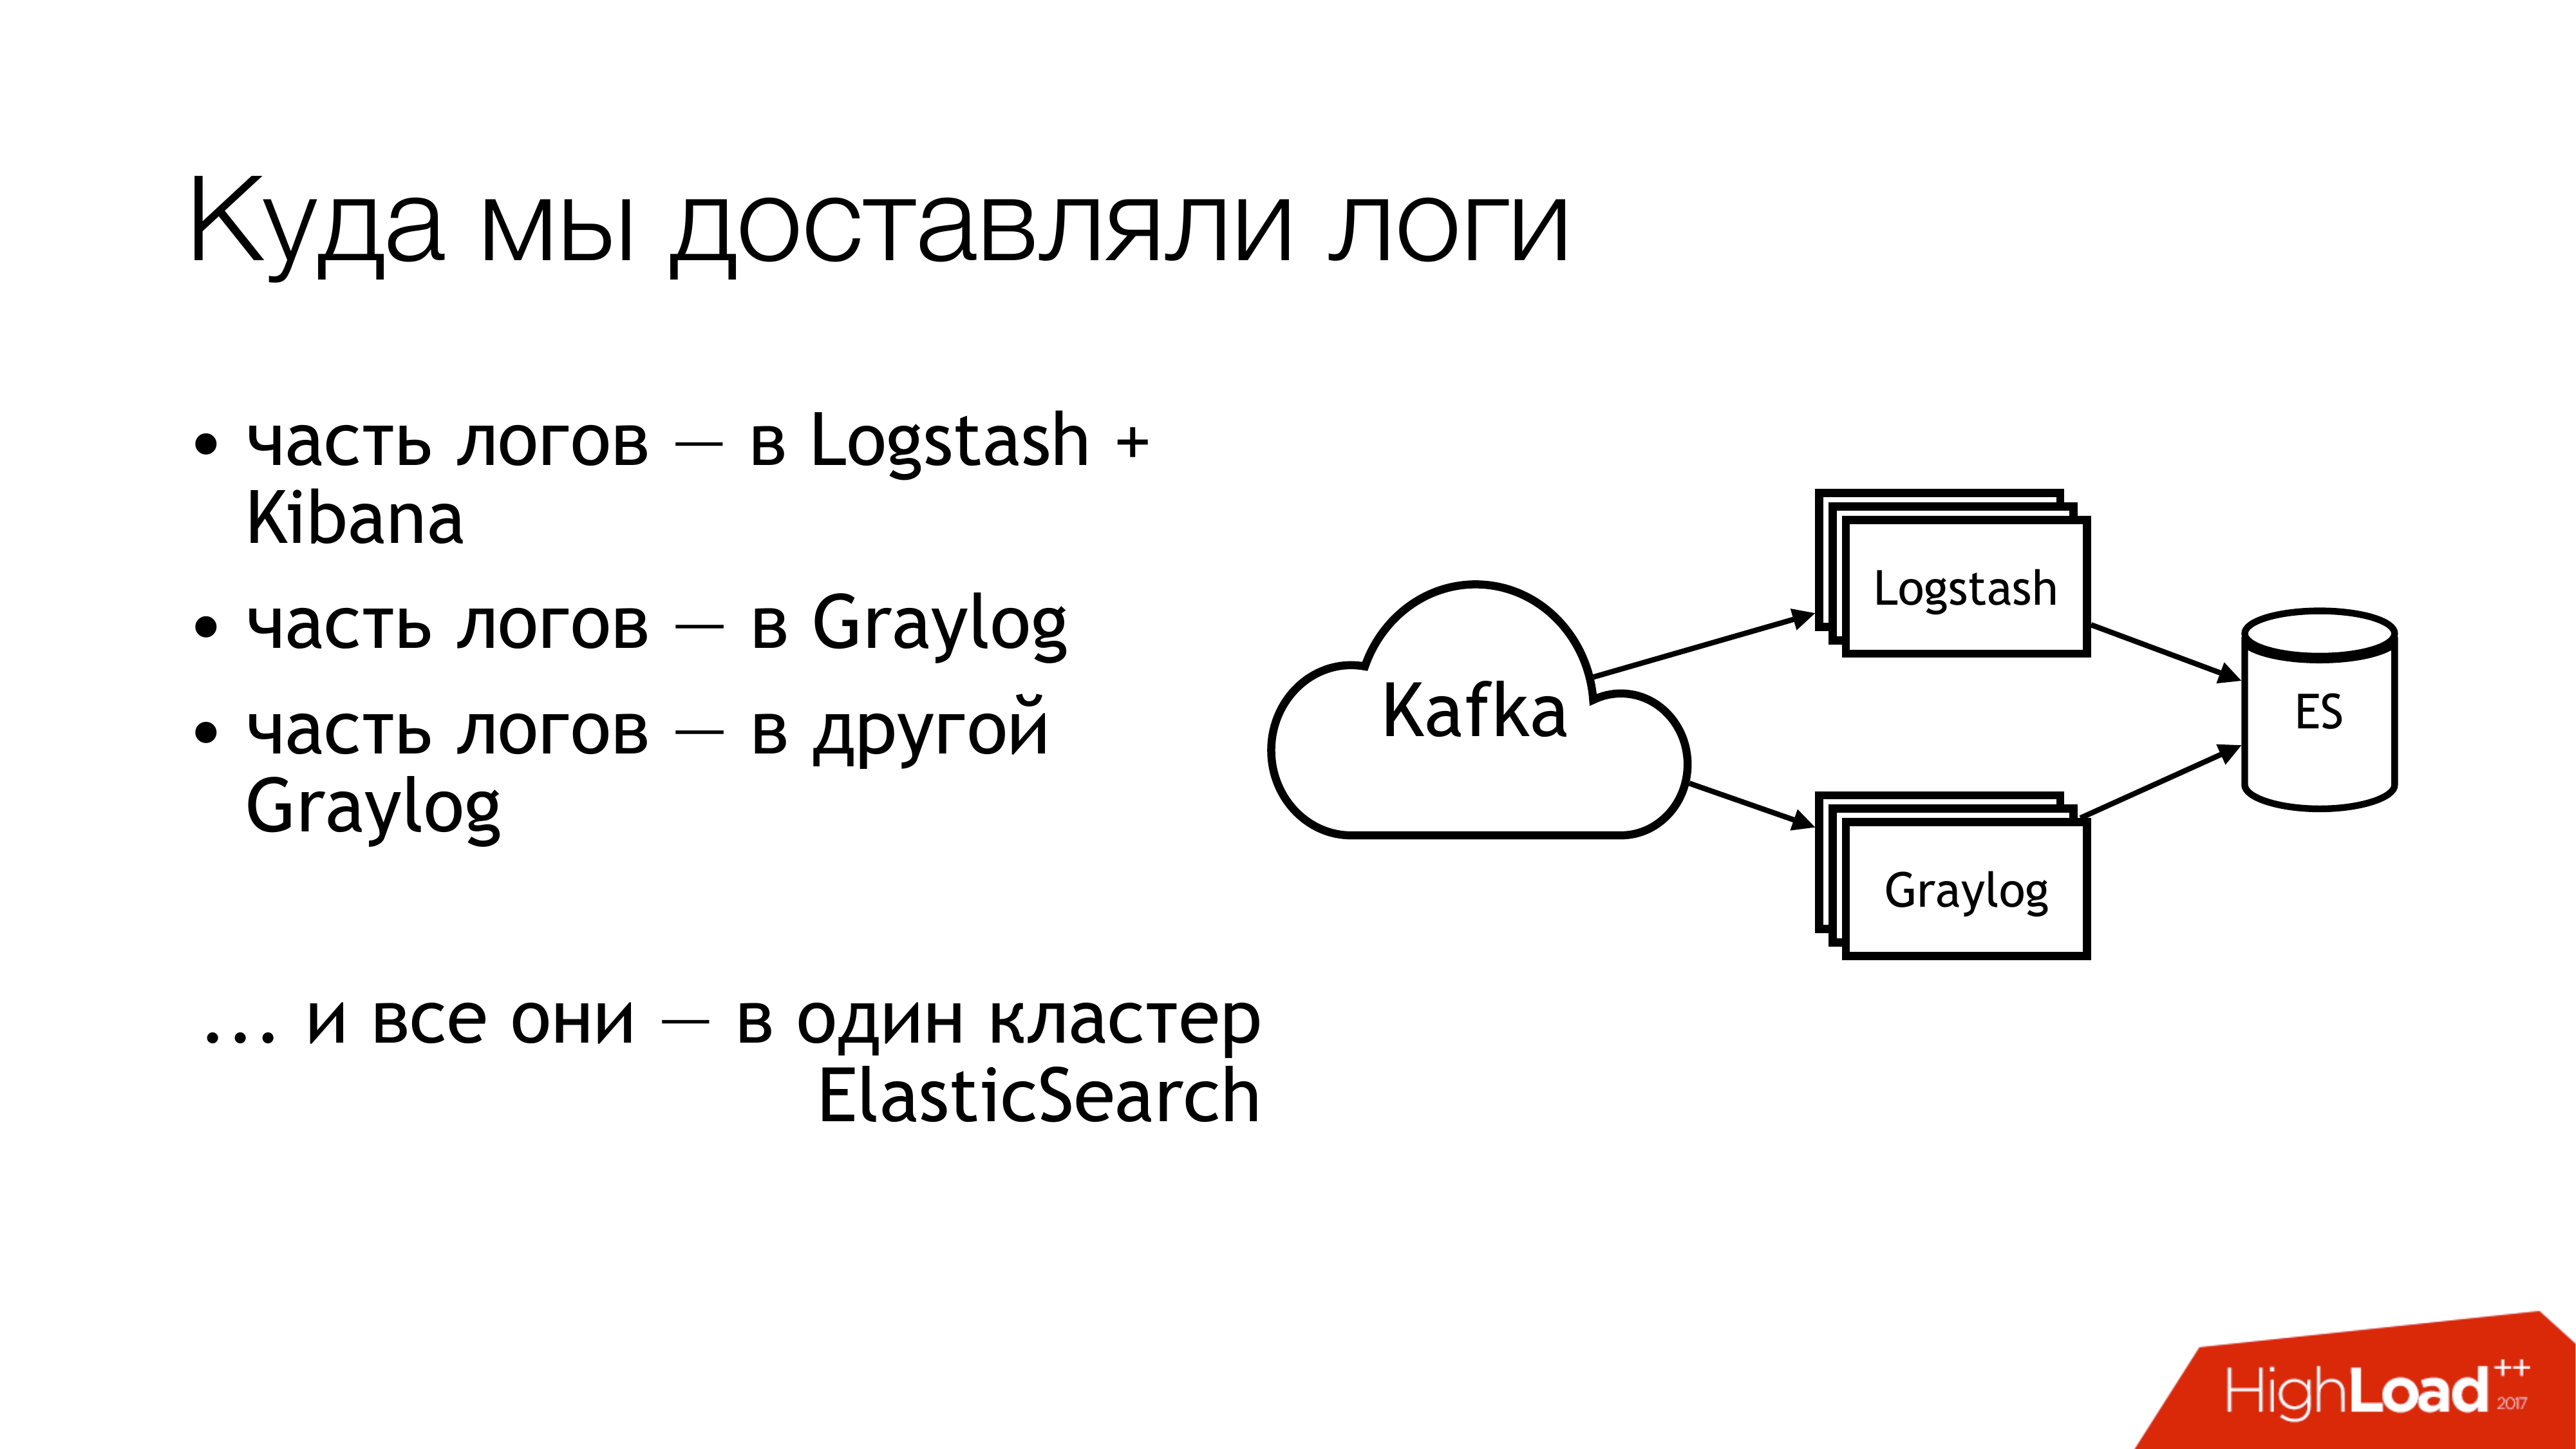
What did we do next with this? We sent it to the kafka. Further from a kafka half of logs flew away to Logstash. The other half of the logs shared. Part flew into one Graylog, part flew into another Graylog. As a result, all this flew into one cluster of Elasticsearch. That is, all this mess fell in the end there. So do not!

This is how it looks if viewed remotely from above. Don't do that! Here are the numbers immediately marked problem areas. Actually, there are more of them, but 6 - these are the very problem with which you have to do something. I will tell you about them separately now.

Here (1,2,3) we write files and, accordingly, here are three rakes at once.
The first (1) is that we need to write them somewhere. I would not always like to give the API the ability to write directly to a file. It is desirable that the API was isolated in a container, and even better - that it was read-only. I am a sysadmin, so I have a bit of an alternative look at these things.
The second point (2.3) - we have a lot of requests coming to the API. The API writes a lot of data to the file. Files grow. We need to rotate them. Because otherwise there will not be enough discs. It’s bad to rotate them because they are redirected through the shell to the directory. We can't do it in any way. The application cannot be told to rediscover its descriptors. Because the developers will look at you like a fool: "What descriptors? We generally write to stdout. ” The infrastructure designers made a copytruncate in logrotate, which makes a simple copy of the file and truncates the original. Accordingly, between these processes of copying and usually ends up disk space.
(4) We had different formats were in different APIs. They were a little different, but regexp had to be different. Since it was all driven by Puppet, there was a big bundle of classes with its cockroaches. Plus, td-agent most of the time could have a memory, be stupid, he could just pretend that it was working, and do nothing. From the outside it was impossible to understand that he was doing nothing. At best, he will fall, and someone will pick it up later. More precisely, the alert will arrive, and someone will go over the hands.

(6) And the most trash and waste - it was elasticsearch. Because it was the old version. Because, we did not have dedicated masters at that time. We had heterogeneous logs whose fields could intersect. Different logs of different applications could be written with the same field names, but there could be different data inside. That is, one log comes with an Integer in the field, for example, level. Another log comes with a String in the level field. In the absence of static mapping, this is a wonderful thing. If after rotation of the index in elasticsearch the first message arrived with the string, then we live normally. And if here the first has arrived with Integer, then all subsequent messages which arrived with String, are simply discarded. Because the field type does not match.

We started asking these questions. We decided not to look for the guilty.

But something must be done! The obvious thing is to make standards. We already had some standards. Some we got a little later. Fortunately, the uniform log format for all APIs was already approved at that time. It is written directly into the standards of interaction of services. Accordingly, those who want to receive logs should write them in this format. If someone does not write logs in this format, it means that we do not guarantee anything.
Further, I would like to have a single standard for ways to record, deliver and collect logs. Actually, where to write them, and what to deliver them. The ideal situation is when projects use the same library. There is a separate logging library for Go, there is a separate library for PHP. All who we have - everyone should use them. At the moment, I would say that at 80 percent we get it. But some continue to eat cacti.
And there (on the slide) barely begins to show “SLA for logging delivery”. He is not there yet, but we are working on it. Because it is very convenient when infra says that if you write in such and such a format in such and such a place and no more than N messages per second, then we are likely to deliver this and that there. This removes a bunch of headaches. If there is an SLA, then it is just wonderful!

How did we start to solve the problem? The main rake was with td-agent. It was not clear where we go logs. Are they delivered? Are they going? Where are they at all? Therefore, the first point was to replace the td-agent. Options for what to replace it, in short, I sketched here.
Fluentd. Firstly, I came across him in a previous work, and he also periodically fell there. Secondly, it is the same, only in profile.
Filebeat How was he comfortable for us? That he on Go, and we have a big examination in Go. Accordingly, if anything, we could somehow add it to ourselves. Therefore, we did not take it. To even the temptation of any was not to begin to rewrite it for themselves.
The obvious solution for the sysadmin is any syslog here in this quantity (syslog-ng / rsyslog / nxlog).
Either write something of our own, but we dropped it, as did the filebeat. If you write something, then it is better to write something useful for business. For delivery of logs it is better to take something ready.
Therefore, the choice actually came down to a choice between syslog-ng and rsyslog. I leaned toward rsyslog simply because we already had classes for rsyslog in Puppet, and I didn’t find an obvious difference between them. What is syslog, what is syslog. Yes, someone's documentation is worse, someone's better. He knows how, but he does it differently.

And a little bit about rsyslog. Firstly, it's cool because it has a lot of modules. It has a human-understandable RainerScript (modern configuration language). Awesome bonus that we could emulate the behavior of td-agent with its regular means, and nothing changed for the applications. That is, we change the td-agent to rsyslog, but for the time being we don’t touch the rest. And we immediately get a working delivery. Next, mmnormalize is an awesome thing on rsyslog. It allows you to parse logs, but not with Grok and regexp. It makes an abstract syntax tree. It parses the logs about how the compiler parses the sources. This allows you to work very quickly, eat little CPU, and, in general, is a very cool thing. There are a bunch of other bonuses. I will not dwell on them.

Rsyslog has a lot of flaws. They are about the same as bonuses. The main problems are to be able to prepare it, and it is necessary to select a version.
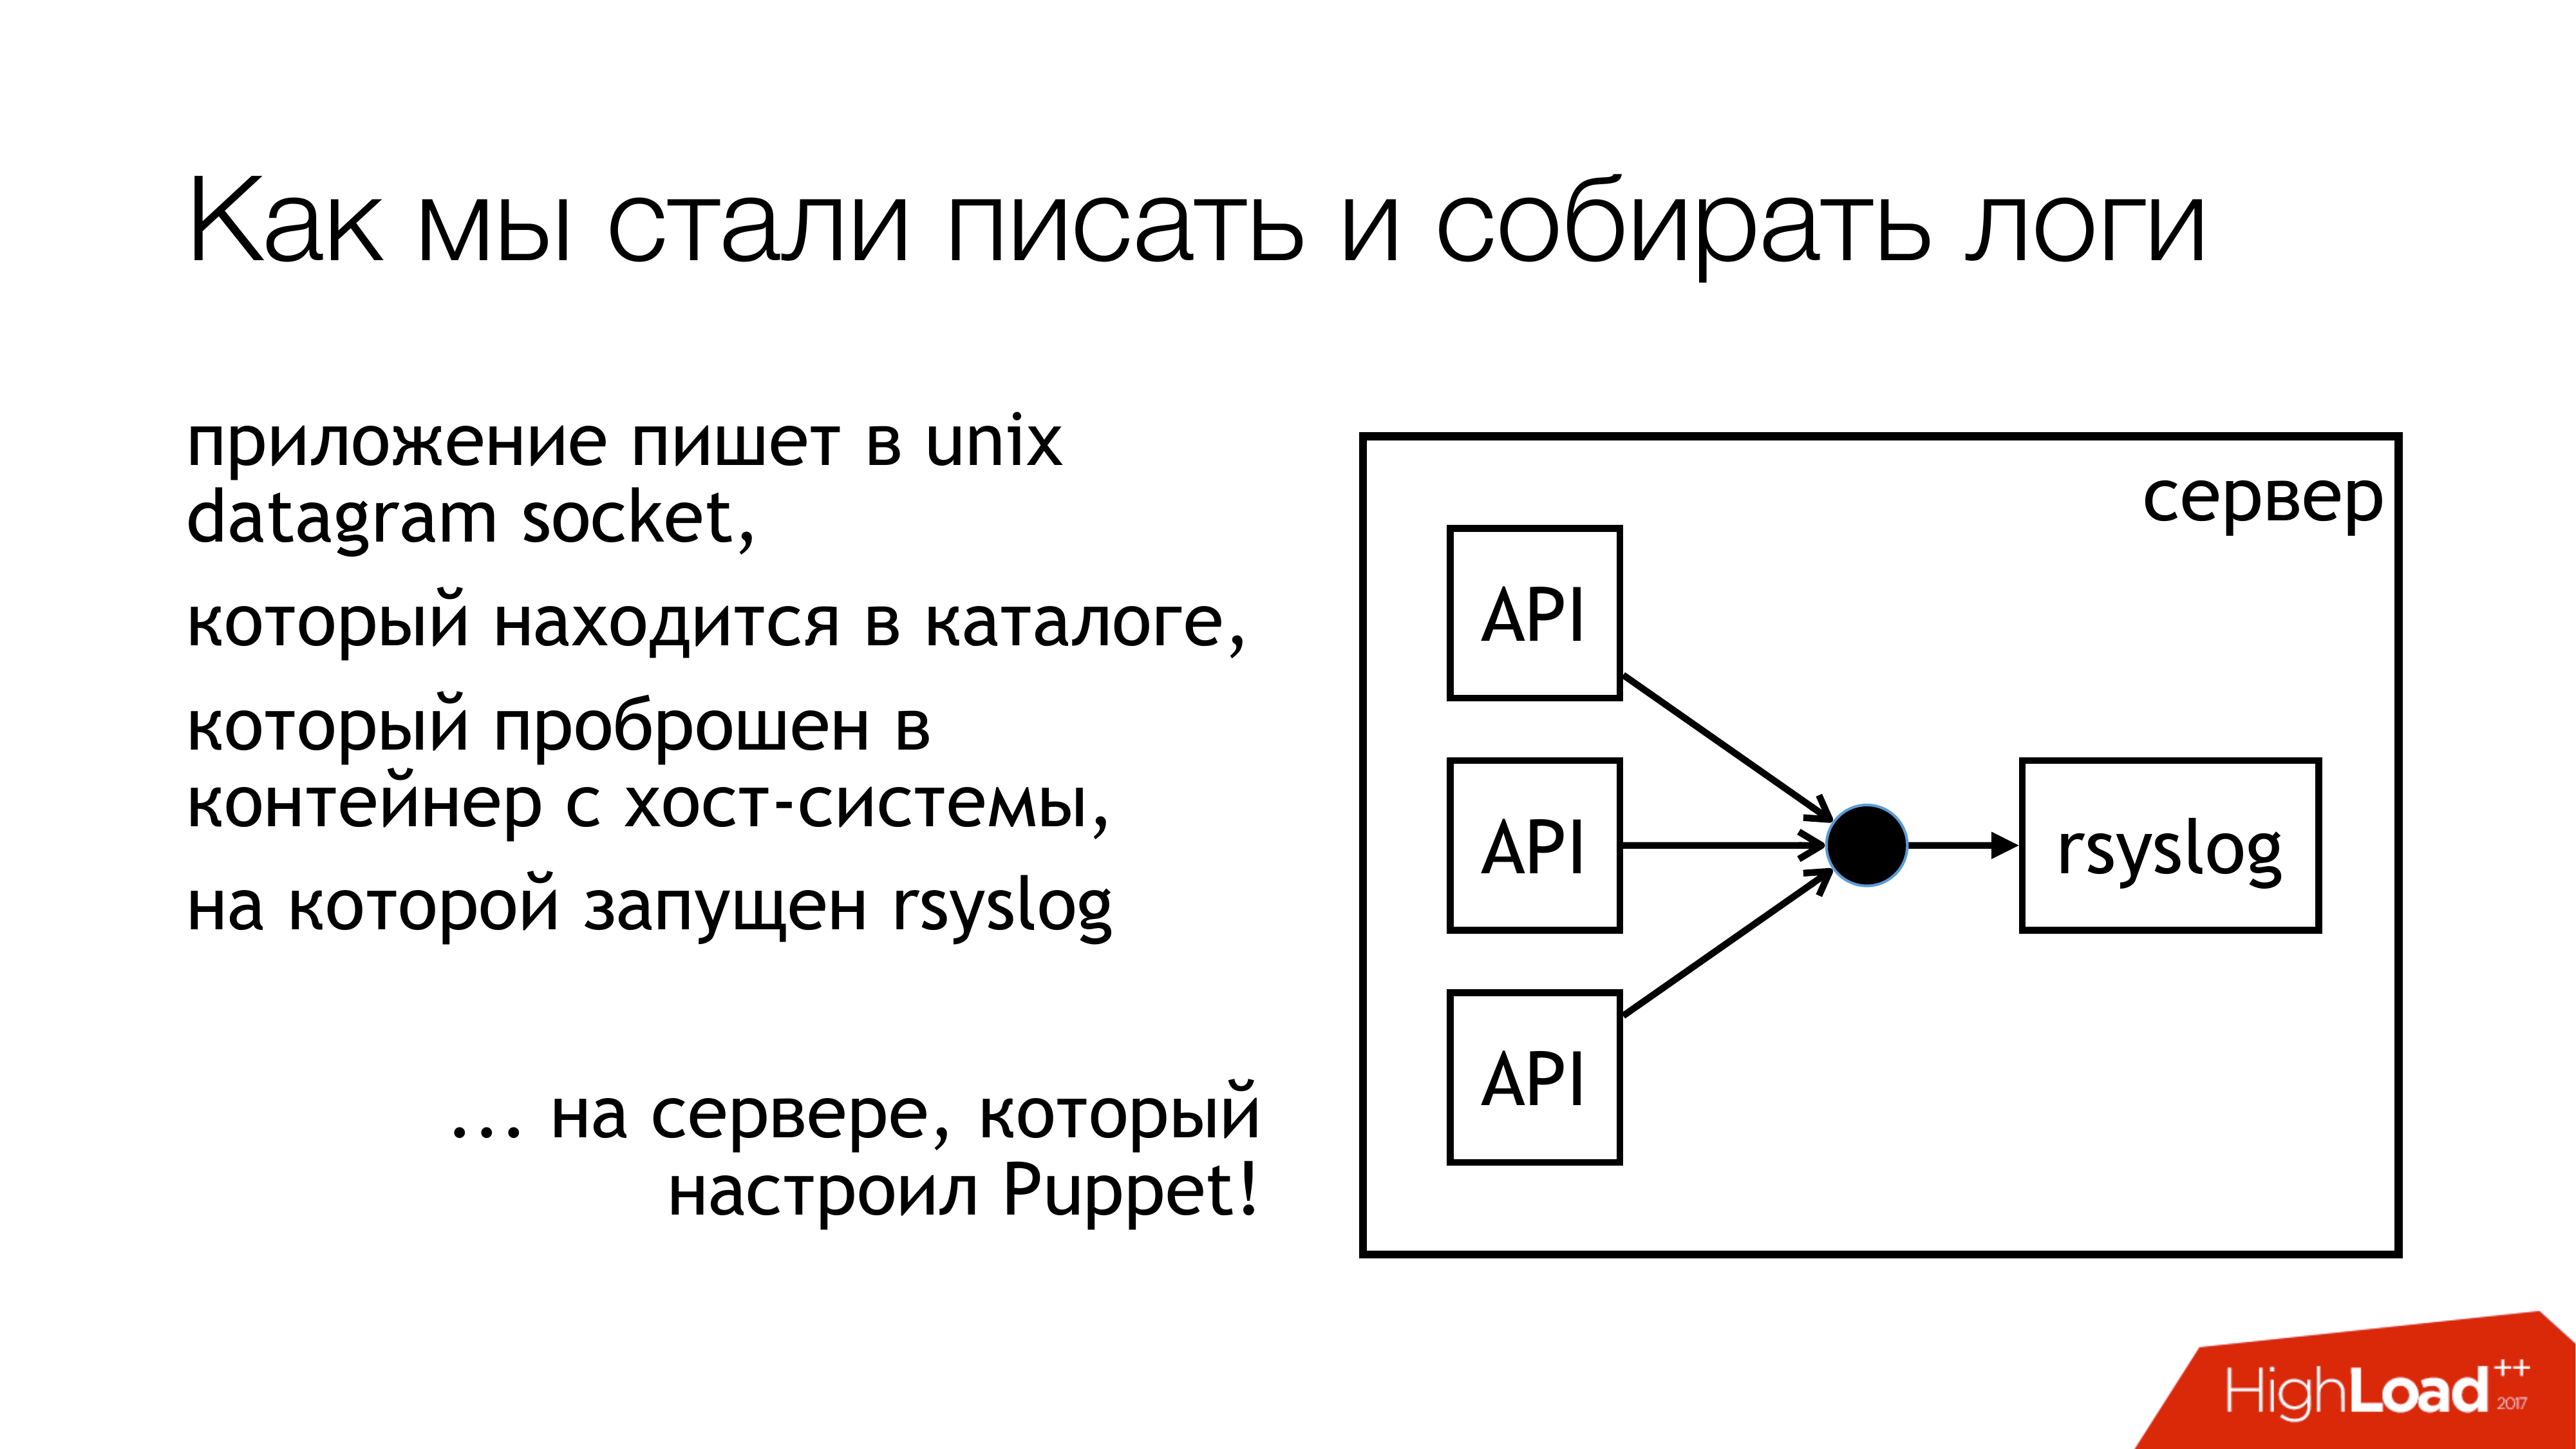
We decided that we will write logs in unix socket. And not in / dev / log, because there we have porridge from system logs, there is journald in this pipeline. So let's write to the custom socket. We will hook him to a separate ruleset. We will not interfere with anything. Everything will be transparent and clear. So we actually did. The directory with these sockets is standardized and forwarded to all containers. Containers can see the socket they need, open and write it.
Why not a file? Because everyone read the article about Badushechka , who tried to forward the file to the docker, and it was discovered that after the restart of rsyslog the file descriptor changes, and the docker loses this file. He keeps something else open, but no longer the socket where they write. We decided that we would bypass this problem, and, at the same time, we would bypass the blocking problem.

Rsyslog makes the actions indicated on the slide and sends logs either to relay or to Kafka. Kafka corresponds to the old way. Rayleigh - I tried to use pure rsyslog to deliver logs. Without Message Queue, standard rsyslog tools. Basically, it works.

But there are nuances with how to stuff them later in this part (Logstash / Graylog / ES). This part (rsyslog-rsyslog) is used between data centers. Here compressed tcp link, which allows you to save bandwidth and, accordingly, somehow increase the likelihood that we will get some logs from another data center in conditions when the channel is clogged. Because we have Indonesia, in which everything is bad. There is this constant problem.

We thought about how we actually monitor, with what probability the logs, which we recorded from the application, reach the end? We decided to have metrics. Rsyslog has its own statistics collection module, which has some counters. For example, he can show you the size of the queue, or how many messages came in an action. You can already take something from them. Plus, it has custom counters that can be configured, and it will show you, for example, the number of messages that an API recorded. Next, I wrote rsyslog_exporter in Python, and we all sent it to Prometheus and built the graphics. Graylog metrics are very desirable, but so far we have not managed to set them up.

What are the problems? Problems arose with the fact that we discovered (EXTREMELY!) That our Live APIs write 50k messages per second. This is only a live API without staging. And Graylog shows us only 12 thousand messages per second. And there was a reasonable question, but where are the remains? From what we have concluded that Graylog just can not cope. We looked, and, indeed, Graylog with Elasticsearch did not master this stream.
Further, other discoveries that we made in the process.
Writing to socket is blocked. How did it happen? When I used rsyslog for delivery, at some point we had a broken channel between data centers. Stopped shipping in one place, got delivery to another place. All this has come to the machine with the API, which write to the rsyslog socket. There is a queue filled. Then the queue for writing to the unix socket was filled, which by default is 128 packets. And the next write () in the application is blocked. When we looked at the library that we use in applications on Go, it was written there that writing to the socket occurs in non-blocking mode. We were sure that nothing is blocked. Because we read an article about Badushechka , who wrote about it. But there is a moment. There was still an endless loop around this call, in which an attempt was constantly made to push a message into a socket. Here we have not noticed. I had to rewrite the library. Since then, it has changed several times, but now we have got rid of locks in all subsystems. Therefore, you can stop rsyslog, and nothing will fall.
It is necessary to monitor the size of the queues, which helps not to step on this rake. First, we can monitor when we start to lose messages. Secondly, we can monitor that we have, in principle, problems with delivery.
And another unpleasant moment - amplification 10 times in microservice architecture is very easy. We have not so many incoming requests, but because of the graph, which these messages run on further, because of access logs, we actually increase the load on the logs about ten times. I unfortunately did not have time to calculate the exact figures, but microservices - they are. This must be borne in mind. It turns out that at the moment the log collection subsystem is the most loaded in Lazada.

How to solve the problem of elasticsearch? If you need to quickly get logs in one place, so as not to run on all machines, and not collect them there, use the file storage. This is guaranteed to work. It is made from any server. You just need to stick there drives and put syslog. After that, you are guaranteed in one place all the logs are there. Then you can slowly adjust elasticsearch, graylog, anything else. But you will already have all the logs, and, moreover, you can keep them, as far as disk arrays are enough.

At the time of my report, the scheme began to look like this. We practically stopped writing to the file. Now, most likely, we will remove the remains. On local machines running APIs, we will stop writing to files. First, there is file storage, which works very well. Secondly, the place is constantly running out on these machines, it is necessary to monitor it constantly.
Here is the part with Logstash and Graylog, it really soars. Therefore, we must get rid of it. You need to choose one thing.

We decided to throw out Logstash and Kibana. Because we have a security department. What is the connection? The connection is that Kibana without X-Pack and without Shield does not allow to differentiate access rights to logs. Therefore, they took Graylog. It has it all. I don't like him, but he works. We bought a new iron, put a fresh Graylog there and transferred all the logs with strict formats to a separate Graylog. We solved the problem with different types of identical fields organizationally.

What actually comes in the new Graylog. We just wrote everything down to the docker. We took a bunch of servers, rolled out three Kafka instances, 7 Graylog servers of version 2.3 (because I wanted Elasticsearch version 5). All this on raids from the HDD raised. Saw the indexing rate up to 100 thousand messages per second. Saw the figure that 140 terabytes of data per week.

And again a rake! We have two sales coming. We moved over 6 million posts. We do not have time to Graylog chew. Somehow you need to survive again.

We survived like this. Added a little more servers and SSD. At the moment we live in this way. Now we chew already 160k messages per second. We have not yet rested against the limit, so it is not yet clear how much we can really draw from this.

These are our plans for the future. Of these, really, the most important is probably high availability. We don't have it yet. Several cars are set up in the same way, but for now everything is going through one car. It takes time to set up a failover between them.
Collect metrics with graylog.
Make a rate limit so that we have one API that goes crazy and doesn’t kill the bandwidth and everything else.
And finally, to sign some SLA c developers, that we can serve here so much. If you write more, then sorry.
And write documentation.

Briefly, the results of all that we have experienced. First, the standards. Secondly, syslog - cake. Thirdly, rsyslog works exactly as it is written on the slide. And let's move on to the questions.
Questions
Question : Why did they decide not to take ... (filebeat?)
Answer : You must write to the file. I really did not want to. When your API writes thousands of messages per second, even if you rotate once an hour, this is still not an option. You can write to the pipe. What the developers asked me: “And what will happen if the process in which we write falls?” I just did not find what to answer them, and said: "Well, ok, let's not do that."
Question : Why don't you write logs just in HDFS?
Answer : This is the next stage. We thought about it at the very beginning, but since, at the moment, there are no resources to do this, it hangs in our long term solution.
Question : Column format would be more suitable.
Answer : I understand everything. We are "behind" with both hands.
Question : You write in rsyslog. There you can and TCP, and UDP. But if UDP, then how do you guarantee delivery?
Answer : There are two points. First, I immediately tell everyone that we do not guarantee the delivery of logs. Because when developers come and say: “And let us start writing financial data there, and you will put it somewhere in case something happens”, we answer them “Great! Let us start blocking on the record in the socket, and do it in transactions so that guaranteed we put it in the socket and make sure that we received it from the other side. ”And at that moment everyone doesn’t have to. And if it is not necessary, what are the questions for us? If you do not want to guarantee the entry in the socket, then why do we guarantee delivery? We do the best effort. We really try to deliver as much as possible and as best we can, but we do not give a 100% guarantee. Therefore, do not write there financial data. For this there are databases with transactions.
Question : When the API generates some message in the log and transfers control to microservices, have you encountered the problem that messages from different microservices come in the wrong order? Because of this, confusion arises.
Answer : It is normal that they come in a different order. To this must be prepared. Because any network delivery you do not guarantee the order, or you need to spend resources on it specifically. If we take file storages, then each API saves logs to its file. Rather, there rsyslog decomposed them into directories. Each API has its own logs there, where you can go and see, and then by the timestamp in this log you can match them. If they go to look in Graylog, then there they will be sorted by timestamp. Everything will be fine there.
Question : Timestamp may differ by millisecond.
Answer : Timestamp is generated by the API itself. In this, in fact, the whole trick. We have NTP. The API timestamp is already in the message itself. It is not rsyslog adds.
Question : The interaction between data centers is not very clear. In the framework of the data center, it is clear how the logs were collected and processed. How is the interaction between data centers? Or each data center lives its own life?
: . - . , . . Log Relay. Rsyslog . . . . . . , (), Graylog. storage. , , . . .
: ?
: ( ) .
: , ?
: , . . , Go API, . , socket. . . socket. , . . , . prometheus, Grafana . . , .
: elasticsearch . ?
: .
: ?
: . .
: rsyslog - ?
: unix socket. 128 . . . , 128 . , , , , . , . .
c : JSON?
: JSON relay, . Graylog, JSON . , , rsyslog. issue, .
c : Kafka? RabbitMQ? Graylog ?
: Graylog . Graylog . . . , , . rsyslog elasticsearch Kibana. . , Graylog Kibana. Logstash . , rsyslog. elasticsearch. Graylog - . . .
Kafka. . , , . . , , . RabbitMQ… c RabbitMQ. RabbitMQ . , . , . . . Graylog AMQP 0.9, rsyslog AMQP 1.0. , , . . Kafka. . omkafka rsyslog, , , rsyslog. .
c : Kafka , ? ?
: Kafka, , Data Sience. , , , . I do not know. Data Sience. , . Graylog, , Kafka. . API. live, staging . Graylog .
c : ? log- syslog .
: , . docker 1.0 0.9. Docker . -, … , , . API , API , stdout stderr. . , syslog- . Graylog . log- . GELF Graylog. , , . , - , , .
c : rsyslog. Kafka?
: , . For two reasons. , . . . Kafka . E , rsyslog. , , . - rsyslog , - Kafka.
')
Source: https://habr.com/ru/post/450098/
All Articles