Netramesh - lightweight service mesh solution
In the process of transition from a monolithic application to microservice architecture, we face new problems.
In a monolithic application, it is usually sufficient to simply determine in which part of the system the error occurred. Most likely, the problem is in the code of the monolith itself, or in the database. But when we start looking for a problem in microservice architecture, everything is not so obvious. It is necessary to find the entire path that passed the request from start to finish, select it from hundreds of microservices. Moreover, many of them also have their own storage facilities, in which both logical errors and problems with performance and fault tolerance can arise.

I spent a long time looking for a tool that would help cope with such problems (I wrote about it on Habré: 1 , 2 ), but in the end I made my own open source solution. In the article, I talk about the benefits of the service mesh approach and share a new tool for its implementation.
Distributed tracing is a common solution to the problem of finding errors in distributed systems. But what if the system has not yet implemented such an approach to collecting information about network interactions, or, worse, in part of the system it already works properly, but in part it does not exist, since it is not added to the old services? To determine the exact root cause of the problem, you must have a complete picture of what is happening in the system. It is especially important to understand which microservices are involved in the main business-critical ways.
Here a service mesh approach can come to our aid, which will take care of the whole machine for collecting network information at a level lower than the services themselves. This approach allows us to intercept all traffic and analyze it on the fly. Moreover, applications about it should not even know anything.
Service mesh approach
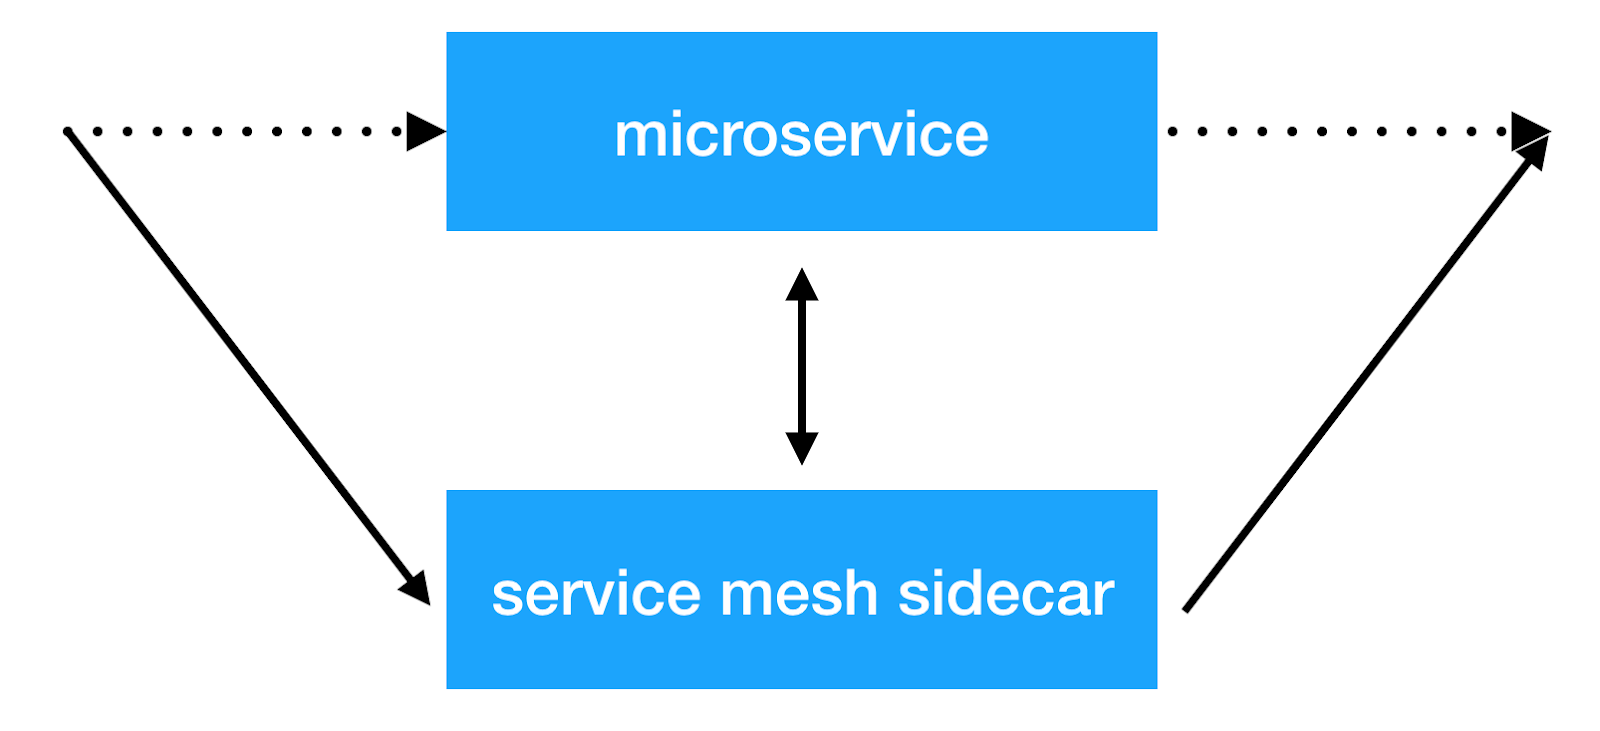
The main idea of the service mesh approach is to add another infrastructure layer above the network, which will allow us to do any things with inter-service interaction. Most implementations work as follows: an additional sidecar container with a transparent proxy is added to each microservice, through which all incoming and outgoing service traffic is passed. And this is the very place where we can do client balancing, apply security policies, impose restrictions on the number of requests and collect important information on the interaction of services in production.
Solutions
There are already several implementations of this approach: Istio and linkerd2 . They provide many opportunities out of the box. But at the same time a big overhead comes to resources. Moreover, the larger the cluster in which such a system operates, the more resources will be required to maintain the new infrastructure. In Avito, we exploit kubernetes clusters in which there are thousands of instances of services (and their number continues to grow rapidly). In the current implementation, Istio consumes ~ 300Mb of RAM for each instance of the service. Due to the large number of possibilities, transparent balancing also affects the total response time of services (up to 10ms).
As a result, we looked at exactly what opportunities we need right now, and decided that the main thing, because of which we began to implement such solutions, was the ability to collect tracing information from the entire system transparently. We also wanted to have control over the interaction of services and do various manipulations with the headers that are transferred between services.
As a result, we came to our decision: Netramesh .
Netramesh
Netramesh is a lightweight service mesh solution with the possibility of infinite scaling regardless of the number of services in the system.
The main objectives of the new solution were a small resource overhead and high performance. Of the main features, we wanted to immediately be able to transparently send tracing spans to our Jaeger system.
Today, most cloud solutions are implemented on Golang. And, of course, there are reasons for this. Writing network applications that work asynchronously with I / O and are scaled to kernels as needed on Golang is easy and convenient. And, which is also very important, the performance is sufficient to solve this problem. Therefore, we also chose Golang.
Performance
We focused our efforts on achieving maximum performance. For a solution that is deployed next to each instance of the service, a small consumption of RAM and processor time is required. And, of course, the delay in response should also be small.
Let's see what the results are.
Ram
Netramesh consumes ~ 10Mb without traffic and 50Mb at a maximum with a load of up to 10,000 RPS per instance.
Istio envoy proxy always consumes ~ 300Mb in our clusters with thousands of instances. It does not allow to scale it on the whole cluster.
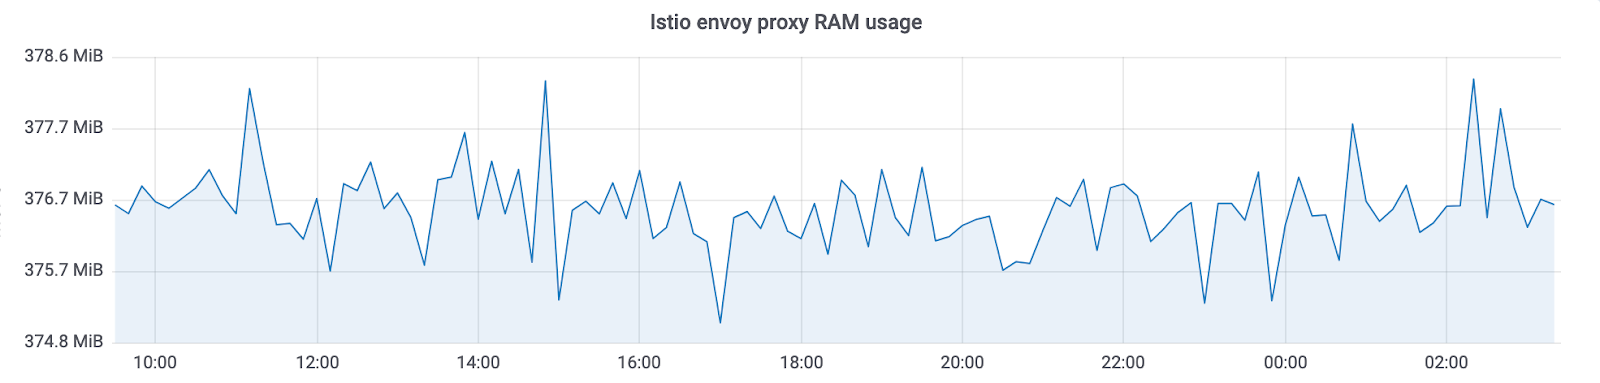

With Netramesh, we have ~ 10 times less memory consumption.
CPU
CPU usage is relatively equal under load. It depends on the number of requests per unit time to the sidecar. Values at 3000 requests per second in peak:


There is one more important point: Netramesh - a solution without a control plane and without load does not consume processor time. With Istio, sidecars always update service endpoints. As a result, we can see such a picture without load:

We use HTTP / 1 for communication between services. The increase in response time for Istio when proxying through envoy was up to 5-10ms, which is quite a lot for services that are ready to be responsible for a millisecond. With Netramesh this time decreased to 0.5-2ms.
Scalability
A small amount of resources spent by each proxy allows you to place it near each service. Netramesh was intentionally created without a control plane component to simply maintain the lightness of each sidecar. Often, in service mesh solutions, the control plane spreads service discovery information to each sidecar. Along with her comes information about timeouts and balancing settings. All this allows you to do a lot of useful things, but, unfortunately, inflates sidecar'y in size.
Service discovery

Netramesh does not add any additional mechanisms for service discovery. All traffic is proxied transparently via netra sidecar.
Netramesh supports HTTP / 1 application protocol. To determine it, a configurable list of ports is used. Usually there are several ports in the system that communicate over HTTP. For example, 80, 8890, 8080 are used for interaction between services and external requests. In this case, they can be set using the environment variable NETRA_HTTP_PORTS .
If you use Kubernetes as an orchestrator and its entity service mechanism for intracluster communication between services, then the mechanism remains exactly the same. First, microservice gets the service IP address using kube-dns and opens a new connection to it. This connection is established first with the local netra-sidecar and all TCP packets initially arrive in netra. Next, netra-sidecar establishes a connection with the original destination point. NAT on pod IP on a node remains exactly the same as without netra.
Distributed tracing and context passing
Netramesh provides the functionality necessary to send tracing spans for HTTP communication. Netra-sidecar parses the HTTP protocol, measures the delay of requests, extracts the necessary information from the HTTP headers. Ultimately, we get all the trace'y in a single Jaeger system. For a fine configuration, you can also use the environment variables provided by the official jaeger go library .


But there is a problem. Until the services generate and wrap a special uber header, we will not see the connected tracing span in the system. And this is what we need to quickly find the cause of problems. Here Netramesh has a solution again. Proxies read HTTP headers and, if they do not have a uber trace id, generate it. Netramesh also stores information about incoming and outgoing requests in sidecar and compares them by enriching them with the necessary outgoing requests headers. All that needs to be done in services is to send only one X-Request-Id header, which can be configured using the NETRA_HTTP_REQUEST_ID_HEADER_NAME environment NETRA_HTTP_REQUEST_ID_HEADER_NAME . To control the size of the context in Netramesh, you can set the following environment variables: NETRA_TRACING_CONTEXT_EXPIRATION_MILLISECONDS (the time during which the context will be stored) and NETRA_TRACING_CONTEXT_CLEANUP_INTERVAL (the frequency of clearing the context).
It is also possible to combine several paths in your system by marking them with a special session marker. Netra allows you to set the HTTP_HEADER_TAG_MAP to turn HTTP headers into corresponding tracing span tags. This can be especially useful for testing. After passing the functional test, you can see which part of the system was affected by filtering on the corresponding session key.
Identify the source of the request
To determine where the request came from, you can use the function of automatically adding a header with the source. Using the environment variable NETRA_HTTP_X_SOURCE_HEADER_NAME you can set the name of the header to be automatically installed. Using the NETRA_HTTP_X_SOURCE_VALUE you can set the value to which the X-Source header will be set for all outgoing requests.
This allows unified throughout the network to make the distribution of this useful header. Then you can already use it in services and add logs, metrics.
Routing traffic and internals Netramesh
Netramesh consists of two main components. The first, netra-init, establishes network rules for intercepting traffic. It uses iptables redirect rules to intercept all or part of the traffic on the sidecar, which is the second main component of Netramesh. You can configure which ports to intercept for incoming and outgoing TCP sessions: INBOUND_INTERCEPT_PORTS, OUTBOUND_INTERCEPT_PORTS .
Also in the tool there is an interesting opportunity - probabilistic routing. If you use Netramesh exclusively for collecting tracing spans, then in a production environment you can save resources and enable probabilistic routing using the variables NETRA_INBOUND_PROBABILITY and NETRA_OUTBOUND_PROBABILITY (from 0 to 1). The default value is 1 (all traffic is intercepted).
After successfully intercepting the netra sidecar, it accepts a new connection and uses the SO_ORIGINAL_DST socket option to obtain the original destination. Then, Netra opens a new connection to the original IP address and establishes two-way TCP-communication between the parties, listening to all the traffic going through. If the port is defined as HTTP, Netra tries to parse it and trace. If HTTP parsing is unsuccessful, Netra makes a fallback on TCP and transparently proxies the bytes.
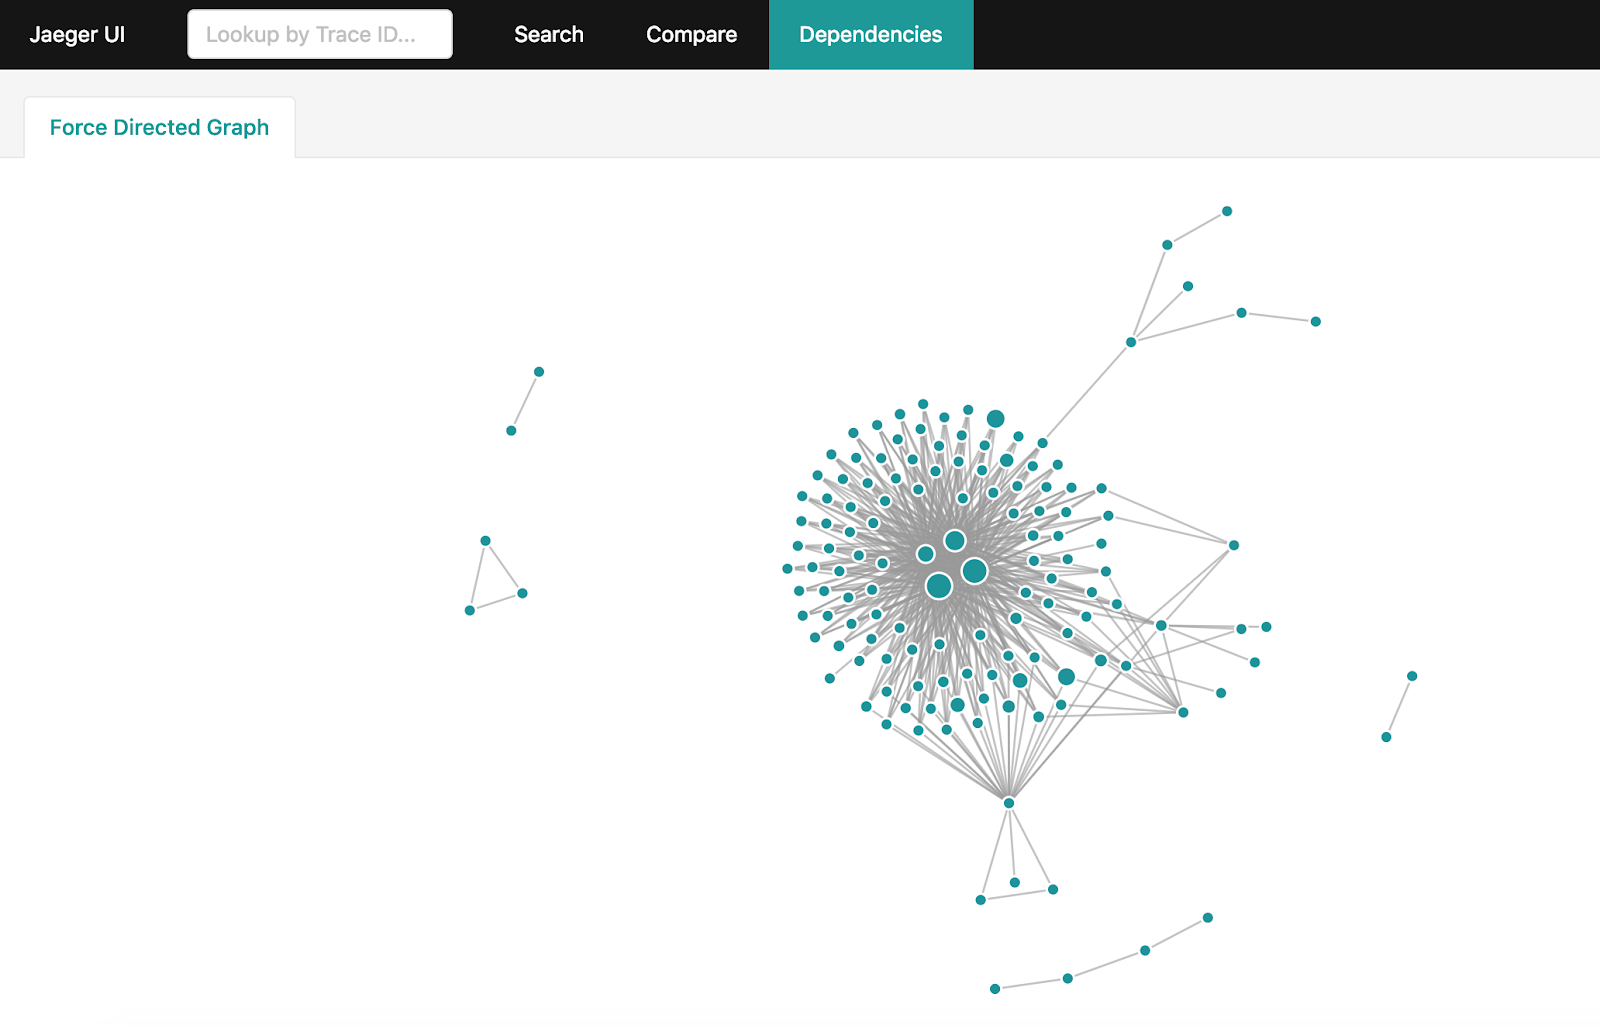
Building a dependency graph
After receiving a lot of tracing information in Jaeger, I want to get a complete graph of interactions in the system. But if your system is loaded enough and billions of tracing span accumulate in a day, making their aggregation becomes not so easy. There is an official way for this: spark-dependencies . Nevertheless, he will take hours to build a complete graph and force the entire dataset to be pumped out of Jaeger over the past 24 hours.
If you use Elasticsearch to store tracing span'ov, you can use a simple utility on Golang , which will build the same graph in minutes using the features and capabilities of Elasticsearch.
How to use netramesh
Netra can be simply added to any service running any orchestrator. You can see an example here .
Currently, Netra does not have the ability to automatically introduce sidecar to services, but there are plans for implementation.
Future netramesh
The main goal of Netramesh is to achieve minimum resource costs and high performance, providing basic opportunities for observability and control of interservice service.
In the future, Netramesh will receive support from other application layer protocols besides HTTP. In the near future, L7 routing will be possible.
Use Netramesh if you encounter similar problems and email us with questions and suggestions.
')
Source: https://habr.com/ru/post/449974/
All Articles