"They offered to get acquainted with the calculations of one indicator, and there are two sheets with integrals and second derivatives"
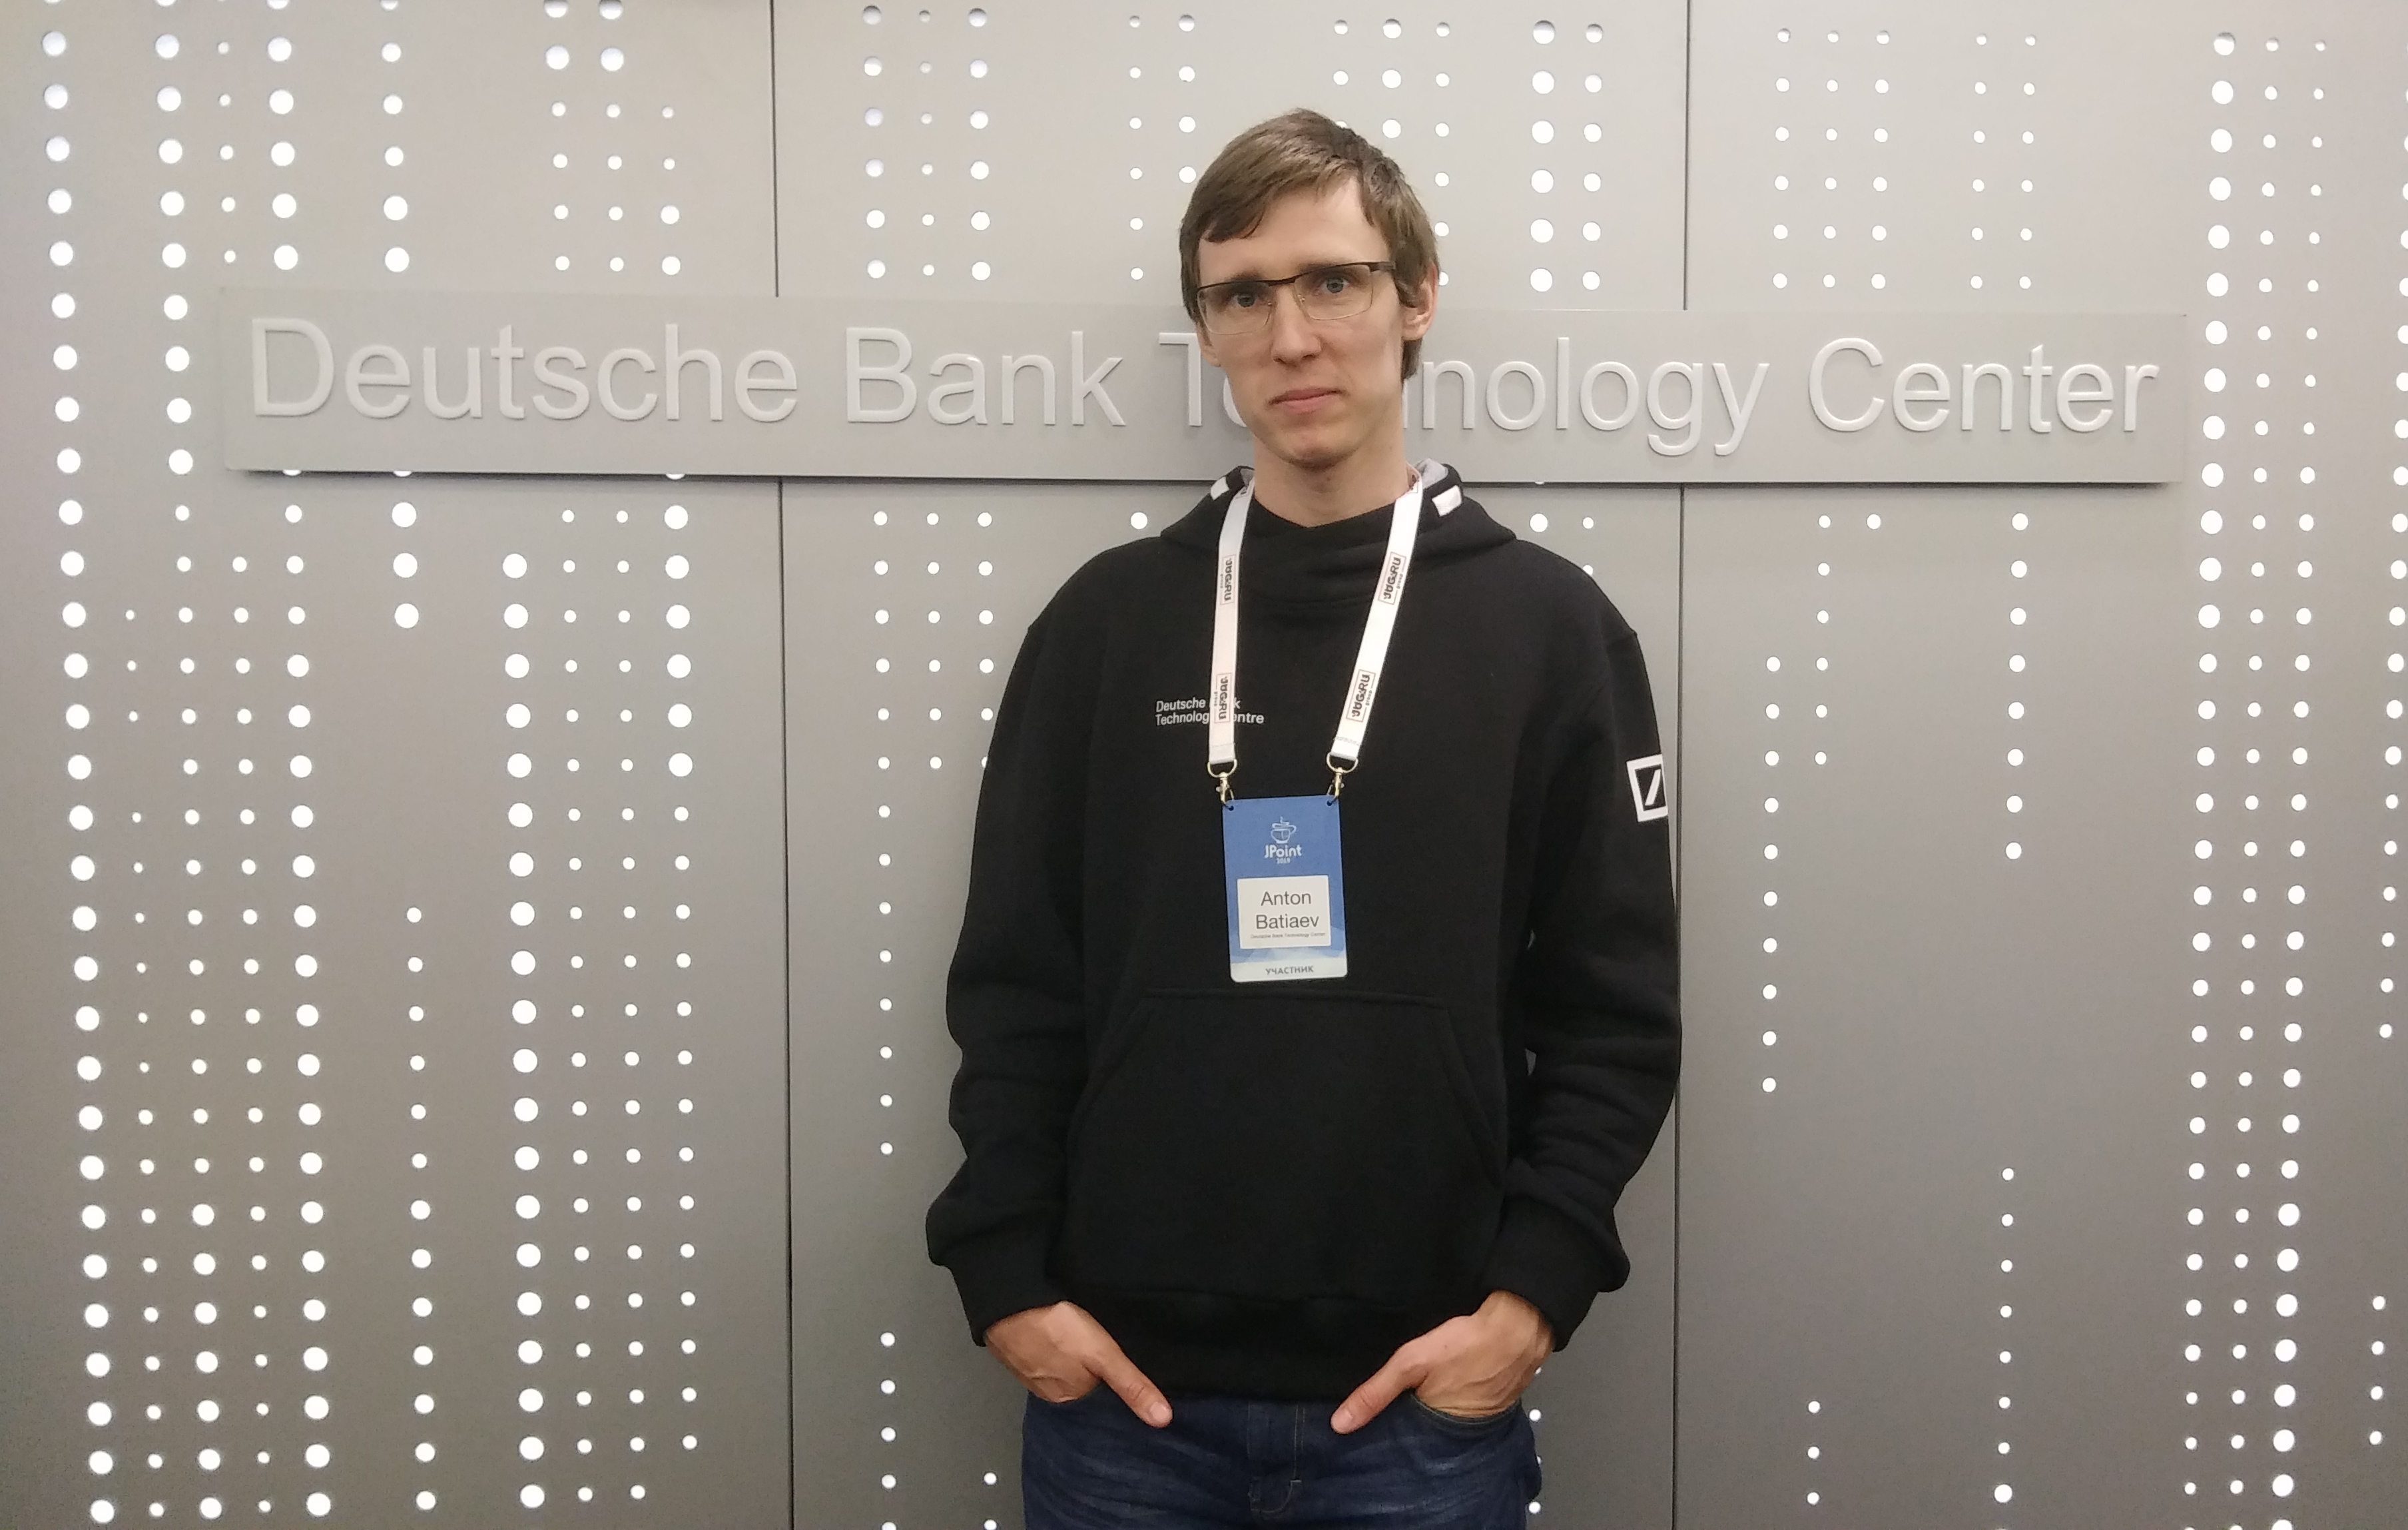
This is an interview with Anton Batyaev ( batiaev ) from Deutsche Bank Technology Center. We will talk about what financial mathematicians do, where data from banks come from, how they are processed and optimized. On the difficulty of getting into the financial sector, trading on the stock exchange and the general need for banks.
What and how do they count in the bank?
- Introduce yourself, please: tell me who you are, what you do.
I moved to the Deutsche Bank TechCenter in early January of this year and am currently developing the server side of the project, which considers various risks of financial instruments for many different traders around the world and other teams that require this data.
The project has built a fairly extensive infrastructure that uses many popular standard frameworks, non-relational databases, and works with big data on Kafka. We also work with a grid on tens of thousands of CPUs, use various custom projects, optimize work with protobuf, implement calculations in financial mathematics,
As part of the infrastructure there are a number of additional optimizations and chips. Perhaps this is obvious, but it is extremely difficult to consistently and logically tell what is happening in the bank. A couple of percent got thrown in and got a finrez - this is complex mathematics, algorithms, and large infrastructure, technical, and optimization tasks.
- Come in order. You said that in the Technical Center you are doing calculations for the global banking platform. And what generally can be considered in the bank?
Based on my experience, within the framework of investment activity, both prices and a number of other indicators of various instruments are considered. If we talk about promotions, then everything is clear: a quote is their price. For bonds, this will be a percentage of par.
If we talk about derivatives (derivative financial instruments), there the price is the amount of the premium that must be paid for this instrument. It is calculated using many different formulas. There is a Black-Scholes formula that estimates the value of options — this is a function that depends on the function of the current quote, underlying asset, volatility, time to expiration, and many other factors.
There are models that allow you to calculate the value of a trader's portfolio. The department or company has a set of transactions, derivative financial instruments in the portfolio, and you need to calculate how much they are worth now. Separately, there can be one price, and in aggregate they can somehow correlate, give discounts and so on. Separately, there can be one price, and in aggregate, they can somehow correlate, give discounts, and so on. For example, synthetic positions: how to assemble an option equivalent to a futures position from options. This is suitable, for example, for non-linear assets such as options, but not necessarily true for all types of derivatives. The valuation is based on the base asset quotation on which the derivative is based. For example, the quotation of one or several currency pairs. Derivatives can be built on different underlying assets: for foreign exchange, the underlying assets will be the euro, the dollar, and so on; for commodity derivatives - oil, gold, wheat; for spot - various stocks and bonds.
In addition to evaluating derivatives, risks are also considered - what happens if prices in the market storm more (volatility changes). Or what happens if the dollar will be in relation to one or all other currencies not 60, but 100 rubles. What happens to a particular instrument, a portfolio.
It is necessary to calculate this in real time, as well as approximate the current state of the portfolio to various adverse outcomes of price movements for each of the currencies, changes in market volatility. To do this, we build a matrix of all possible changes, which shows what is now, what will happen tomorrow and what will happen if a crisis in the market occurs.
This is necessary in order to assess what to buy and sell in the current moment and what are the risks. And, in particular, assess what will happen in the future, evaluate trading strategies and more accurately respond to market changes. For example, one of the quanta came up with a new algorithm for calculating risks - you need to check on historical data, drive, for example, across all stock information for decades and see what happens.
For these needs there is an infrastructure connected to various exchange platforms that transmit market data to us. Since our company has a lot of data all over the world, we need to somehow store and build pre-aggregates in order to process them quickly.
- Before we go to the infrastructure part, I want to ask about what you have already said. You talked about a bunch of any analysis algorithms, where did these algorithms come from? Is this some kind of book knowledge or your work?
There are a few points. First, well-known formulas and algorithms invented by mathematicians are taken. For example, the generally accepted pricing model for options is the Black-Scholes formula. But, besides this, there are internal improvements: in particular, we use other laws of price distribution, we twist the coefficients in these formulas. The formula for the distribution of prices, transactions and other indicators can be very different.
If we talk about optimization, these are already internal improvements. For example, instead of calculating indicators at each point, developers can read key values and do an approximation that will cost 20 times less computer time, but it will give acceptable and sufficient accuracy.
All data is constantly changing, and it is important for us not only for reporting, but also to give traders a current picture of the market condition.
- This is quite complicated information, and it is probably quite difficult to transfer it from person to person. What is your team size, and how do you transfer knowledge to each other?
35 people work on our project in Moscow. These are a few teams that are engaged in various pieces of functionality: UI, backend, infrastructure, financial mathematics. Each such team has in-depth expertise in the functionality of a specific module. But in addition to these people, there are still as many people involved in systems related to our project.
All information about our project is described by analysts at Confluence, it is also contained in the task descriptions in JIRA, where there are links to standard mechanisms and public formulas. Examples of the use of functionality can be found in the tests. Well, human communication has not been canceled.
- Financial mathematics: how many are they and who are they? Any important scientists?
Yes, these are mainly specialists (quanta) who sit in London and build financial models of how the market works. Most often they have a PhD in finance or mathematics. They know how the market works, what traders need, and can come up with some kind of mathematical model that describes the state of the market, algorithms for calculating risks and correctly estimating derivatives.
For example, my colleague Alexander wrote an article on Habré , where he already mentioned experience with a quantum.
- Can ordinary developers communicate with them? How does this communication occur? After all, in mathematics and conventional development, the worlds are completely different.
They can communicate and communicate: it is clear that some top-level business tasks and concepts are discussed with leads, but within the framework of specific calculations of risks or other indicators, the developer communicates directly with the trader or quantum that built this model.
But in fact, this is a mutual process of interaction, since it is not always the theoretical algorithm that is implemented in practice. Therefore, developers can suggest changes to the model so that it fits into the current architecture of the application.
There are many ways of interaction - the same Skype, telephone, all standard communication tools.
- Software, which is obtained as a result - automatic? Are they robots or is there something for traders who are engaged in technical analysis - charts or something else?
There are several options for using software: the first is automatic, i.e. trading robots, the second is an assistant for a trader who shows the current state of the portfolio, details of the existing risks for different indicators, options for trading operations that he can do now, as well as the future status of the portfolio and risks as a result of these operations. There are also indicators for traders, calculation of risks and data on the state of portfolios.
- Another metric is data analysis frequency, how often do you do it? On the one hand of the spectrum, as I understand it, some microseconds, and on the other - an analysis of big data that can go weeks.
Depending on the complexity and importance of the indicators, these can be live indicators, which are recalculated for each tick, and then the calculation goes on in milliseconds. And if we calculate the cost of portfolios, then updates occur once a second, so that the human eye has time to perceive it.
If we describe long calculations (for example, some complex risks), data on which are needed during the day, then the tasks are sent to the grid, the scenario of changing currency quotes is considered. The general mechanism is as follows: you consider all new transactions within a certain cycle, then you are doing a difficult task on the grid to recalculate indicators for the entire set of transactions in the current market condition.
Such tasks can be updated once an hour. If you need to drive off trading strategies, this is a long task, they have thrown it, and for several hours it is considered, depending on the complexity and amount of data. The tasks on the grid can be very small, for example, calculate one formula and give one result, or large, for example, for tables where you need to calculate the correlations of all possible risk scenarios and give the cumulative result.
Here there is a task to optimize the load of the grid and to predict the time for calculating the task, depending on the type of instrument, the amount of data and other indicators, to load it to the maximum. Because if you throw one big task, all the others will wait in the queue, although during this time it was possible to count something else.
In general, the problem of a backpack and other optimizations. Where ping before the grid is longer than the calculation time itself, we will do it on the back end, where a mini cluster is already deployed for such small tasks.
- Can this somehow be put in some kind of structure? As far as I understand, different optimization methods are applied depending on the scope of the tasks. On small tasks, it makes sense to optimize the JIT compiler, and on large ones something else. Tell us what the problem areas are and what methods are used there for acceleration and optimization.
An example of a large task is the calculation of all financial instruments and risks when the quotations of each currency change by 1-2-3-10%. In this case, optimization will consist in grouping transactions into bundles so that within one bundle there are deals for one type of portfolio or one currency.
In order to avoid a multitude of risk calculations for each transaction, we present them as one transaction for a large volume, and then proportionally split up the results. Thus, we reduce the number of calculations required.
Another optimization example is this time with currency pairs. Suppose there are two pairs of "ruble-dollar" and "ruble-euro." In the first pair you can imagine that the ruble is falling, but it is possible that the dollar is growing. In fact, this is the same thing. The same is true with the ruble-euro pair. Accordingly, we can consider different pairs at first glance in one bundle, assuming that the ruble changes in both cases.
The number of calculations decreases and the result is accelerated. It seems to have changed one currency (in our example, the ruble), but in fact they calculated the risks of heterogeneous assets.
- Is it possible to solve the problem in the forehead and roll it into a huge, huge cluster?
There is such a cluster, but it is already loaded with a lot of calculations. The cluster is not rubber, despite the tens of thousands of CPUs that are currently there.
- And in terms of software, In-Memory DataGrid or Hadoop?
Yes, there are both Hadoop and Kafka for processing all this, and ClickHouse database for optimizing work with big data. In terms of data placement, it is clear that chasing JSONs is, to put it mildly, inefficient. In this regard, there are moments of optimization of working with Protobuf. It is important for us not only to lay down the binary data, but at the same time to make it as tight as possible using dictionaries.
In them we will store, for example, contract specifications of the same type for all transactions. Due to this optimization with dictionaries, a colleague saved 30% of the occupied memory.
- These are dictionaries that lie on specific nodes and are duplicated or are in the central base?
Differently. Mainly in the central base. And there are dictionaries that you transfer to the grid along with a pack of calculations. She wants to have the most compact, so as not to drag a lot of data, as the Internet channels are not rubber.
How it works. You send a calculation task to the grid with all the necessary information for it, which you pack into dictionaries to avoid duplicates. Inside will be all the content, and do not need to go to additional storage. This saves network traffic and reduces delays in calculations.
- As far as I know, banks have an analysis on historical data, which is one huge packet of data per gigabyte-terabyte. And the approach with a single database is not a ride? You can put 2 TB on the key, but this is not good.
Yes, such moments are solved by portioning. You will have local caches for countries, decomposed into stock information, because sending information about all transactions from New York to Singapore is resource-intensive. It is clear that here the division by country is logical: for example, transactions in the United States will be placed in American data centers. A similar situation with quotes - you need to build a routing and determine what kind of transaction, to which region it belongs, in order to understand where the caches lie, send it to the necessary storages and databases and not to drive the data once again.
- And it happens that you need to join data from different regions?
Yes, it happens, and it is a difficult task. It is clear that we will not download terabytes of data from all regions in order to get aggregated results. Most likely in each region you will calculate the local aggregate of this region and then you will already collect all these results to obtain summary data.
- Most likely, there are external data, for example, stock market history. And how to handle them? Mirror yourself inside, or are there ways to process them?
There are protocols and connections to standard data providers: Reuters, Bloomberg, which provide stock information. We store the necessary data in internal storage, but some of the things can be re-requested from the data provider. Again, by region, so as not to drive traffic.
It is clear that they also have deployed servers around the world to ensure speed and performance.
- And the data for reading or reading / writing? If the record, not afraid to roll such volumes?
Basically, for reading, writing is at the time of recording information about transactions and other information required by regulators. Basically, calculations for domestic needs: risks, cost of portfolios and so on. This is an internal kitchen, you move data from some region or data center, without sending it outside.
- If a piece breaks off the moon and arrives at the data center, what will happen? Is that the end?
Data in the data center is mirrored. It is clear that within the region the data does not lie on one hard disk in one data center. Otherwise, as in that bike, any cleaner could accidentally knock out the server. Everything is copied online: there is a data flow in both directions, you count from the nearest mirror, and synchronize with the recording to ensure consistency.
But, as a rule, much less information is available on the record, because it should be displayed to the user. If he sees the recalculation not now, but 2 seconds later from another source, it's sad, but you can live. It is clear that the data that is needed for regulators, external marketers and market participants is duplicated and synchronized in several sources in order not to lose anything.
How in the Techcenter Deutsche Bank prepare data and collect garbage

- A question about data preparation. As far as I understand, each source has its own format, and instantly converting them is not a good idea. Do you somehow pre-prepare them for calculations?
There is an internal uniform format. It is clear that it is more convenient to work with the same type of data, but this translates into the need to convert them. There are data streams and teams that are responsible for stock information, connection to suppliers. They form and enrich the data in our single format. To solve performance problems, there will be two data streams, one of which is a fast loop that will give out information coming from the exchange data stream. Due to this, the need to go to different storages and form a standard structure less often happens. On it you can calculate the indicators required in real time.
And there is a slower loop that processes the same stream, but with all the necessary set of fields, in our format. It is carried out all the slower calculations that require a lot of additional information, fields and everything else.
- How does it look from the point of view of the developer? Do you always know which area of the database is affected by "heavy" calculations?
An event arrives to you, the fields in which can be filled either 100% or only partially. On fast events, you count figures that are recalculated online quickly. On a long and slower cycle with a complete set of data, you recalculate tasks that require all indicators. This is if you do not go deep, since everything depends on the specifics of the tasks.
- And the data is stored on what? HDD, SSD, RAM, entirely in RAM?
Mostly in memory. We work with large hips on backends that consume and store data either in standard structures in Java, or on some In-Memory Data Grid, depending on how fast and how close data you need. It is clear that the historical data of the past days will be stored on the SSD and drives. But what is necessary or may be needed for calculations will be loaded into the cache, into memory.
- Is it possible to do something without caching, but with the loss of information using inaccurate calculations?
Yes. I mentioned a little bit that sometimes it is necessary to calculate the risk on the chain of change of an asset from 0 to 100%, as indicators have changed. The graph of distribution is based on interest, according to the formula or a linear relationship. You build the key points and do the approximation. Approximate results are obtained, which will not coincide with the real value by 100%, if we considered at each particular point of the graph, but would be sufficient to work with this data.
This approach is often used because it allows, for example, not to make all the calculations when the value of each currency changes relative to all other currencies, in increments of one penny. You calculate either by moving with a rare step, or by selecting a few specific points, and you interpolate the rest. Accuracy values will be sufficient.
- Are these always big hips in java or is everything off-line?
Basically lies on the hip.
- How then do you struggle with garbage collection?
In addition to the standard monitoring of allocations and the frequency of operation of the garbage collector, you start to twist some things like huge pages, you work on a number of things like choosing the right garbage collector and so on. For example, you can try to use Shenandoah. Some components are built and tuned based on the absence of full GC as a phenomenon.
This is an iterative process: every day you collect flame graph live, see who and where consumes resources, look at the frequency of allocations and what they fall out of, and you begin to rewrite the hot algorithms in the code for more optimal ones or optimize the calculation as a whole.
- And what are you collecting metrics for than building a flame graph?
There is nothing fantastic in the toolkit, it is either some Java agents written by us that connect and collect information, or standard profiling tools and other tools. There are mechanisms for wrapping events into the ELK stack, there are logs with the assembly of metrics on GC-pauses and memory consumption indicators, there are manual or semi-automatic requests for unloading the heap state, dump indicators and their processing. Removing a 150 GB hip and processing is a task that requires certain tweaks. Colleagues wrote an article on Habré on how to deal with 150 GB of garbage and what happens. I did not dig deep, so I will not tell in details.
- What is your Java and what GC are used?
Java 8, the 11th is being tested on some backends. Compare performance. G1 is mainly used as a garbage collector.
- Old collectors are not at all?
Yes, we use new ones. Well and we wound them up with JVM keys.
- As I understand it, most of the work is related to optimization, performance. Is it possible to somehow test the optimization, and can it be done automatically?
Yes you can. We have our own test framework, which allows you to connect to test circuits and measure the calculations of each indicator. We have a dedicated team engaged in its creation. You can measure the speed on the prode and uate ( UAT - user acceptance testing ) - see if the performance has not subsided. You can check the correctness of mathematics, the frequency of requests and the time of their execution, you can check the work with the grid. If it works for 2 minutes, and on the site - 3 minutes, you need to understand why this happens.
The testing procedure starts automatically. A connection is made to the two circuits, the indicators are measured, and then you can throw custom queries, compare the results for response time and delay on different versions of the product. You can compare how often garbage collection has become triggered, and so on.
- You told about a large number of components, are there any tests that capture the entire system, global integration tests? Or is it all microbench marks?
This is a complex infrastructure thing. It runs throughout the system as a whole: you can find out the heap size, GC response time, live set size in memory, and so on. Some complex things. The key feature of this system is the ability to catch even the slightest changes in the numbers along the entire calculation path. In fact, this is our last line of defense. We can be sure that we have not made any unexpected changes anywhere inside this huge system.
Performance data can be detailed for specific business functionality, some indicators. See how quickly and often they are considered. You can create custom requests, run them on different copies and issue JSON diff. In this JSON are changed data and performance indicators.
There is a separate team that develops all this. For example, connection to different environments, support for visualization and other functionality. This is an internal development.
- Is there a way for a young or old developer to make a mistake that will spoil the performance so much that the whole system stops?
It will not be possible to do this, because such changes do not affect all applications at once, because we use a modular system with microservices. Although with a hip of 100 GB, they are not very “micro”, but nevertheless. They may be slightly smaller or larger in size, depending on the problem to be solved. It is unlikely that you will be able to affect the entire system completely and drastically break performance.
You commit to master, at the touch of a button, deployment on combat servers starts, it all unfolds and is run through regression testing, and then problems can be detected with manual and other types of testing. And the drawdown in performance due to the fact that the test framework covers not only the correct part of the calculations, but also work with performance, memory and everything else, can be noticed. In investment activity, the speed of settlements and making trading decisions based on them has a significant role.
Even in the flame graphs that are downloaded once a day by the results, you will notice that yesterday there was one result, and today it is completely different. You understand what code leads to problems, where there was a performance slump and everything else. I’m not even talking about standard tests and CIs that solve explicit logical bugs.
- And what about logical bugs at the level of financial mathematics?
You check the discrepancies in performance due to the test framework. Himself - if there is enough expertise, or with analysts and quanta who invented mathematics. You understand whether the changes are correct, why they are such, drive on real and synthetic transactions to verify the result. If someone made a mistake, it needs to be corrected and rechecked.
About financial backend
- Recall what you are doing in this huge system.
I am engaged in backend - a system that uses a service that implements the very mathematics. I prepare inquiries for these conditional calculators, send them there, get answers on risks, portfolio values and indicators, make some transformations.
Relatively speaking, in one place you need to consider the cost of risk for some instrument, and in another place - to do it on the basis of a single basic risk of its variation, that is, expand this result to options and send it to the UI to display the data. This is a backend that builds the calculation data, goes to the system that directly calculates all the most hard math, and sends the results to the UI.
- And what technology is used there? Are these purely your own ideas, or can you work with “universal” things like Spring?
There are standard things like Spring, Java, MongoDB and Protobuf, various standard systems for dependency injection. Still any UI on React, interconnections through gRPC with external systems to give them data.
- I heard Mongo, but did not hear Oracle. Do you have a full-scale relational database or something?
Yes, but in a different format. On the backends arrives update stock information in the form of individual messages and events. And if you go to the database for some data from previous periods, then you connect via the standard JDBC driver. There are no higher level libraries like SpringData and everything else, just pure JDBC queries. This is a question of performance, query compactness and everything else that is difficult to achieve using ordinary frameworks for high-level tasks.
- Have you tried somewhere to use CQRS?
Tried, there is, but this is basically stock information.
From safe to futures
- And initially you studied for whom? Programmer, mathematician ...
I'm safe.
- How did you come to this? If you once took up security, it's hard to get off.
The safety diploma does not say that I dealt only with security. I studied for her, but for the most part from my first year at Kodil, I got a C ++ developer. I wrote for cash registers with built-in GNU / Linux, and then switched to Java. He wrote standard backends and business automation, worked in the brokerage field in one financial corporation. Implemented derivatives calculations, risk calculations. He was a simple developer, lead, architect, head of department. Much had time to do.
I have been here since January, and before that I had been working in financial mathematics for about two years.
- How did you leave mathematics so easy to develop?
In fact, it is difficult to call financial mathematics "simple" development. Even if you are not directly involved in the implementation of an algorithm that calculates the assessment of a derivative, some kind of risk or other indicator, you still do some kind of calculations. It’s not just a clean backend, I’ve already said that there are mini-clusters for “simple” quick calculations on the backends. In other words, the fact that I do not affect services that consider basic mathematics does not mean that I do not do calculations at all.
- What is interesting and cool about this work?
First, the fact that you can understand finance. Me
personally it is very inspiring: financial mathematics, trading, stock exchange and all that. I really like to count indicators. It is clear that you are not counting complicated mathematics on the back end, but anyway, standard financial things are still calculated by yourself. There are no special difficulties with this, but it is interesting.
This is also a large amount of data, because it is rarely necessary to work in the backend with a hip of 150 gigabytes each, which should be put in bytes. These are performance pieces for optimizing computations. It is fascinating to dive into the mathematics of business, to the essence of the processes.
Models, data streams, jet streams, data styling processing. How to load a grid and calculate pre-aggregates of data in order not to load a terabyte of data from the database, and getting a accumulated pre-unit that is sent in one easy request is very interesting. You understand how everything works in a bank, why it is needed and what scale is behind all this.
Can a lone wolf trade without a bank and how to do it

— - , , , ?
, — . , - , - . , . , 4, .
, - . — . , .
, , . , .
— - - , ?
« ». — , — , .
- - , , - . , , .
, . , , . — . - , . , -.
, , . , , - ( -, - ).
— ?
. , . , , .
— , , , - . , — , .
. , : , - , .
, , - , , . , , , , — . , , , .
( , )
— , ? ?
, , Java. dependency injection, , , — , . , . . : , - .
It is very important to take care of multithreading, because you will run into performance problems. If you start to parallelize the calculations, it is important to understand what will set up barriers, how to do synchronization correctly, where happens-before will occur. It is necessary to decide in what order the calculations will be launched, how to use non-standard things for larger and more dense styling.
As you know, things like IntStream#distinct imply wrapping primitives into Java types and subsequently - the inverse operation. It seems not very scary, but on large amounts of data, massive boxing and anboxing will be noticeable, the memory will be used in vain. You need to understand the guts of Java itself, because on little things like boxing you can generate a bunch of additional allocations that you don’t need. And in order to notice this in time, you need to be able to use the tools to evaluate performance, collect metrics and understand other standard things.
- Do you need to know banking specifics?
No, in principle. We all understand that those people who know banking specifics are already working in banks. When you come from another sphere, you probably do not know it. At the very beginning, you can examine the documents on common points: what is futures, what is an option, how do they differ, what are the risks. And you just immerse yourself and begin to understand the business specifics.
But nevertheless, it is important. At first, you can simply implement functionality that is not tied to specific business specifics, but gradually you learn more complex and subject-specific things. What is here, what is at the previous place of work (when I, as the head of the department, hired employees) - you notice that if out of ten people at least one understands what futures are, this is already good.
If you have knowledge of algorithms, multithreading and Java in general, then it will not be difficult to study the business specifics. This is obtained when you immerse yourself in this environment, read documents and understand.
- How are you going to test such in-depth knowledge of Java at the interview? Is it all real?
It is clear that they probably will not check. But there are standard tasks for logic, algorithms, understanding of internal structures. This is a test task and whiteboard coding. For example, the task to implement the cache in the queue, which will give an understanding of whether the candidate understands the multithreading - races, deadlines and everything else. Along the way, you can ask questions about how much memory it consumes, why TreeMap, and not HashMap. Thus, solving one common problem, you can run through the moments from different specifics. Here, rather, the practice for which certain nuances are calculated.
- What do you think should be done to become a better programmer?
Develop! To code and look, what technologies and algorithms are, what new languages, to solve algorithmic tasks. In fact, much depends on experience. If you solved a lot of problems on algorithms, then you can find something similar from past problems in a new unfamiliar one. It is necessary to develop thinking, the ability to quickly find the answers. The ability to google and find solutions on StackOverflow is very useful. If you do not know something, but you know where to find it - this is the path to success.
Languages change, technologies and frameworks are transformed. New patterns come, but there are still some patterns that use everything. Java-conferences without reports about Reactive Streams and talk about Kotlin no longer pass. Sitting in a cocoon and not realizing that now event sourcing, in a sense, is gradually taking over the world - is strange.
It is necessary to turn out the background. For example, Knut's books are still relevant. Base plus new technology. And you need to know where and what to google.
- What was the last thing I understood myself?
In korutinah Kotlin. Cool, I like it. Both in syntax and in logic. I look at how to work in it with multithreading and asynchrony. Previously, Kotlin had to use very little. Now I am actively studying it, some projects are already exploiting it. He even has some small modules on sale.
')
Source: https://habr.com/ru/post/449630/
All Articles