How HPE SimpliVity 380 for VDI will work: hard load tests
The customer wanted VDI. I was looking very much at a bunch of SimpliVity + VDI Citrix Virtual Desktop. For all operators, office staff in cities and so on. There are five thousand users only in the first wave of migration, and therefore they insisted on load testing. VDI can start to slow down, it can safely lie down - and this does not always happen due to problems with the channel. We bought a very powerful testing package specifically for VDI and loaded the infrastructure until it went to disk and processor.
So, we need a plastic bottle, LoginVSI software for advanced VDI tests. We have it with licenses for 300 users. Then they took HPE SimpliVity 380 hardware in a package that is suitable for the task of maximal user density per server, cut virtual machines with a good oversubscription, put on them office software on Win10 and started testing.
')
Go!
System
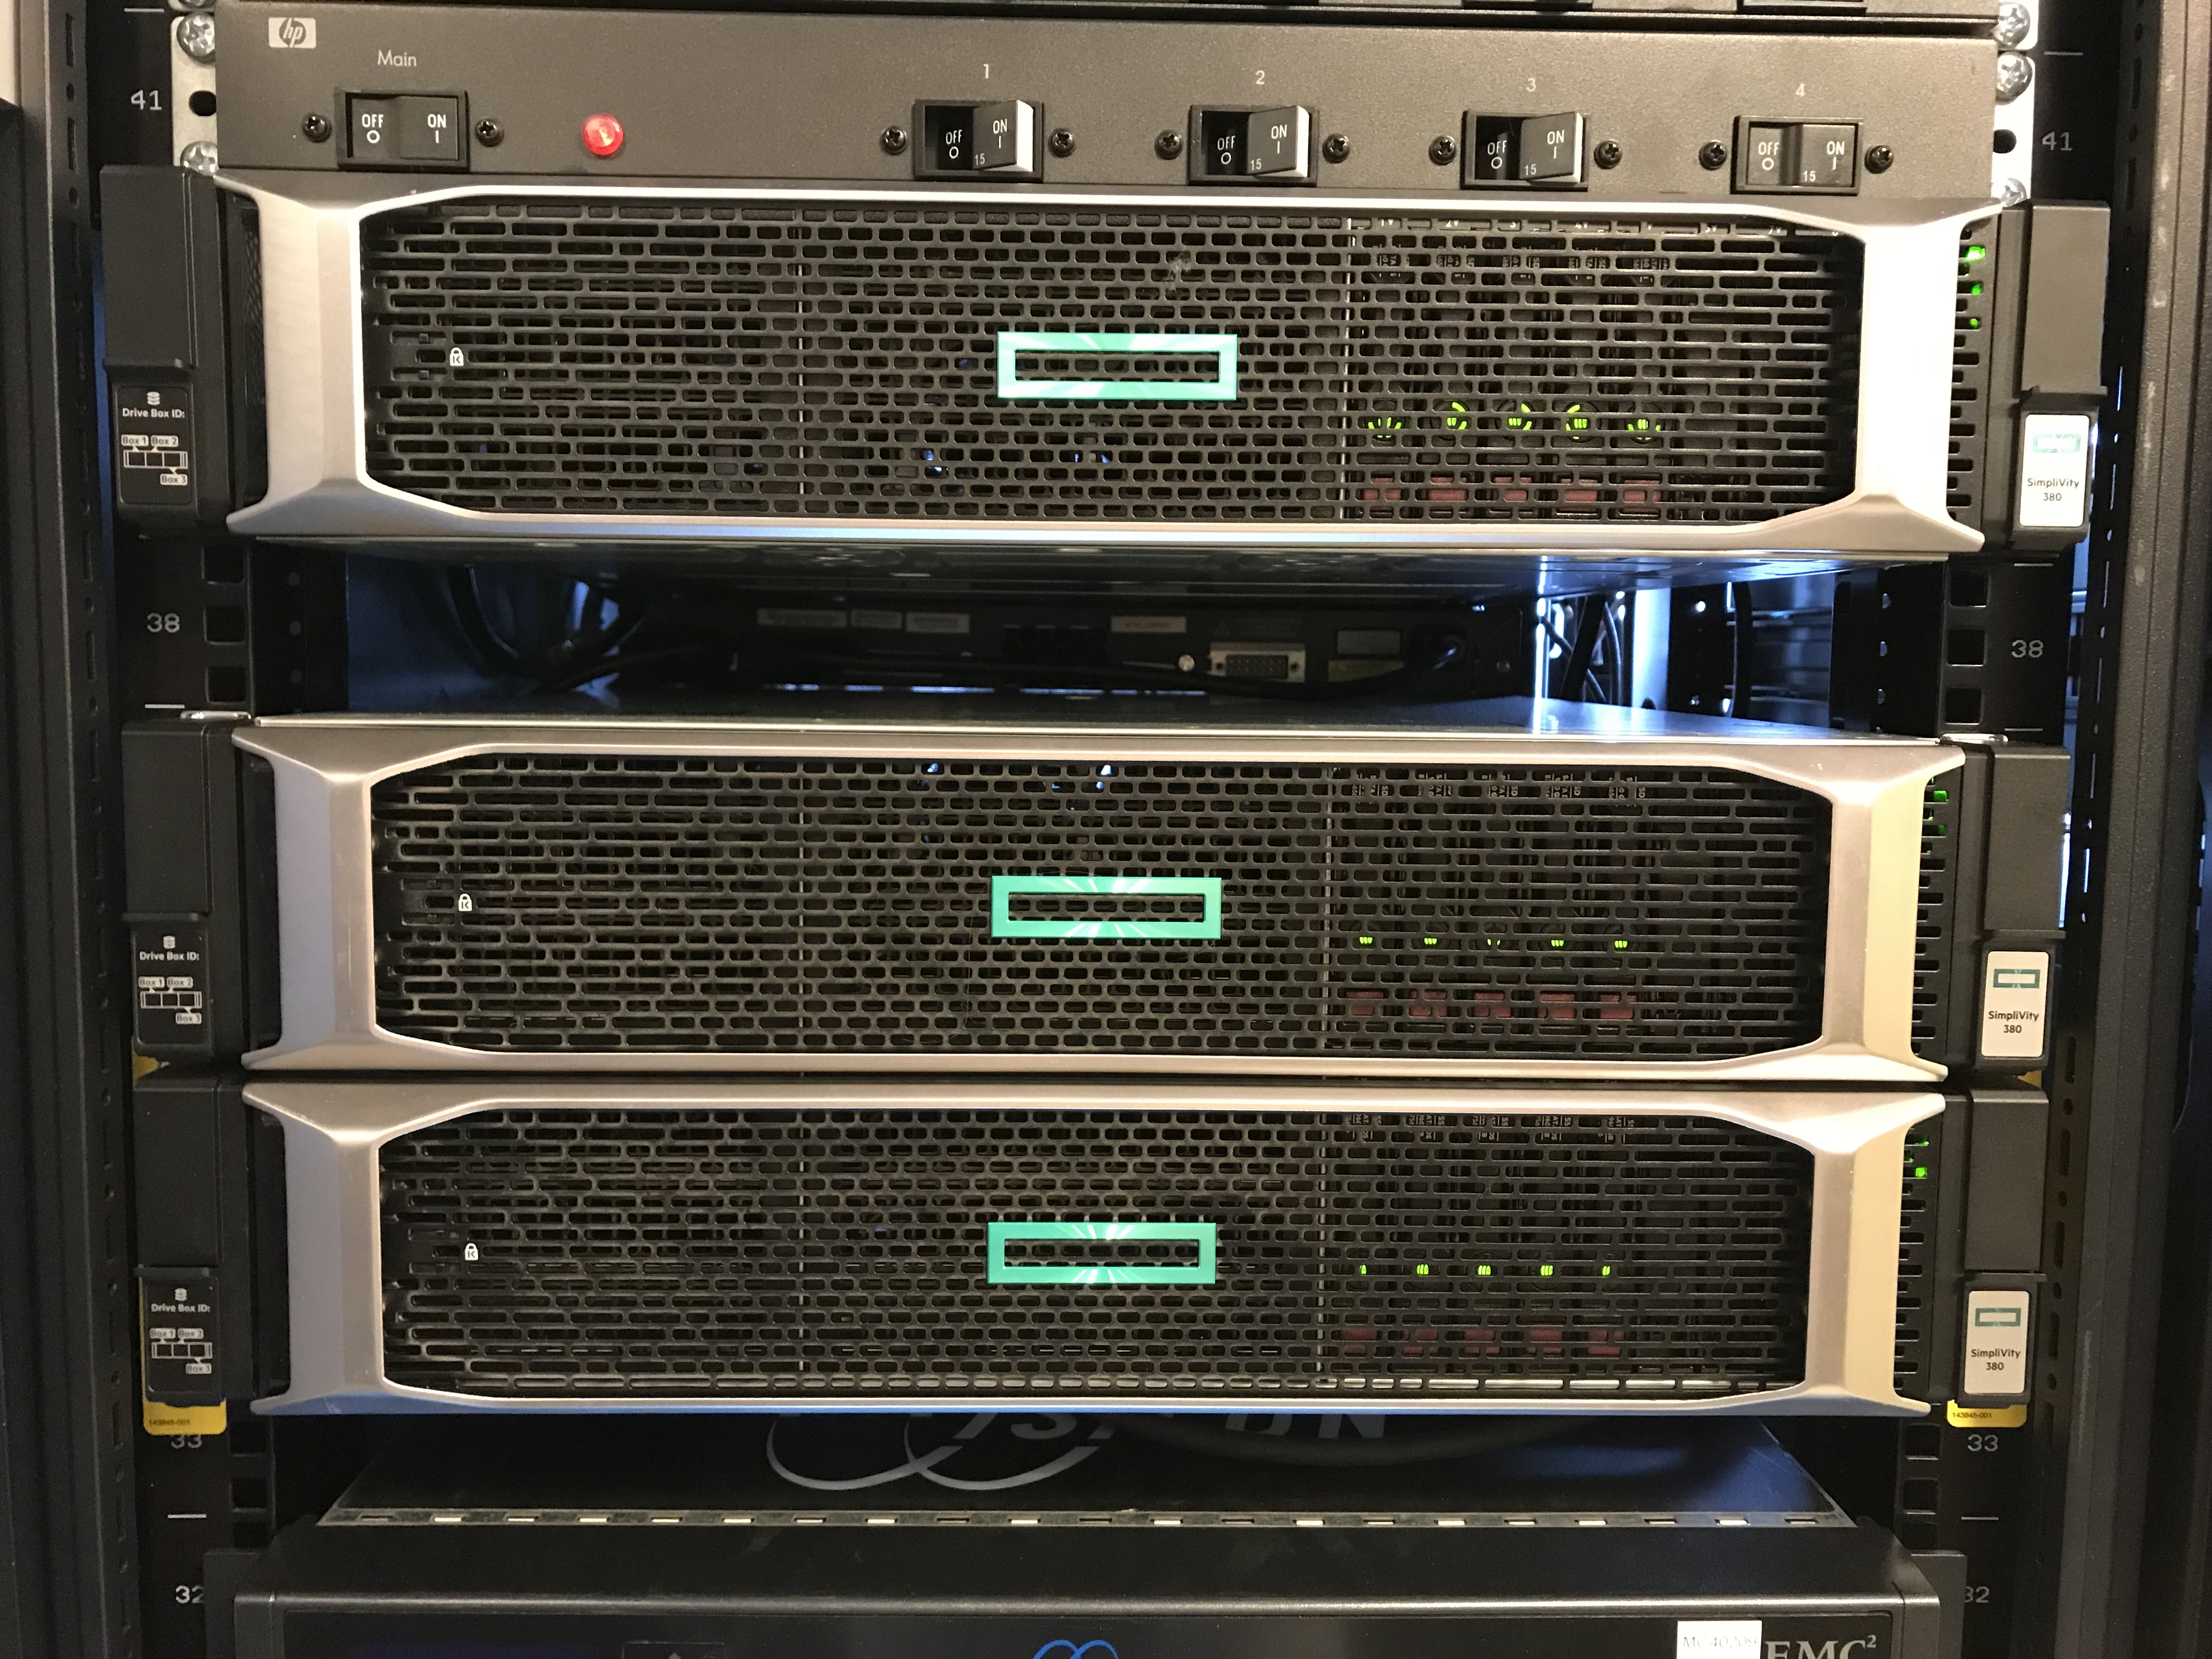
Two nodes (servers) HPE SimpliVity 380 Gen10. On each:
- 2 x Intel Xeon Platinum 8170 26c 2.1Ghz.
- RAM: 768GB, 12 x 64GB LRDIMMs DDR4 2666MHz.
- Main disk controller: HPE Smart Array P816i-a SR Gen10.
- Hard drives: 9 x 1.92 TB SATA 6Gb / s SSD (in the configuration RAID6 7 + 2, that is, this is the Medium model in terms of HPE SimpliVity).
- Network cards: 4 x 1Gb Eth (user data), 2 x 10Gb Eth (SimpliVity and vMotion backend).
- Special embedded FPGA cards in each node for deduplication / compression.
The nodes are interconnected by interconnect 10Gb Ethernet directly without an external switch, which is used as a SimpliVity backend and for transferring virtual machine data over NFS. Virtual machine data in a cluster is always mirrored between two nodes.
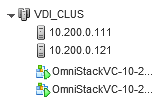
Nodes are clustered in a Vmware vSphere cluster running vCenter.
For testing, deployed a domain controller and Citrix connection broker. The domain controller, broker and vCenter are placed on a separate cluster.

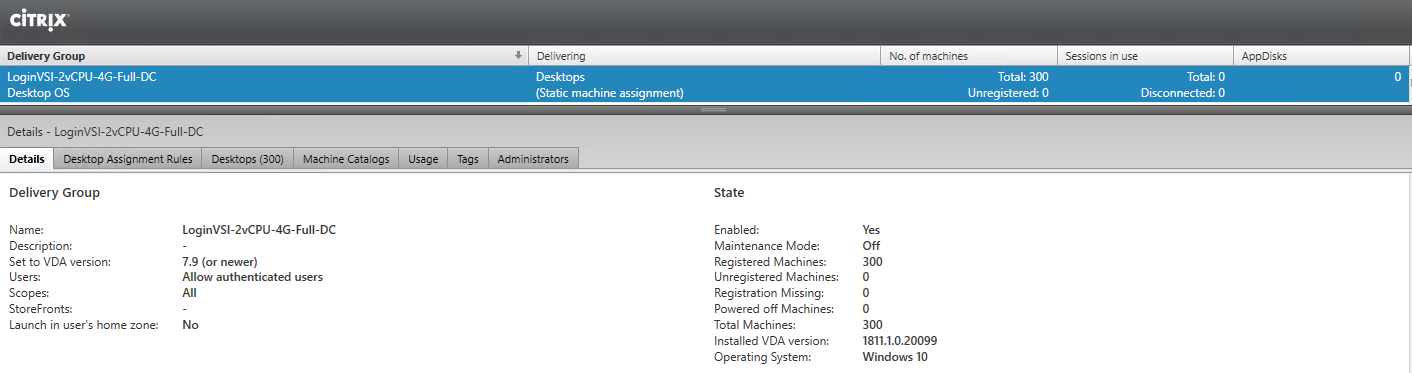
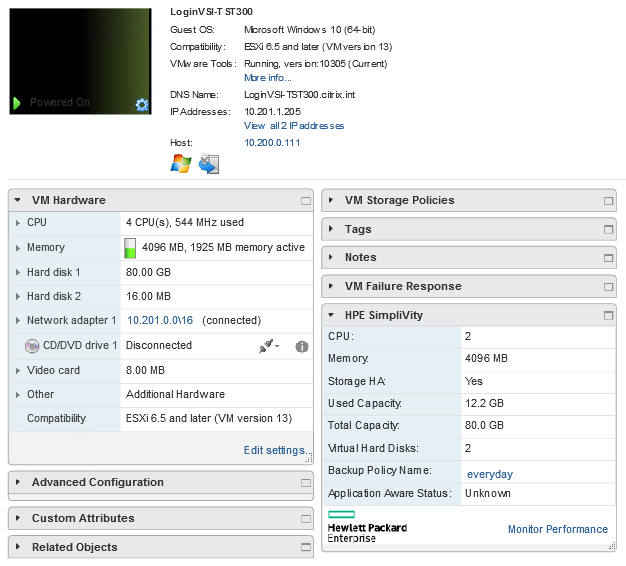
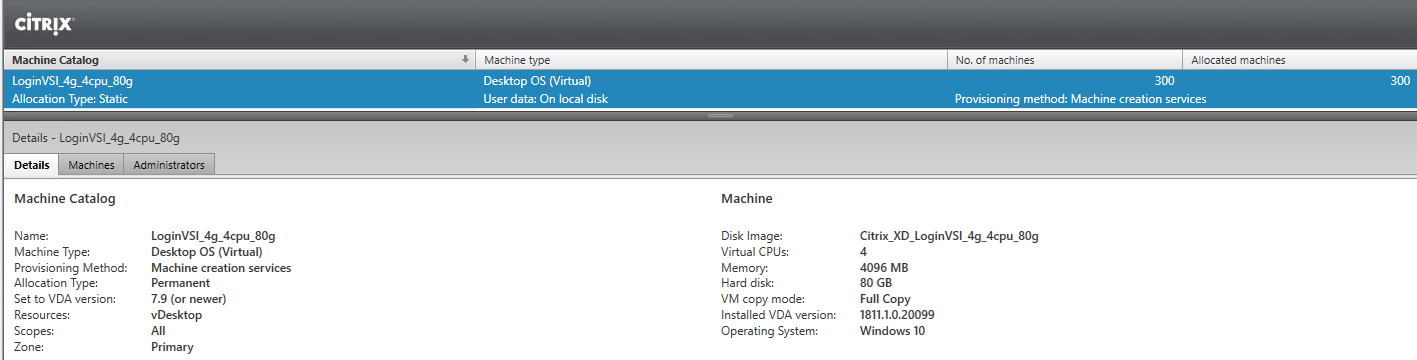
As a test infrastructure, 300 virtual desktops are deployed in a Dedicated - Full Copy configuration, that is, each desktop is a complete copy of the original virtual machine image and saves all changes made by users.
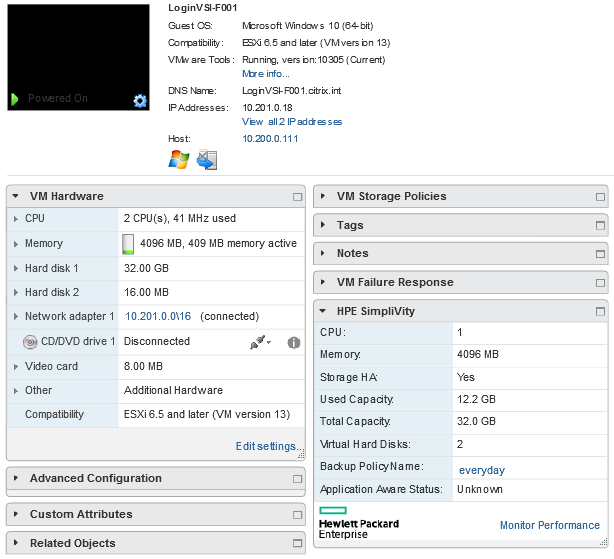
Each virtual machine has 2vCPU and 4GB RAM:
The following software required for testing was installed on the virtual machines:
- Windows 10 (64-bit), version 1809.
- Adobe Reader XI.
- Citrix Virtual Delivery Agent 1811.1.
- Doro PDF 1.82.
- Java 7 Update 13.
- Microsoft Office Professional Plus 2016.
Between nodes - synchronous replication. Each data block in a cluster has two copies. That is, now a complete set of data on each of the nodes. With a cluster of three or more nodes - copies of the blocks in two different places. When creating a new VM, an additional copy is created on one of the cluster nodes. When a single node fails, all VMs previously running on it are automatically restarted on other nodes, where they have replicas. If the node fails for a long time, then a gradual restoration of redundancy begins, and the cluster returns to the N + 1 reservation again.
Balancing and data storage occurs at the level of software storage of SimpliVity itself.
Virtual machines run a virtualization cluster, it also locates them in the software storage. The desktops themselves were taken according to a standard pattern: the tables of financiers and tellers stopped at the test (these are two different templates).
Testing
For testing, the LoginVSI 4.1 test software was used. The LoginVSI complex consisting of the management server and 12 machines for test connections were deployed on a separate physical host.
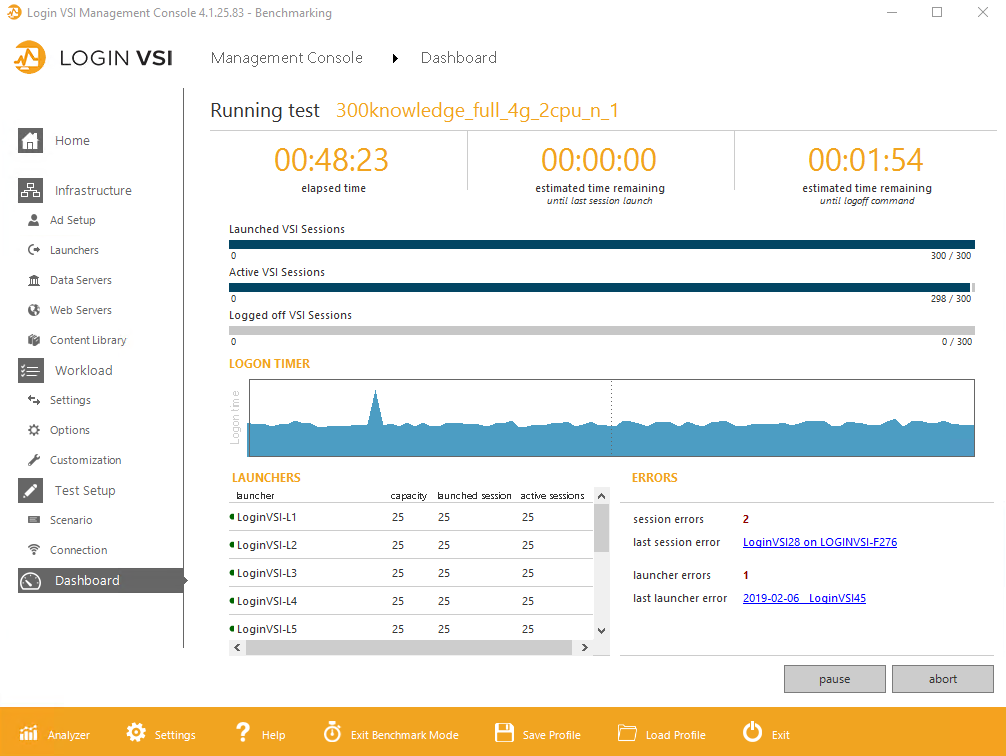
Testing was conducted in three modes:
Benchmark mode - load options for 300 Knowledge workers and 300 Storage workers.
Standard mode is a variant of the load of 300 Power workers.
To enable Power workers to work and increase the load diversity, a library of additional Power Library files was added to the LoginVSI complex. To ensure repeatability of results, all test bench settings were left Default.
Knowledge and Power workers tests imitate the real workload of users working on virtual workstations.
The Storage workers test is designed specifically for testing storage systems, is far from real workloads and for the most part consists of a user working with a large number of files of different sizes.
In the process of testing, users log into workstations within 48 minutes for approximately one user every 10 seconds.
results
The main result of the LoginVSI test is the VSImax metric, which is composed of the execution time of various tasks that are started by the user. For example: file opening time in notepad, file compression time in 7-Zip, etc.
A detailed description of the calculation of metrics is available in the official documentation at the link .
In other words, LoginVSI repeats a typical load pattern, simulating user actions in an office suite, reading a PDF, and so on, and measures various delays. There is a critical level of delays "everything slows down, it is impossible to work"), before reaching which it is considered that the maximum of users is not dialed. If the response time by 1,000 ms is faster than this “everything slows down” state, then it is considered that the system is working properly and you can add more users.
Here are the main metrics:
Metrics | Produced actions | Detailed description | Loadable components |
NSLD | Text opening time | Starts the notebook and | CPU and I / O |
Nfo | Opening time dialog | Opening the file VSI-Notepad [Ctrl + O] | CPU, RAM and I / O |
ZHC * | Time to create a zip file with strong compression | Local compression | CPU and I / O |
ZLC * | Time to create a zip file with weak compression | Local compression | I / o |
CPU | Calculating big | Creating a large array | CPU |
When testing is performed, the VSIbase base metric is initially calculated, which shows the speed at which tasks are completed without the system load. Based on this, the VSImax Threshold is determined, which is equal to VSIbase + 1,000ms.
Conclusions about system performance are made on the basis of two metrics: VSIbase, which determines the speed of the system, and VSImax threshold, which determines the maximum number of users that the system can withstand without significant degradation.
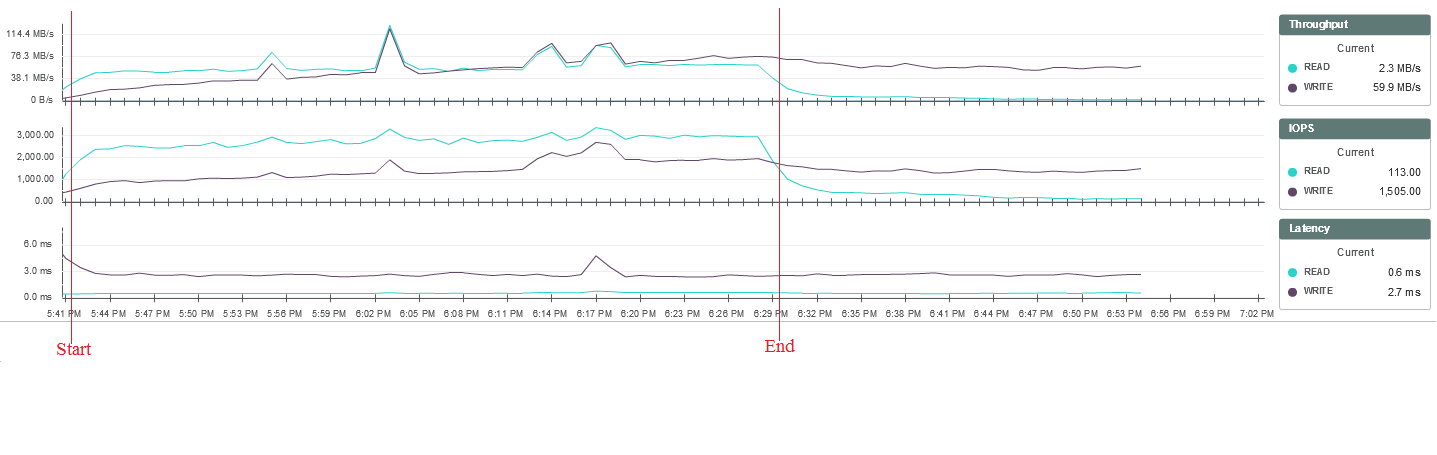
300 Knowledge workers benchmark
Knowledge workers are users who regularly load memory, processor, and IO with various small peaks. The software emulates the load from demanding office users, as if they are constantly poking at something (PDF, Java, office suite, photo viewing, 7-Zip). As users are added from zero to 300, the delay for each increases smoothly.
VSImax statistics data:
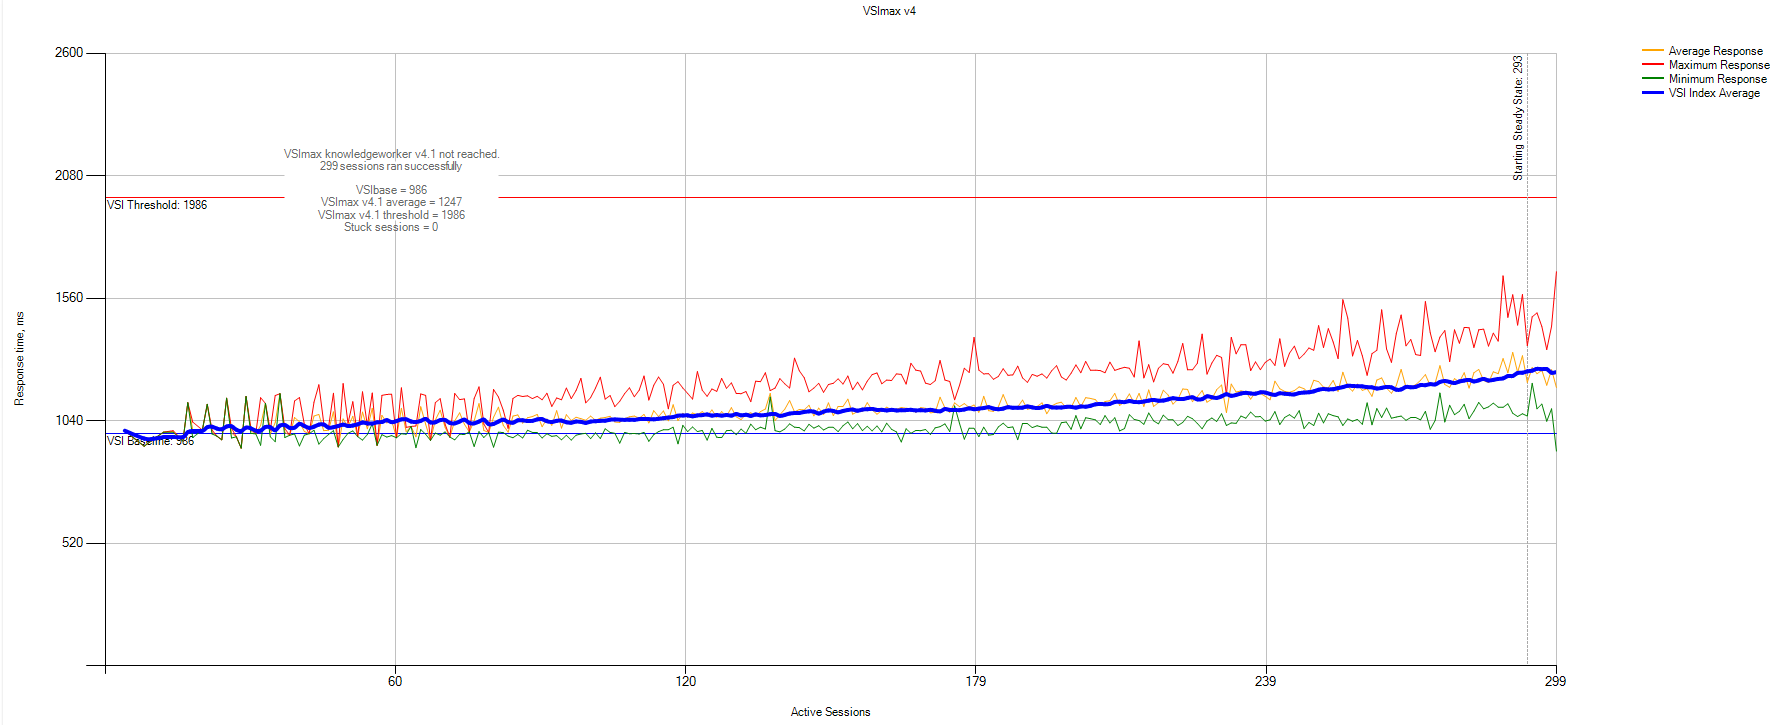
VSIbase = 986ms, VSI Threshold was not reached.
Statistics of the load on the storage system from monitoring SimpliVity:
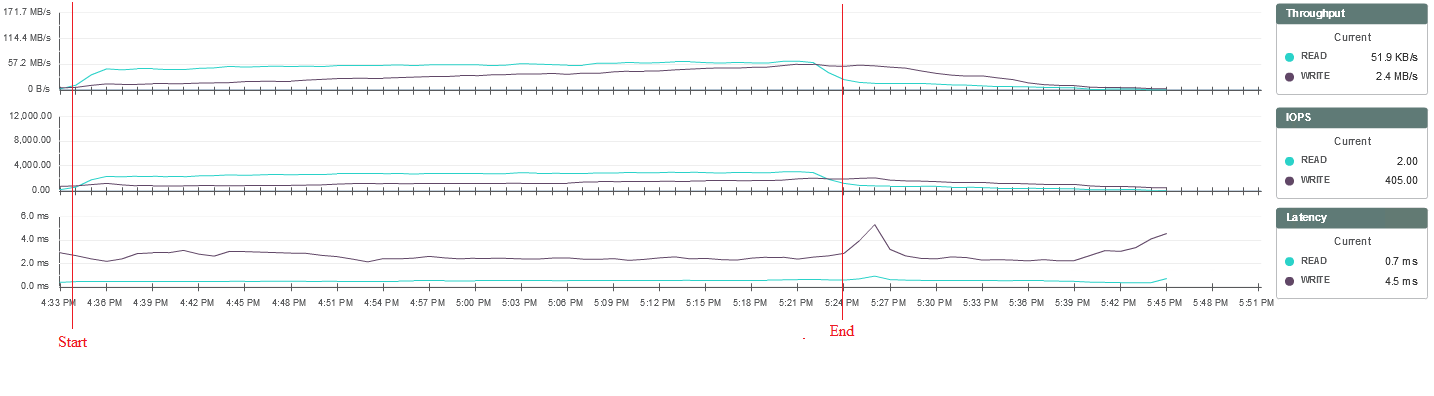
With this type of load, the system can withstand the increase in load almost without degradation of performance. The execution time of user tasks grows smoothly, the system response time does not change during testing and is up to 3 ms for writing and up to 1 ms for reading.
Conclusion: 300 knowledge users work without any problems on the current cluster and do not interfere with each other, reaching pCPU / vCPU 1 to 6 oversubscription. The total delays with the load increase evenly, but the conditioned limit was not reached.
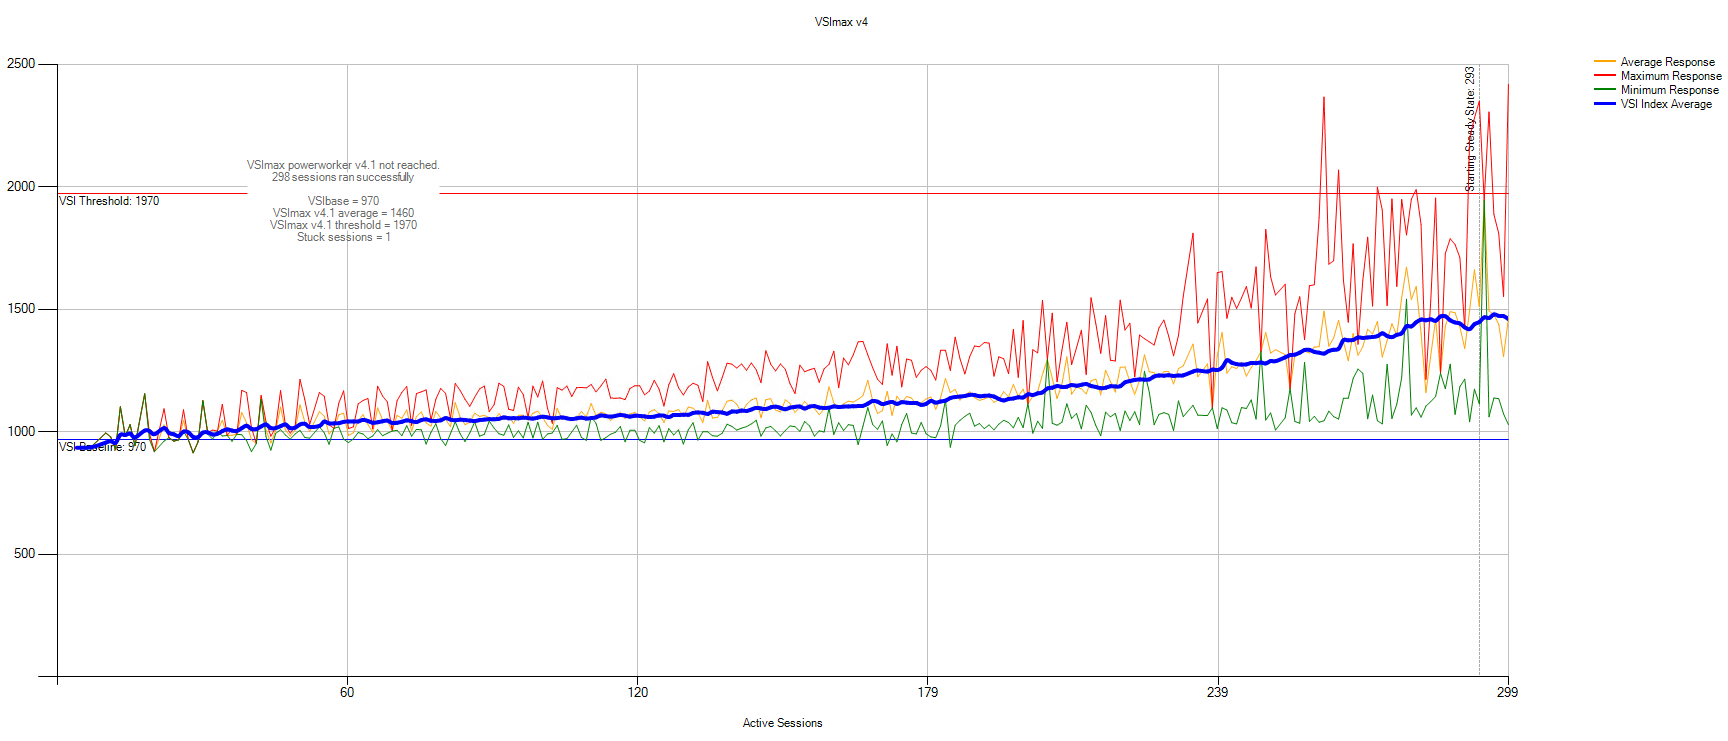
300 Storage workers benchmark
These are users who constantly write and read in the proportion of 30 to 70, respectively. This test was conducted rather for the sake of experiment. VSImax statistics data:
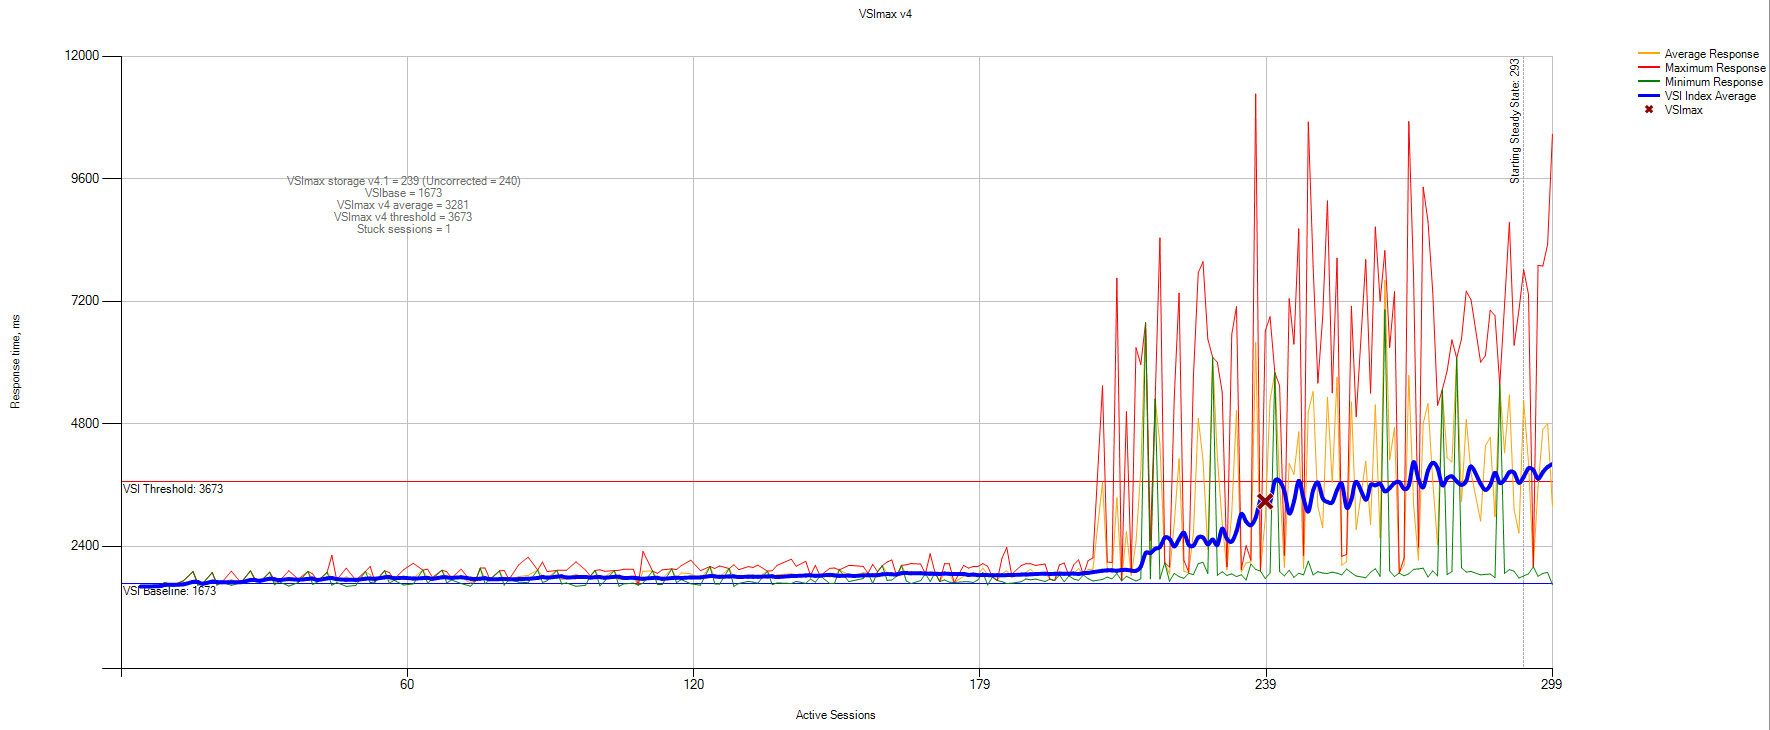
VSIbase = 1673, VSI Threshold reached on 240 users.
Statistics of the load on the storage system from monitoring SimpliVity:
This type of load is essentially a stress test of the storage system. When it is executed, each user writes to the disk a lot of random files of different sizes. In this case, it can be seen that if a certain load threshold is exceeded for a part of users, the time taken to write files increases. At the same time, the load on the storage system, the processor and the memory of the hosts does not change significantly, so it’s impossible to determine exactly what is causing the delays.
Conclusions about system performance using this test can only be made in comparison with the test results on other systems, since such loads are synthetic and unrealistic. However, in general, the test went well. Up to 210 sessions, everything went well, and then incomprehensible responses began, which were not monitored anywhere except Login VSI.
300 power workers
These are users who love processor, memory and high IO. These "advanced users" regularly run complex tasks with long peaks, such as installing new software and unpacking large archives. VSImax statistics data:
VSIbase = 970, VSI Threshold was not reached.
Statistics of the load on the storage system from monitoring SimpliVity:
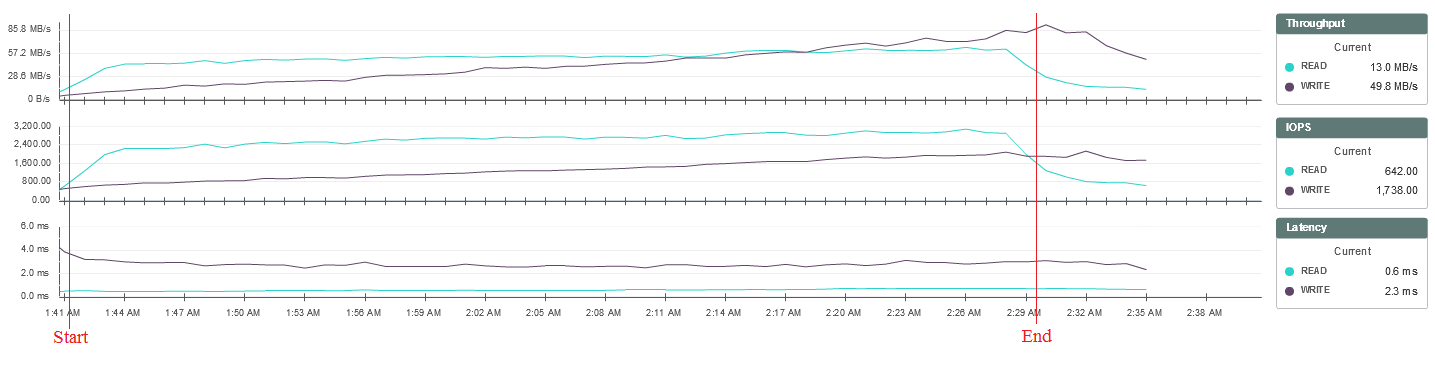
During testing, the processor load threshold was reached at one of the system nodes, but this did not have a significant impact on its operation:

In this case, the system can withstand the increase in load without significant degradation of performance. The execution time of user tasks grows smoothly, the system response time does not change during testing and is up to 3 ms for writing and up to 1 ms for reading.
The usual tests were not enough for the customer, and we went further: we increased the characteristics of the VM (the number of vCPUs to evaluate the oversubscription increase and the size of the disk) and added additional load.
When conducting additional tests, the following stand configuration was used:
Deployed 300 virtual desktops in 4vCPU configuration, 4GB RAM, 80GB HDD.
Configuration of one of the test machines:
The machines are deployed in the version Dedicated - Full Copy:

300 Knowledge workers benchmark with oversubscription 12
VSImax statistics data:

VSIbase = 921 ms, VSI Threshold was not reached.
Statistics of the load on the storage system from monitoring SimpliVity:
The results obtained are similar to testing the previous VM configuration.
300 Power workers with oversubscription 12
VSImax statistics data:
VSIbase = 933, VSI Threshold was not reached.
Statistics of the load on the storage system from monitoring SimpliVity:

With this testing, the processor load threshold was also reached, but this did not have a significant impact on performance:


The results obtained are similar to testing the previous configuration.
What happens if you run the load for 10 hours?
Now we are looking at whether there will be an “accumulation effect”, and let us run tests for 10 hours in a row.
Long tests and the description of the section should be aimed at what we wanted to check whether there will be any problems with the farm with a long load on it.
300 Knowledge workers benchmark + 10 hours
Additionally, testing of the load of 300 knowledge workers was carried out with the subsequent work of users for 10 hours.
VSImax statistics data:
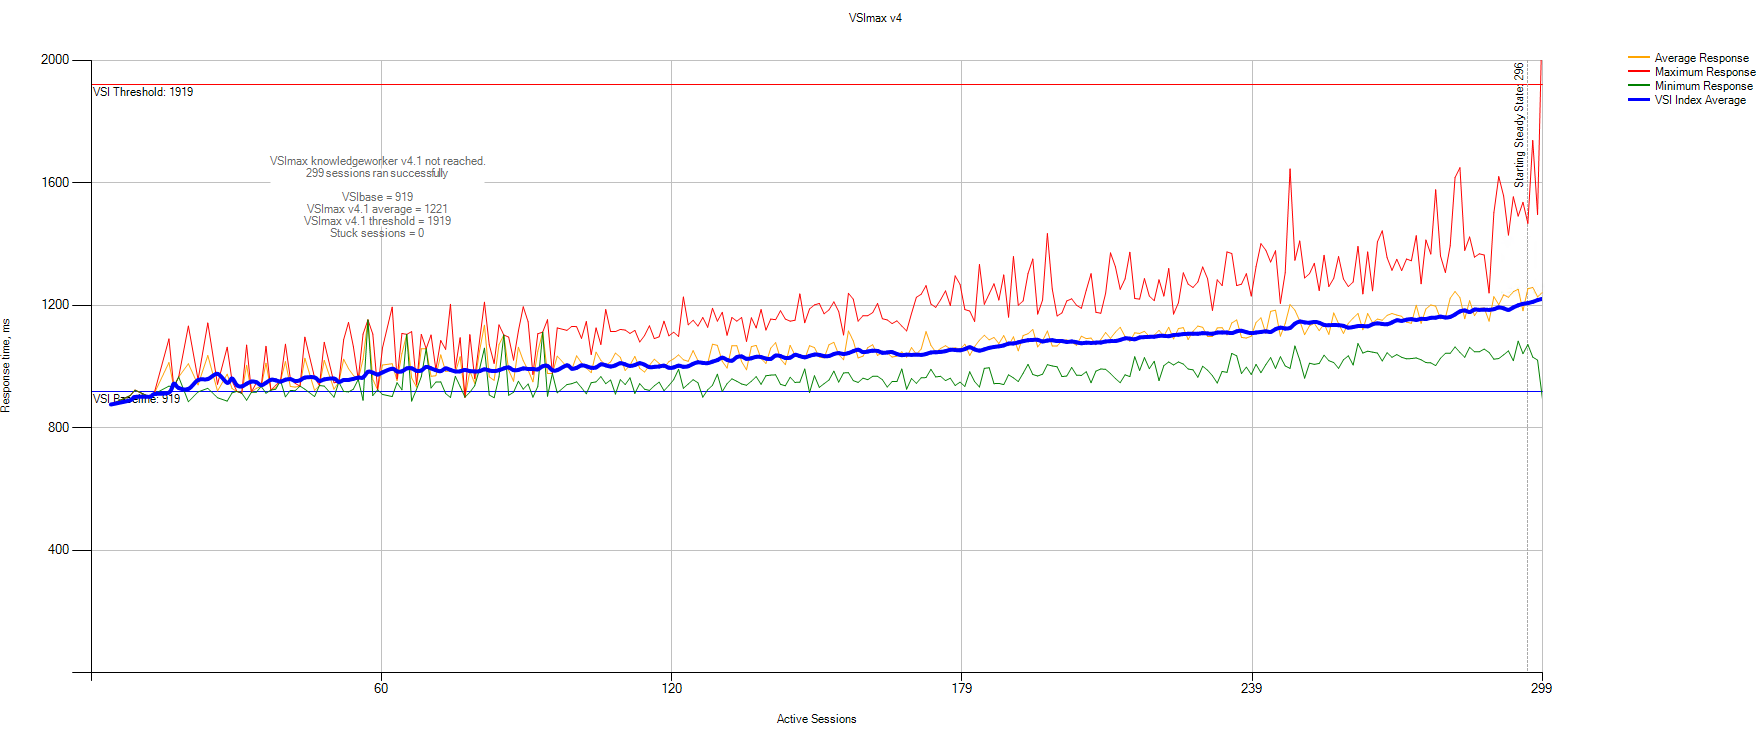
VSIbase = 919 ms, VSI Threshold was not reached.
Statistics VSImax Detailed:
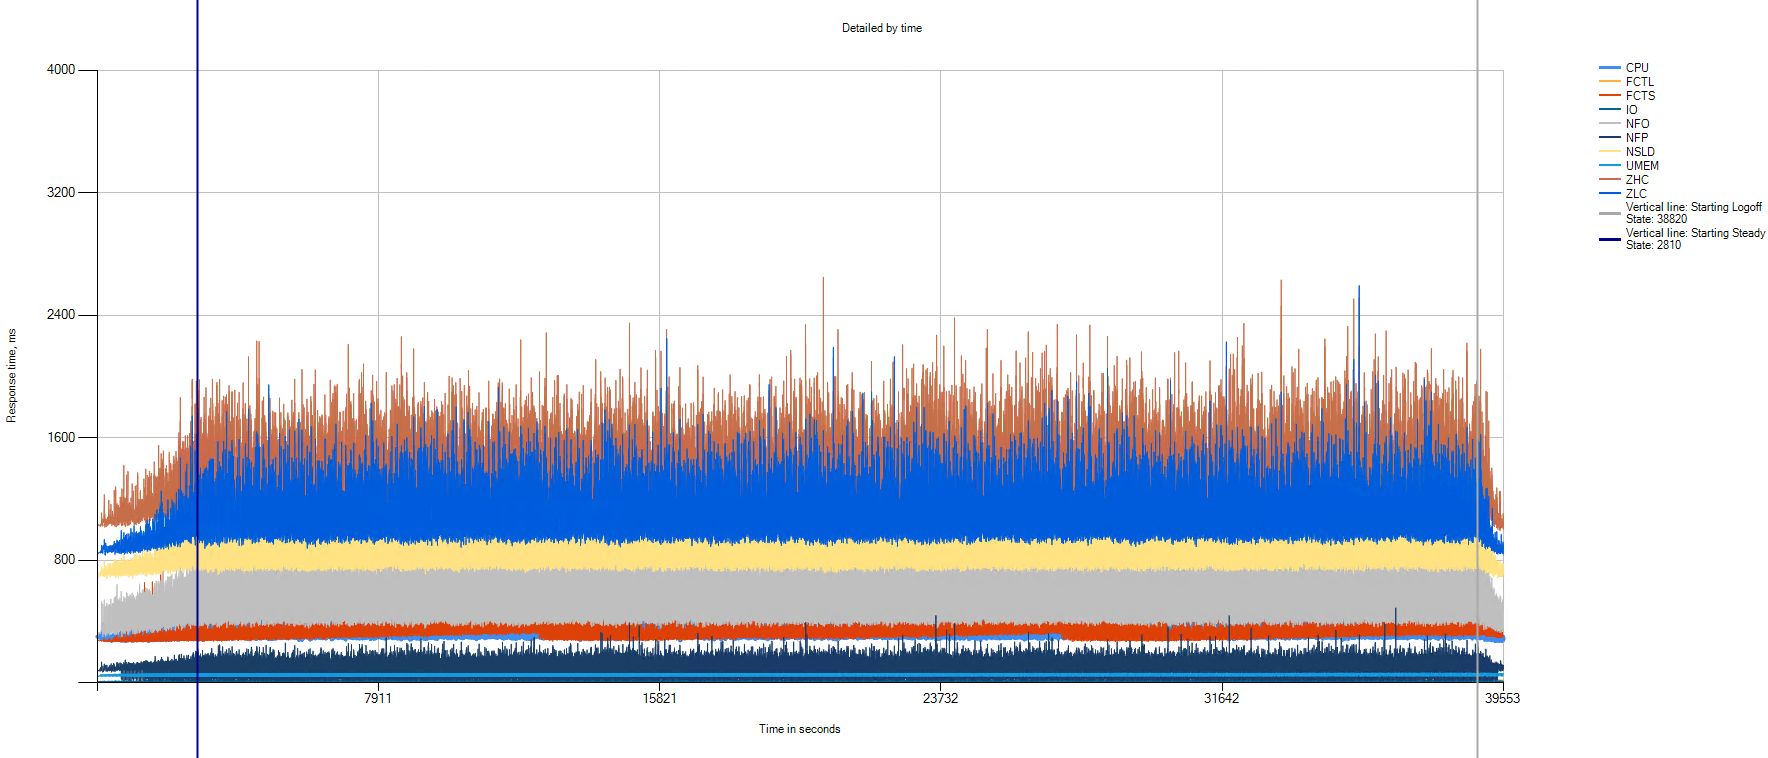
The graph shows that no degradation of performance was observed during the whole test.
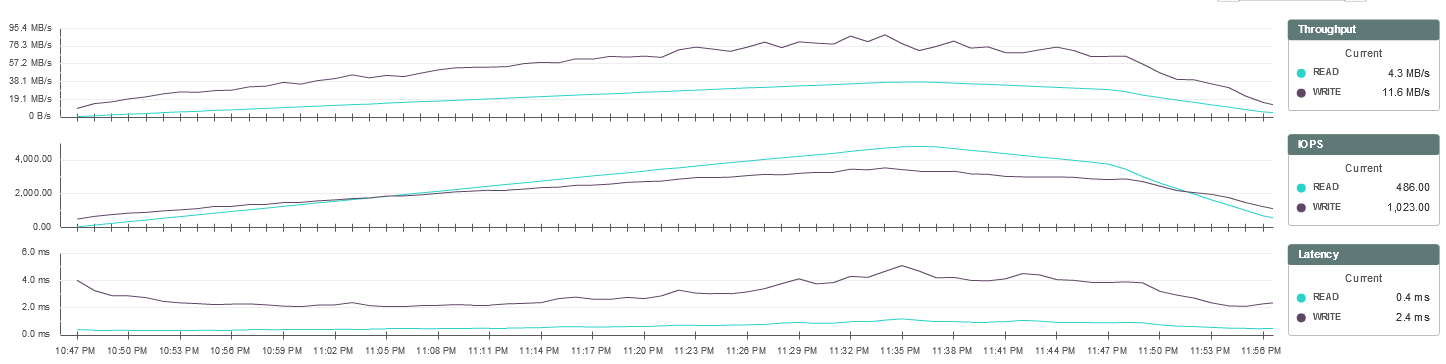
Statistics of the load on the storage system from monitoring SimpliVity:

The performance of the storage system remains at the same level throughout the test.
Additional testing with the addition of synthetic load
The customer asked to add wild load to the disk. To do this, a task was added to the storage system in each of the users' virtual machines to run the synthetic load on the disk when the user logs on. The load was provided by the fio utility, which allows you to limit the load on the disk by the number of IOPS. In each machine, a task was launched to launch an additional load in the amount of 22 IOPS 70% / 30% Random Read / Write.
300 Knowledge workers benchmark + 22 IOPS per user
During initial testing, it was discovered that fio creates a significant additional load on the processor of virtual machines. This led to a rapid overload of hosts on the CPU and greatly affected the operation of the system as a whole.
The load on the CPU hosts:


The storage latency also naturally increased:
The lack of computing power has become critical to about 240 users:
Due to the obtained results, it was decided to conduct a test, less loading CPU.
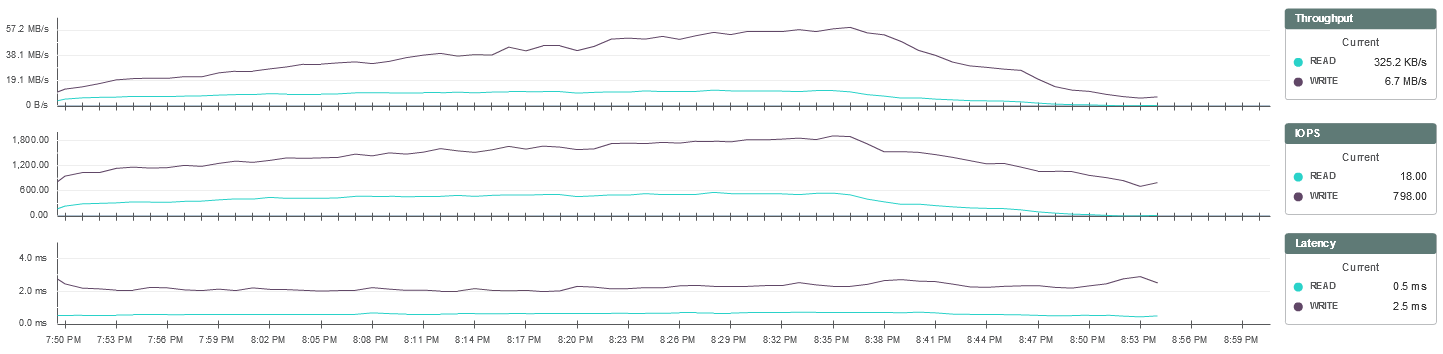
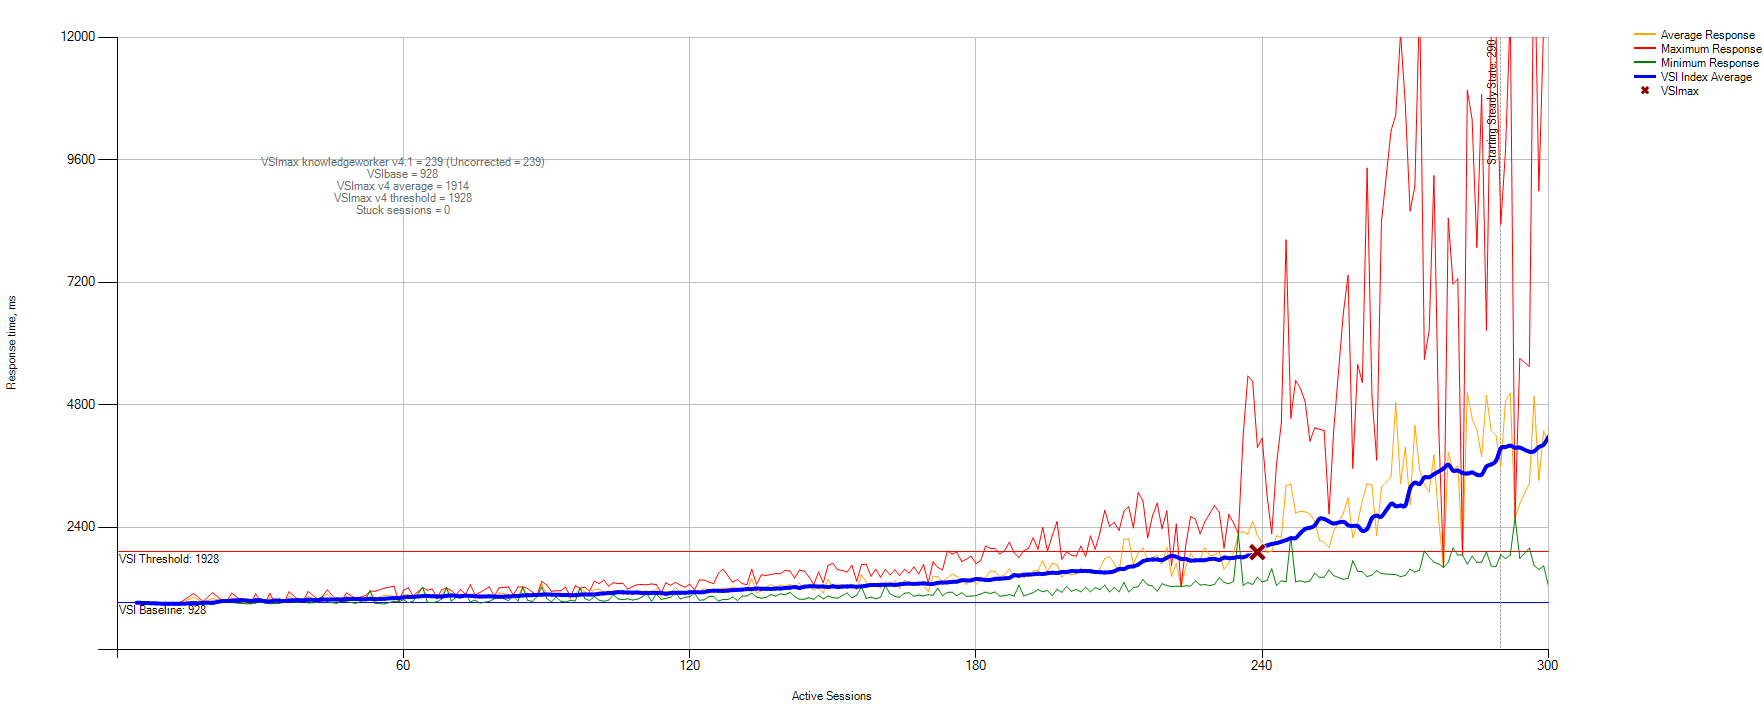
230 Office workers benchmark + 22 IOPS per user
To reduce the load on the CPU, the type of workload of Office workers was selected, and 22 IOPS synthetic loads were also added to each session.
The test was limited to 230 sessions in order not to exceed the maximum CPU load.
The test was launched with the subsequent work of users for 10 hours to check the stability of the system during long-term work at a load close to the maximum.
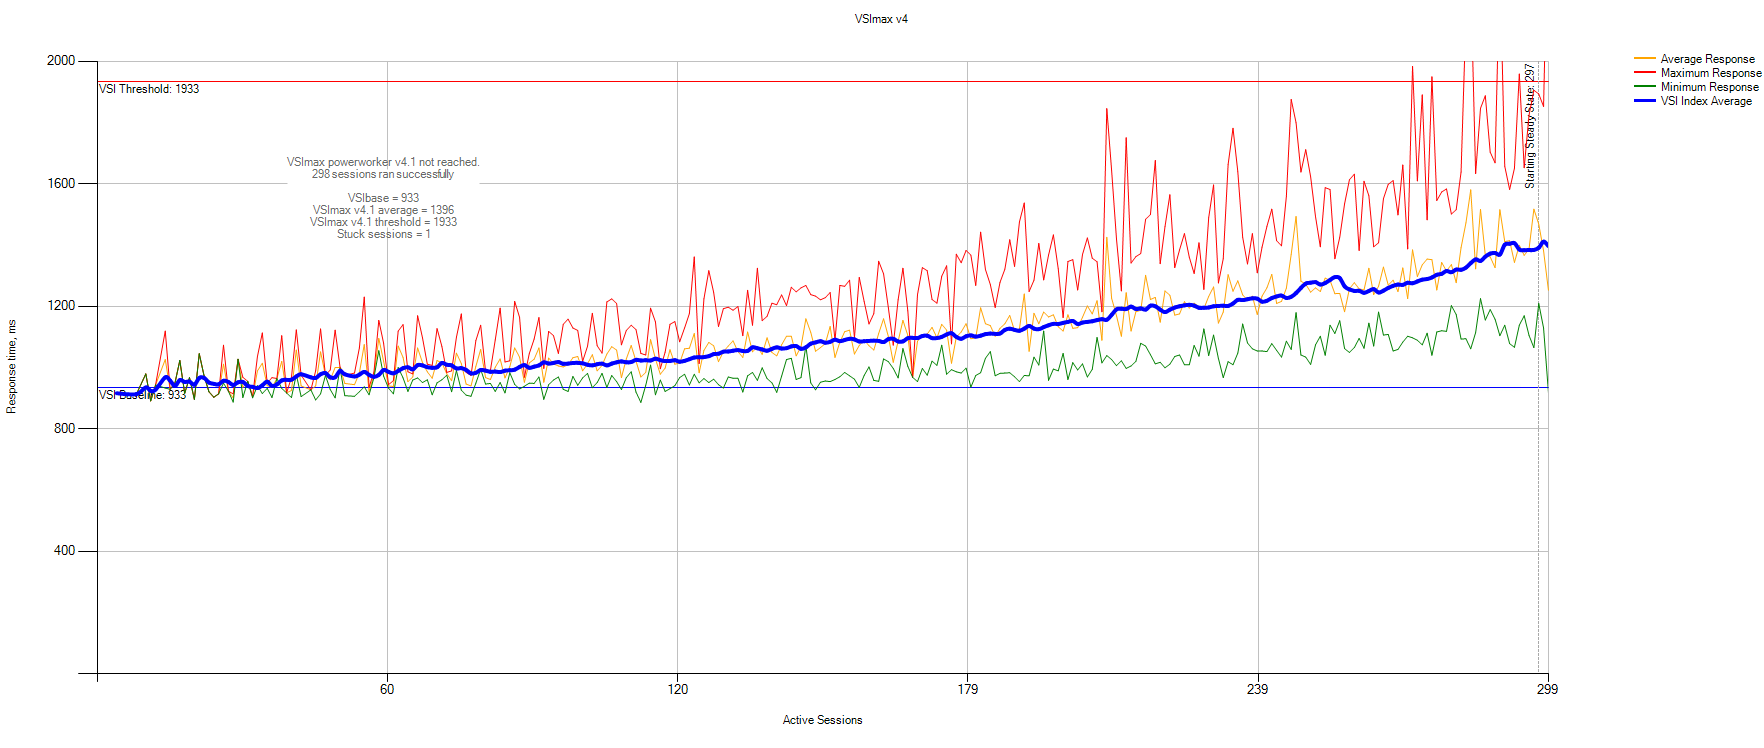
VSImax statistics data:
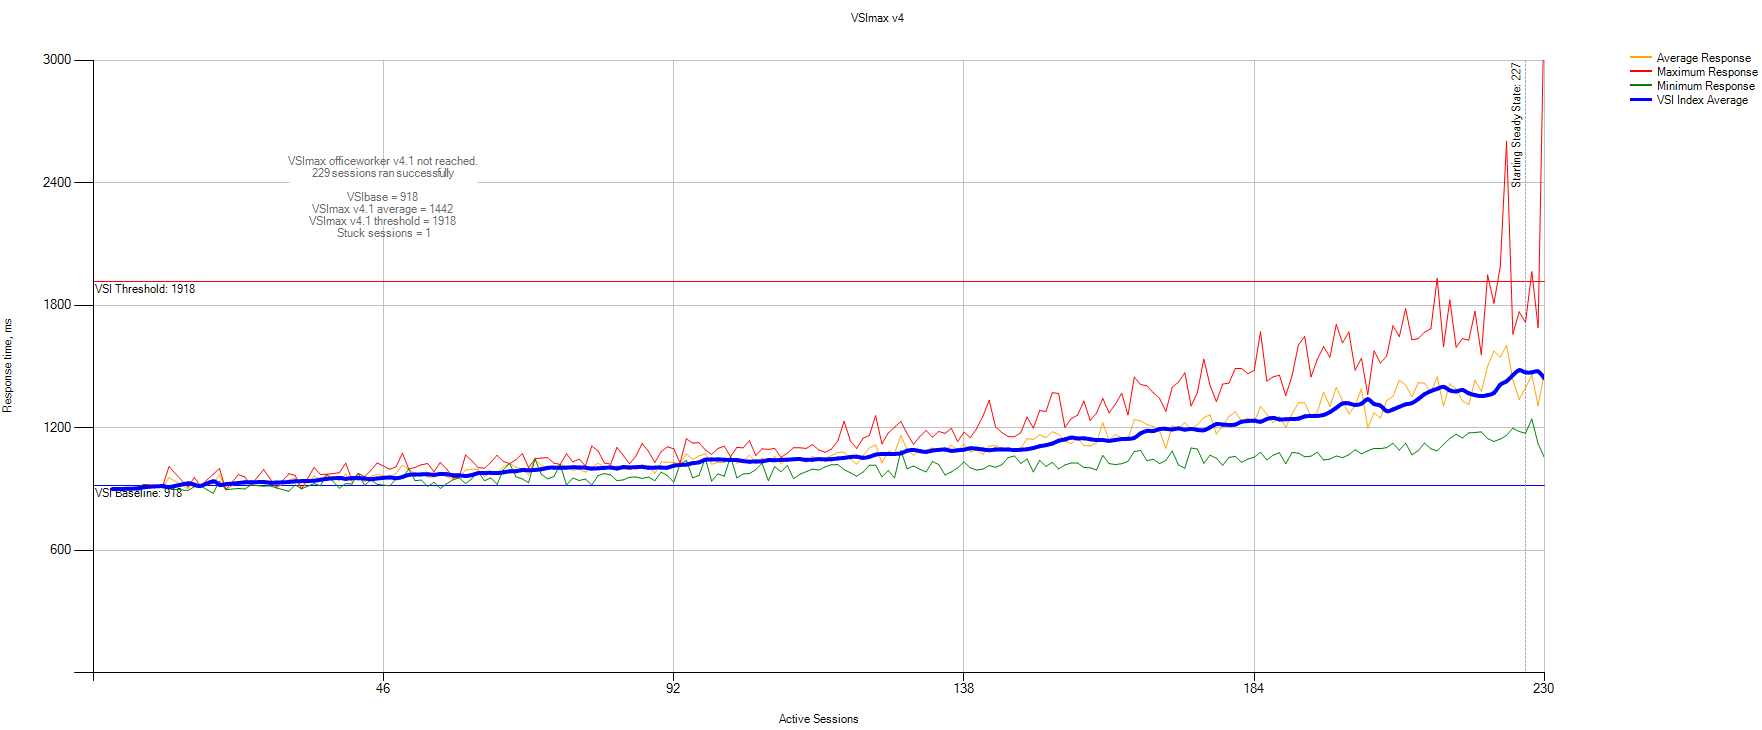
VSIbase = 918 ms, VSI Threshold was not reached.
Statistics VSImax Detailed:
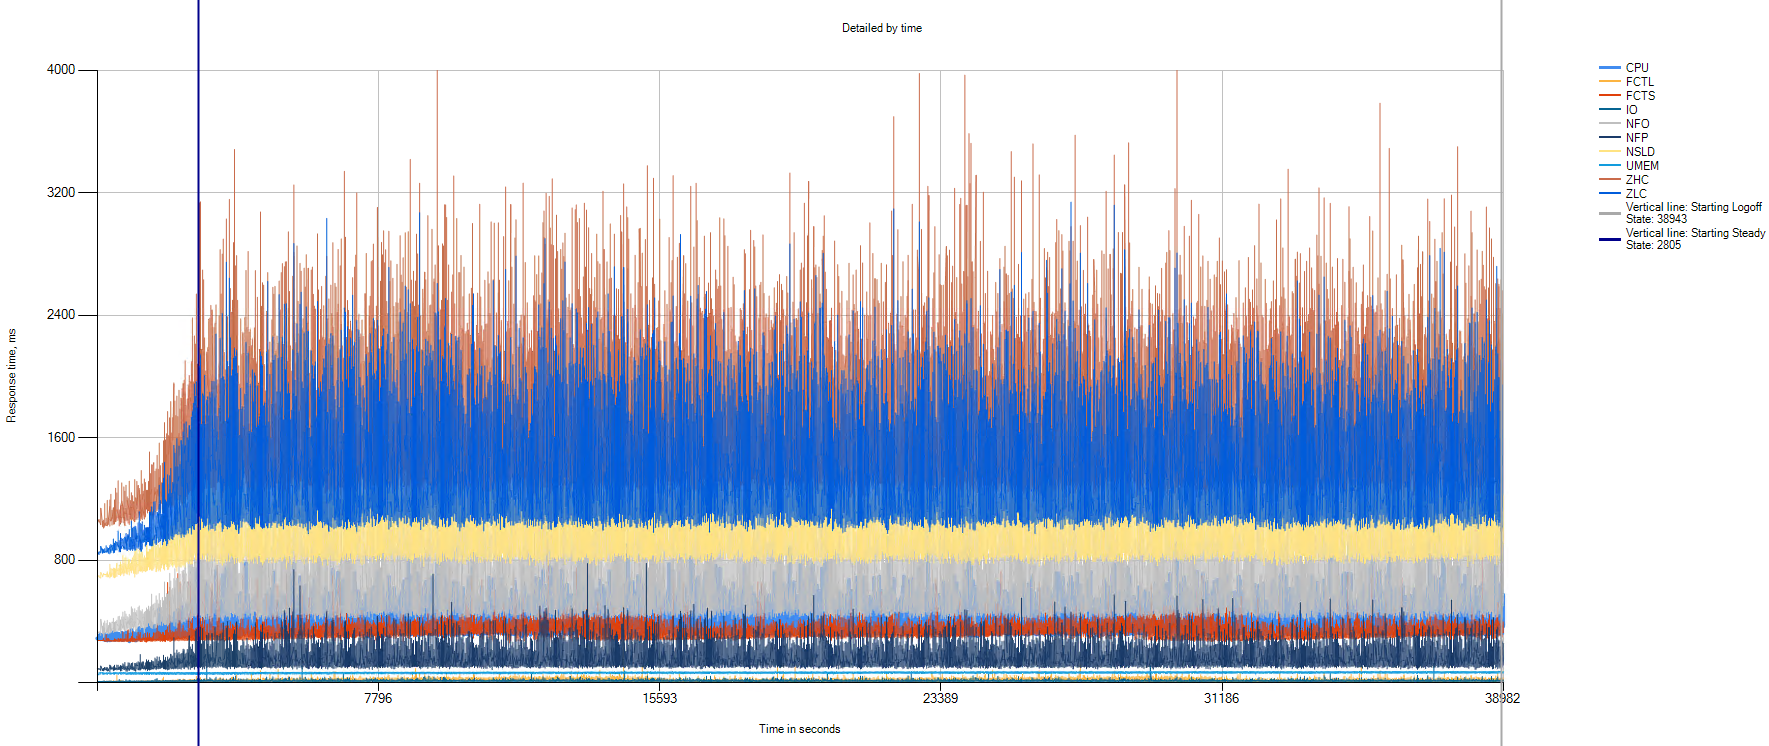
The graph shows that no degradation of performance was observed during the whole test.
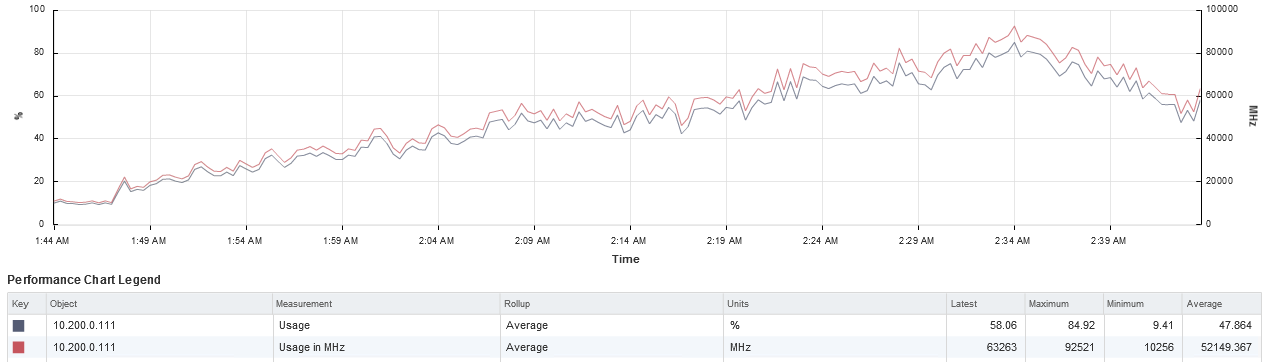
CPU load statistics:
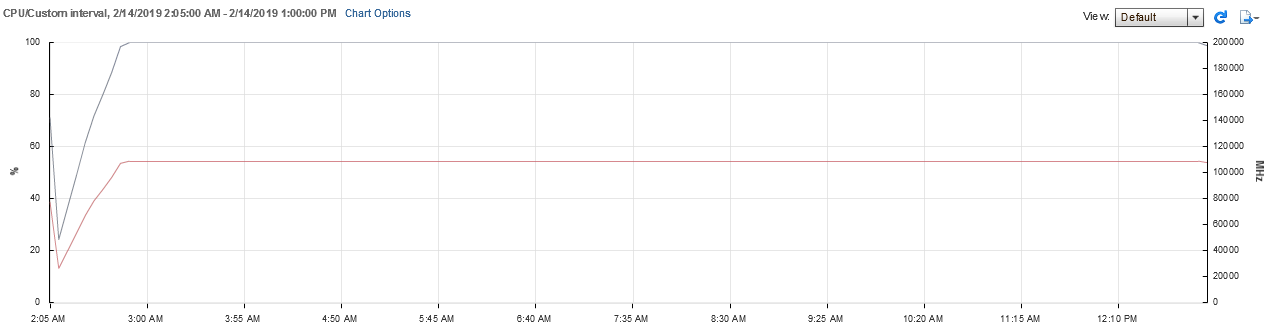
When performing this test, the CPU load on the hosts was almost maximum.
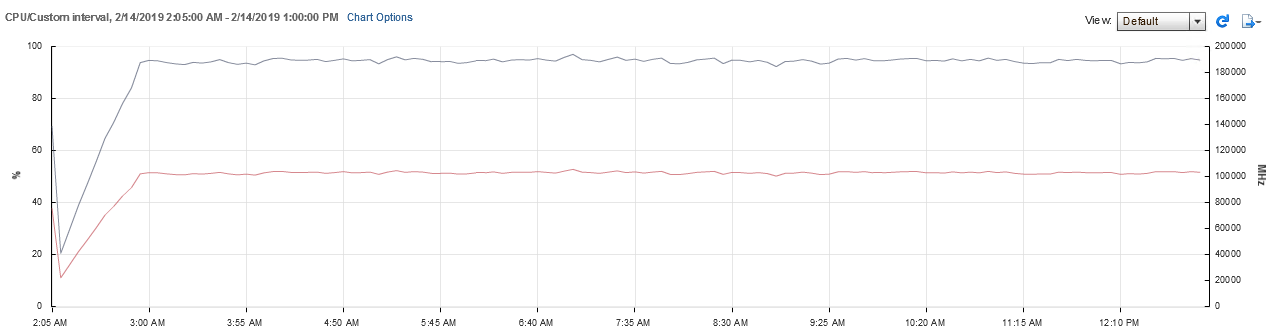
Statistics of the load on the storage system from monitoring SimpliVity:

The performance of the storage system remains at the same level throughout the test.
The load on the storage system during the test was approximately 6,500 IOPS at a ratio of 60/40 (3,900 IOPS - per read, 2,600 IOPS - per write), which is approximately 28 IOPS per work station.
The average response time was 3 ms per write and up to 1 ms per read.
Total
When modeling the real loads on the HPE SimpliVity infrastructure, the results were obtained, confirming the ability of the system to provide virtual desktops of at least 300 Full Clone-machines on a pair of SimpliVity nodes. At the same time, the response time of the storage system was maintained at an optimal level throughout the entire test period.
We are very impressed with the approach about long-term tests and comparison of solutions before implementation. We can test the performance for your loads if you want. Including other hyperconvergent solutions. The said customer is now completing tests on another solution in parallel. Its current infrastructure is just a PC park, domain and software at every workplace. Moving to VDI without tests is, of course, quite difficult. It is particularly difficult to understand the real possibilities of the VDI farm without migrating real users to it. And these tests allow you to quickly assess the real capabilities of a system without the need to attract ordinary users. This is where the study came from.
The second important approach - the customer immediately laid down on the correct scaling. Here you can buy a server and add a farm, for example, per 100 users, everything is predictable at the price of the user. For example, when they need to add 300 more users, they will know that they need two servers in an already defined configuration, and not to reconsider the possibilities of upgrading their infrastructure as a whole.
The possibilities of the HPE SimpliVity federation are interesting. Business is geographically separated, so it makes sense to put your separate VDI hardware in the far office. In SimpliVity federation, each virtual machine is replicated according to a schedule with the ability to do between geographically distant clusters very quickly and without load on the channel - this is a built-in backup of a very good level. When a VM is replicated between sites, the channel is activated as minimally as possible, and this makes it possible to build very interesting DR architectures with a single control center and a heap of decentralized storage sites.
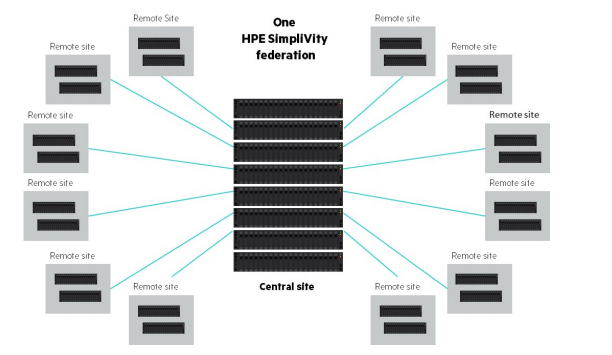
Federation
All this together makes it possible to evaluate the financial side in great detail and impose VDI costs on the company's growth plans, and understand how quickly the solution will pay for itself and how it will work. Because any VDI is a solution that ultimately saves a lot of resources, but at the same time, most likely, without a cost-effective opportunity to change it within 5-7 years of use.
In general, if there are questions not for comments, write to me at mk@croc.ru.
Source: https://habr.com/ru/post/449210/
All Articles