How we consider the metrics of development and support of documentation. Yandex report
In the first part of the report, we outlined in general terms how we measure the quality of documentation and the effectiveness of its development. Now dive into the details of counting metrics.
Yury Nikulin, head of technical documentation development, tells.
First, let's define what performance is. In the classical sense, this is the time to produce a unit of production or the quantity of products produced per unit of time .
For example, this is the number of phones produced per month or the amount of time to produce thousands of phones. The question arises how to measure the intellectual work that our department does.
If we use the classical approach to performance evaluation, we can calculate how many documents, pages or words are written per day, week and month. This will help assess the potential time to produce documentation in the future, but will not answer the question about performance. After all, we are not exactly interested in evaluating the effectiveness of writers by the number of written words. Therefore, we decided that we should start with the requirements for metrics that we planned to calculate.
We have identified several criteria for the selection of metrics:
- Transparency. The approach to calculating metrics and interpreting the results should be clear not only to us, but also to customers.
- Data availability Including data for some past period, to put forward hypotheses and try to confirm them with historical data.
- Ability to automate counting. We definitely do not want to count metrics by hand.
As a result, we realized that the ideal object for calculating performance metrics is the task in the Tracker. It meets all the requirements that we imposed on metrics.
The source of data for us was Yandex.Tracker. It is quite flexible and easily customized for our tasks. It already has all the necessary data, because we use this tool every day. Tracker also has an API, which means you can use this information and automate processes.
So we had a plan for how to proceed.
We configure queues and tasks
You need to start with the choice of queues, hierarchy of tasks, their types and statuses.
Katya Kunenko described this in detail in the report “ Tools for the preparation of user documentation ”. We briefly describe the organization of queues and tasks that we use ourselves.
Queues
We have three lines that essentially reflect our target audience.

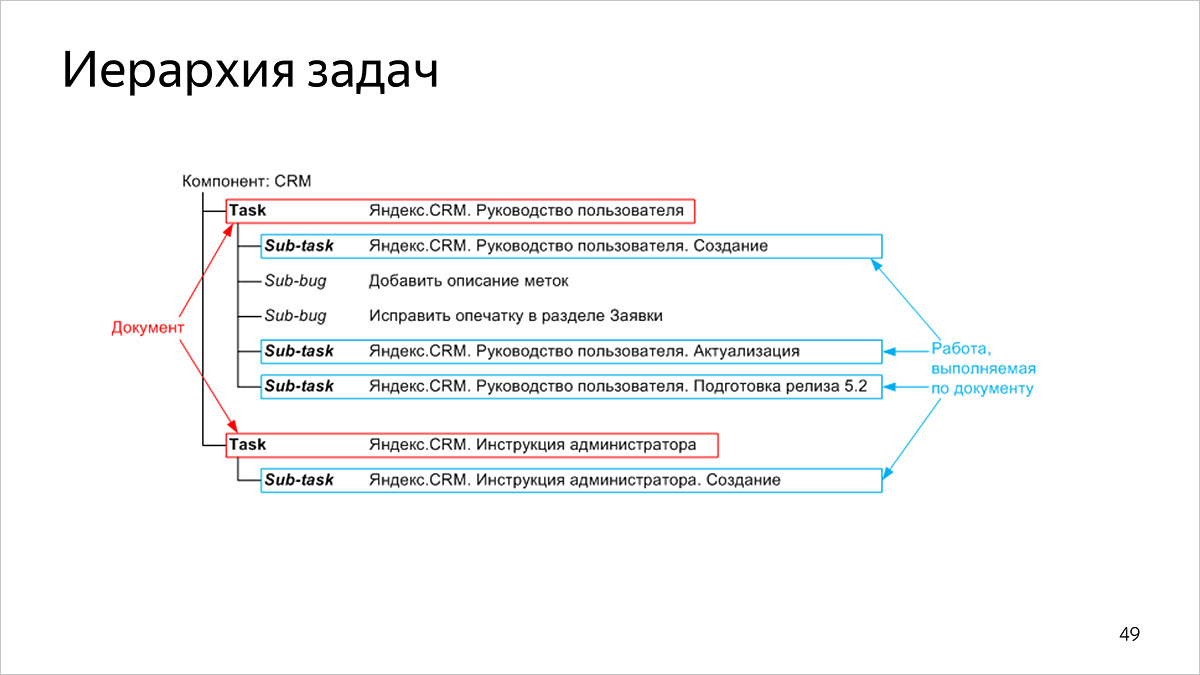
Task hierarchy
Our tasks have a two-level structure:
- at the top level, tasks correspond to published documents,
- at the lower level, the tasks correspond to the work on the document.
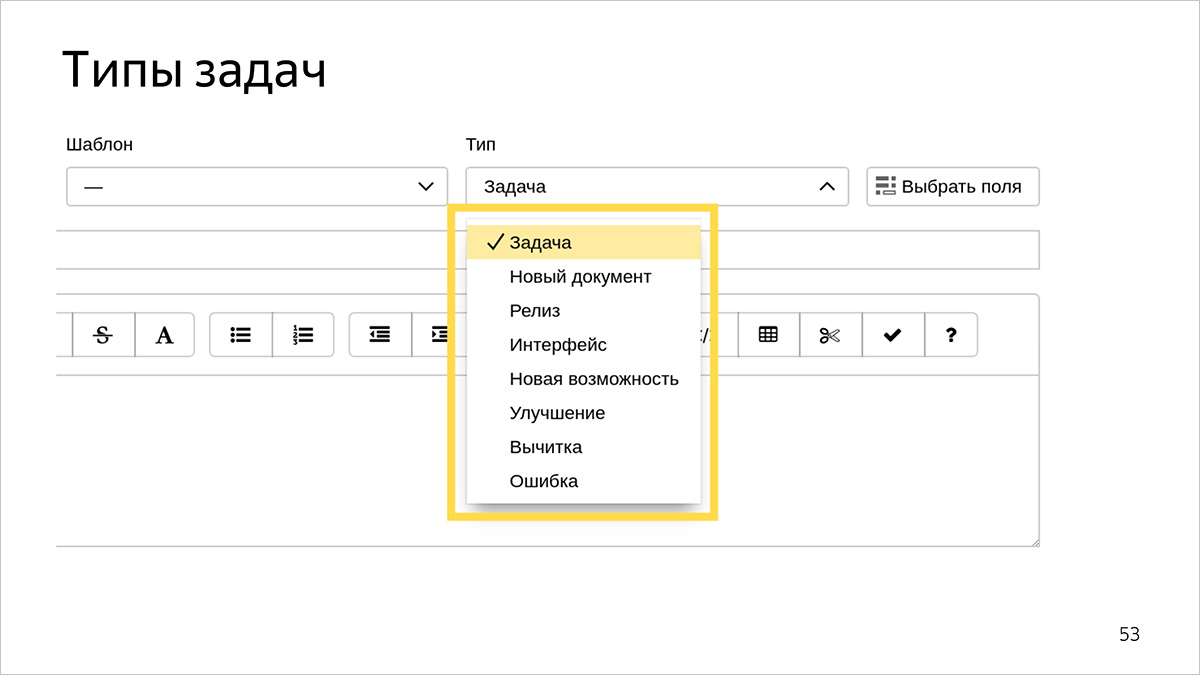
Types and status of tasks
Types and status of tasks not only allow to classify types of work and their current state, but also to count our metrics with sections.
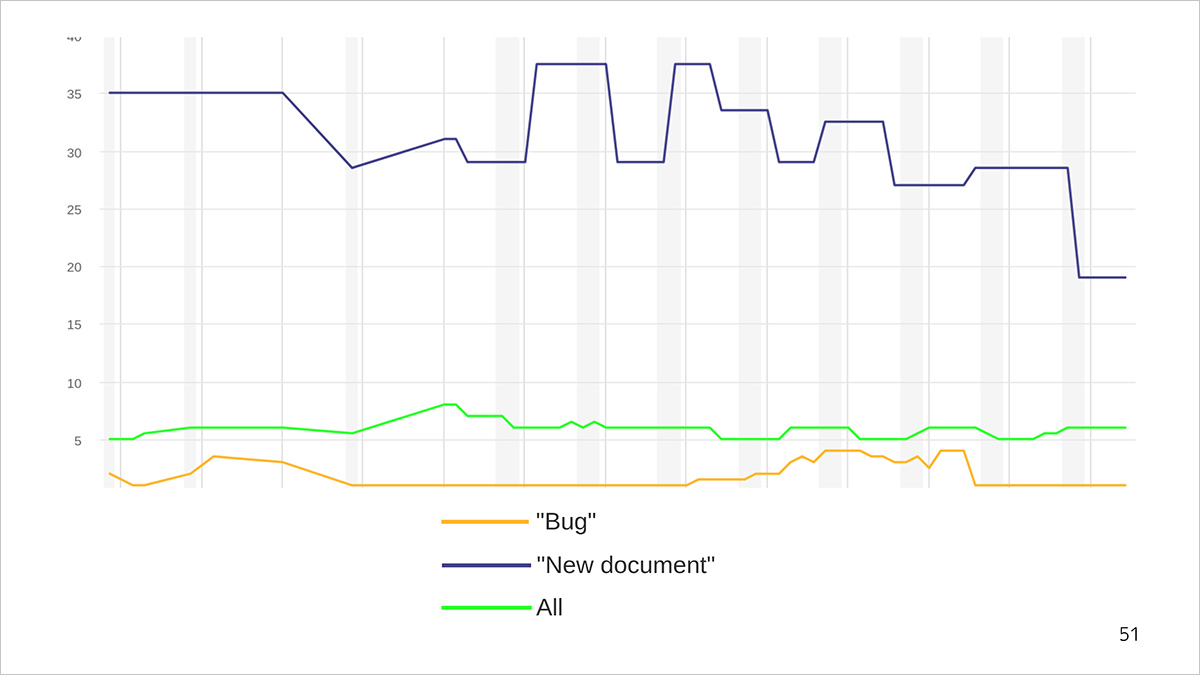
Schedule time to complete tasks. The blue line is the average document production time, the orange line is the bug repair time, the green line is the average time to complete all types of tasks.
Let's tell on the example of the schedule. For example, a bug is fixed within 1–5 days, and 30–40 are spent on writing a new document. At the same time, we write new documents less frequently than we supplement old ones or correct errors. Therefore, the average time to complete any type of task (green line) is too long for bugs and too short for new documents. With its help, we get only the average representation of the speed of solving problems.
Since we consider metrics in order to optimize the processes, we need to look at more pointed sections: for example, how long we solve the problem “bug” or “new document”. And the average for all types can be viewed to track the overall trend.
We use this set of task types.
There are more statuses than types, because this is required by workflow.
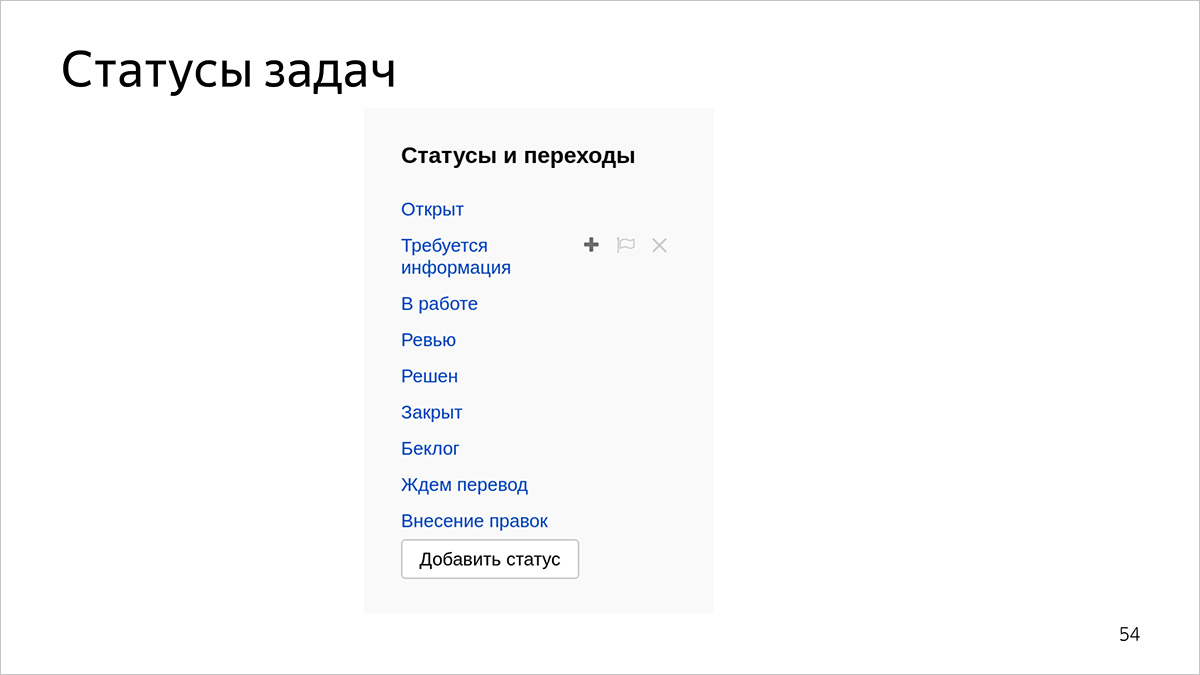
It is easier to work with types and statuses if they are unambiguous and there are not too many of them. Otherwise, the performers may be confused.
How to count performance metrics
In the last part, we told that we conducted a study and selected 20 documentation metrics out of 136. There are six performance metrics among them.

There are two aspects to counting metrics.
- Calculation of metrics on cuts. We have told above what it is and why it is important to us.
- Counting averaged values.
The classical approach of calculating averaged values is to sum all the indicators and divide by their number. This approach does not always work well because it takes into account degenerate cases. For example, we know that most of our bugs are fixed in a day. But there are degenerate cases - for example, a ticket is lost or an employee leaves - then it takes longer to fix it. Suppose we had six bugs during the period under review. Five we decided in a day, and one - in 115. It turns out that the average bug fix is 20 days. But this figure does not reflect reality: we almost always correct mistakes for the day, and one long ticket significantly affects this indicator.
In such cases, the percentile comes to the rescue. This is the maximum value (in our case, metrics) in which the specified percentage of objects fits. For example, the 80th percentile is a value that does not exceed 80% of the sample objects. In our case, this value would be the value 1, since it does not exceed 83% of the objects.
Here a third plane appears - the time for which we count the metrics. Almost all of our metrics are considered for 30 days.

We consider metrics with sections as follows:
- first all the queues together
- then cut across the queues
- then we detail: we make a cut in queues with a cut for all types of tasks.
Each following section of the metric specifies the previous one. The average value for all the queues, types and status of tasks gives a generalized view. We then consider the value for individual queues to understand how things are with technical, user, or internal documentation. At the last, most detailed level, we are working on a pair of “queue + type and status”.
Further we will tell how we consider metrics of productivity.
Number of closed tasks
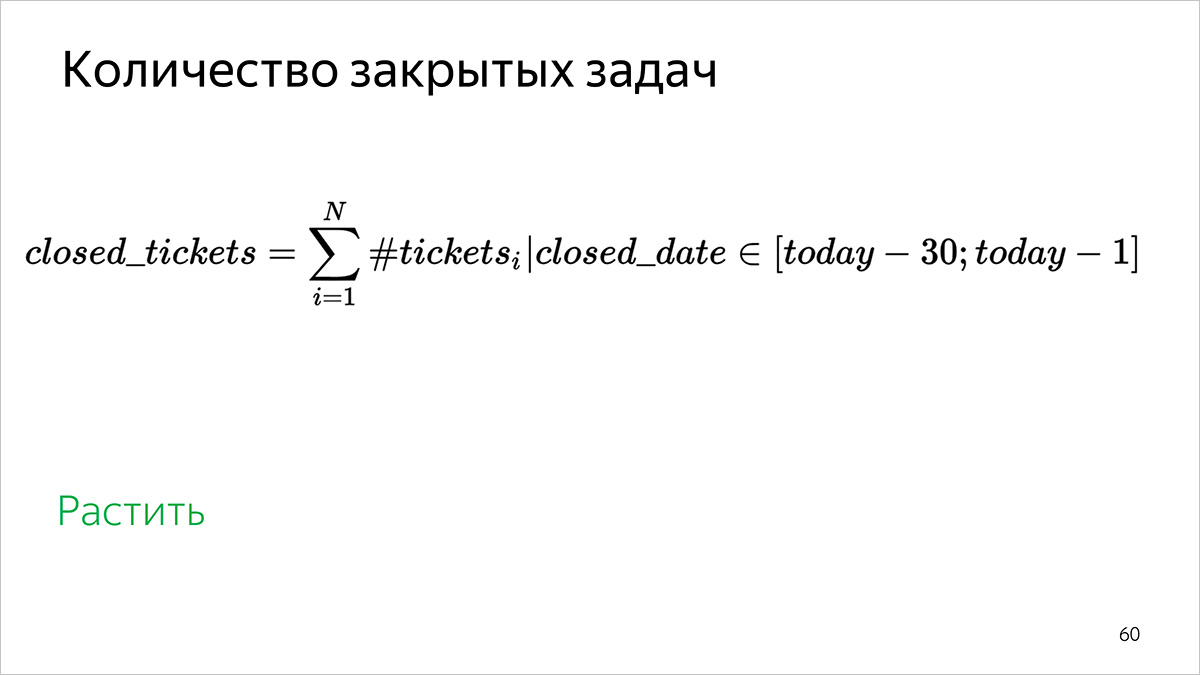
How to calculate: by the number of tasks that are closed in the interval [31 days ago; yesterday].
The number of tasks taken in the work
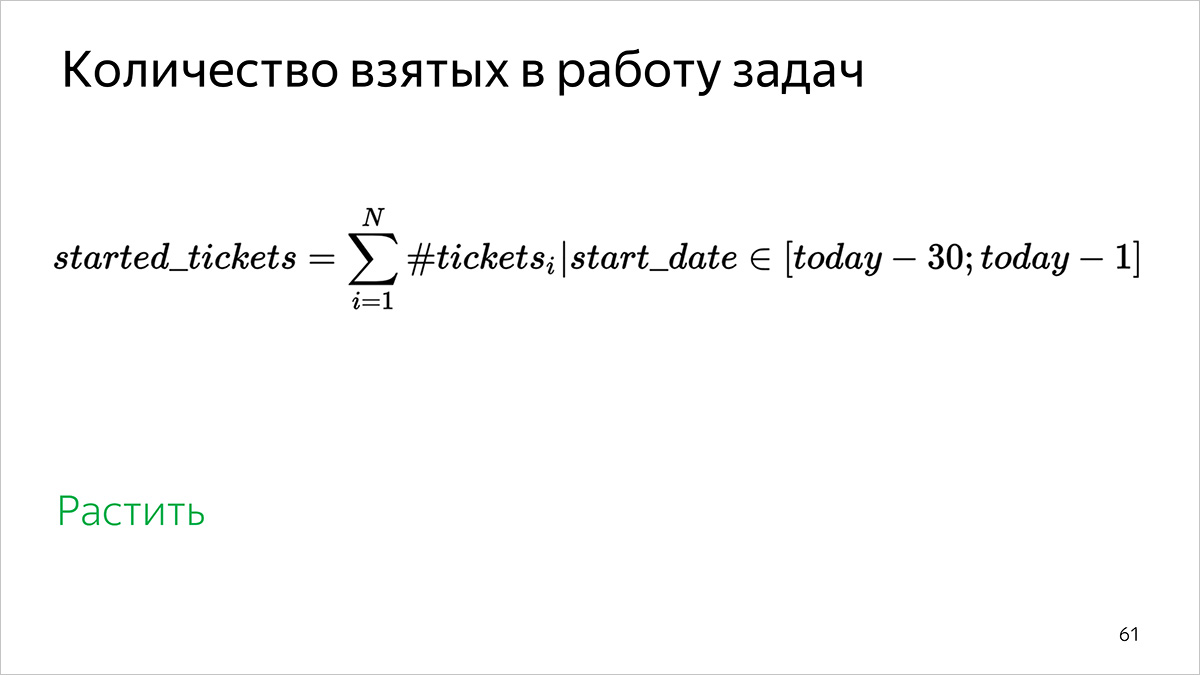
How to calculate: the number of tasks in which the start of work is in the interval [31 days ago; yesterday].
Number of days before taking to work
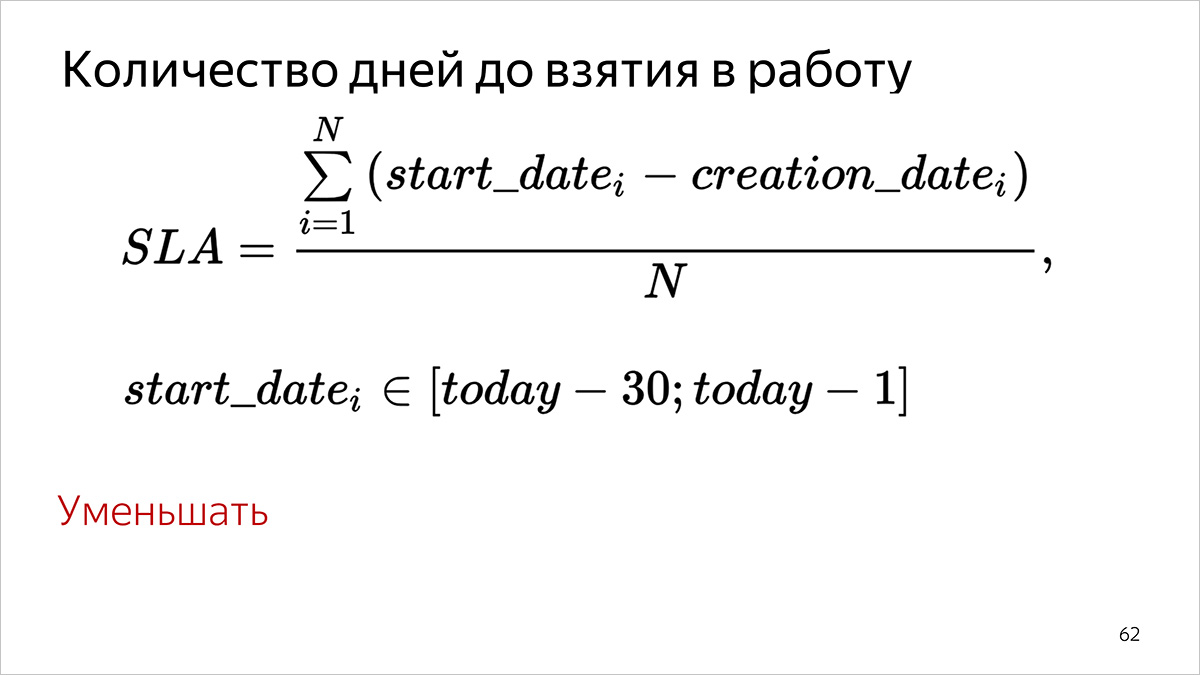
How to count:
- For each task that was taken into work during the specified time period (start date in the Tracker in the interval [31 days ago; yesterday]), we count the number of full days between the formulation (field creation date) and the start of the task (field start date) .
- We summarize all the values obtained in the first step.
- We divide the amount received by the number of tasks for which we did the first item.
For percentiles, item 3 is omitted, values are sorted in ascending order, and a value is selected that corresponds to the specified percentile.
Number of days to complete
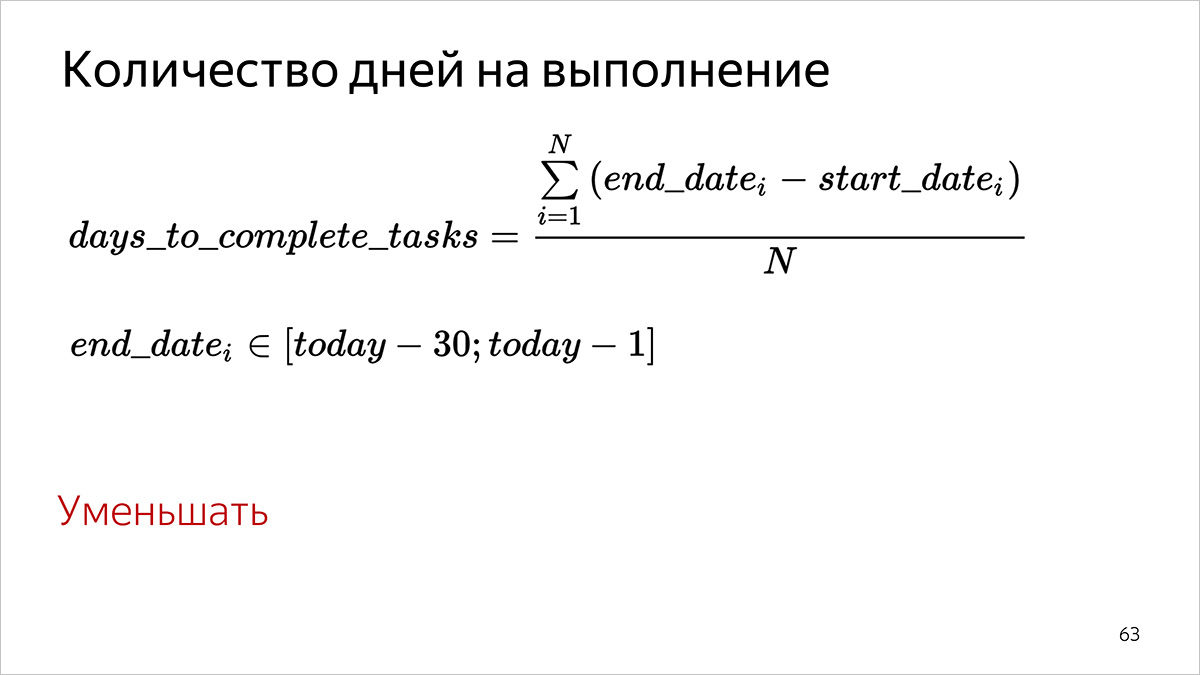
How to believe.
- For each task that is completed during the specified time period (end date in the Tracker in the interval [31 days ago; yesterday]), we count the number of full days between the start of work (the start date field) and the task execution (end date field).
- We summarize all the values obtained in the first step.
- We divide the amount received by the number of tasks for which we did the first item.
For percentiles, item 3 is omitted, values are sorted in ascending order, and a value is selected that corresponds to the specified percentile.
The number of tasks without reaction more than 14 days
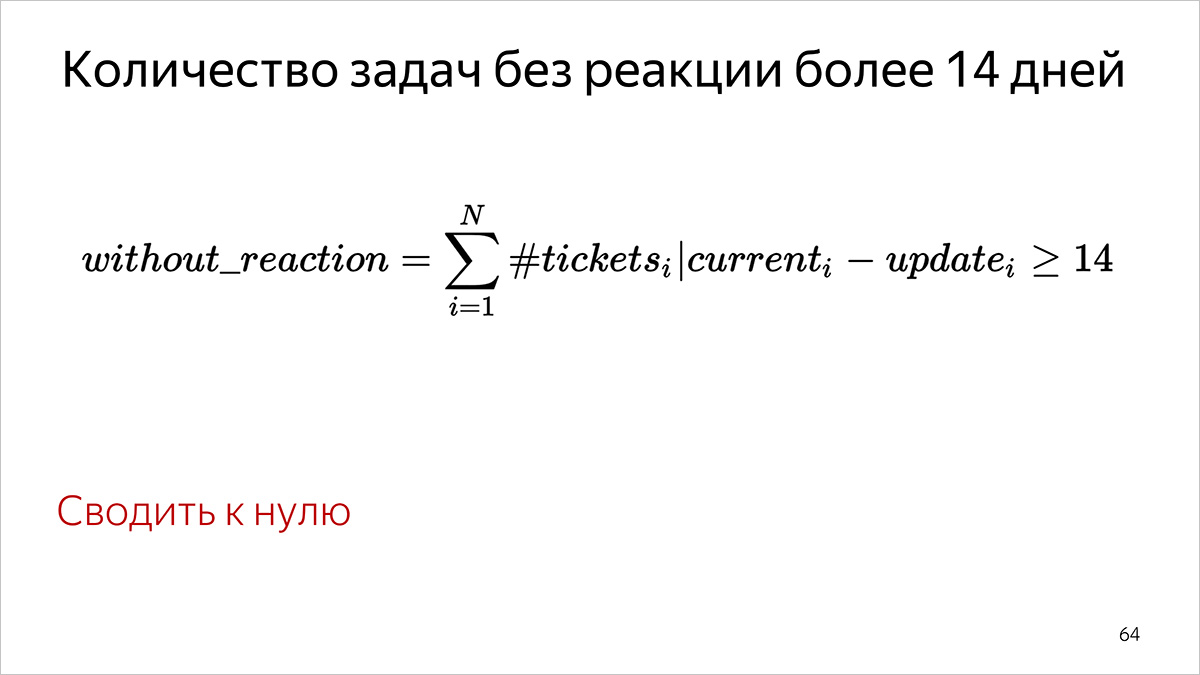
How to count: the number of tasks in which nothing happened for more than 14 days. It is determined by the updated field in the Tracker: the field value must be less than “yesterday − 14 days”.
Technical duty
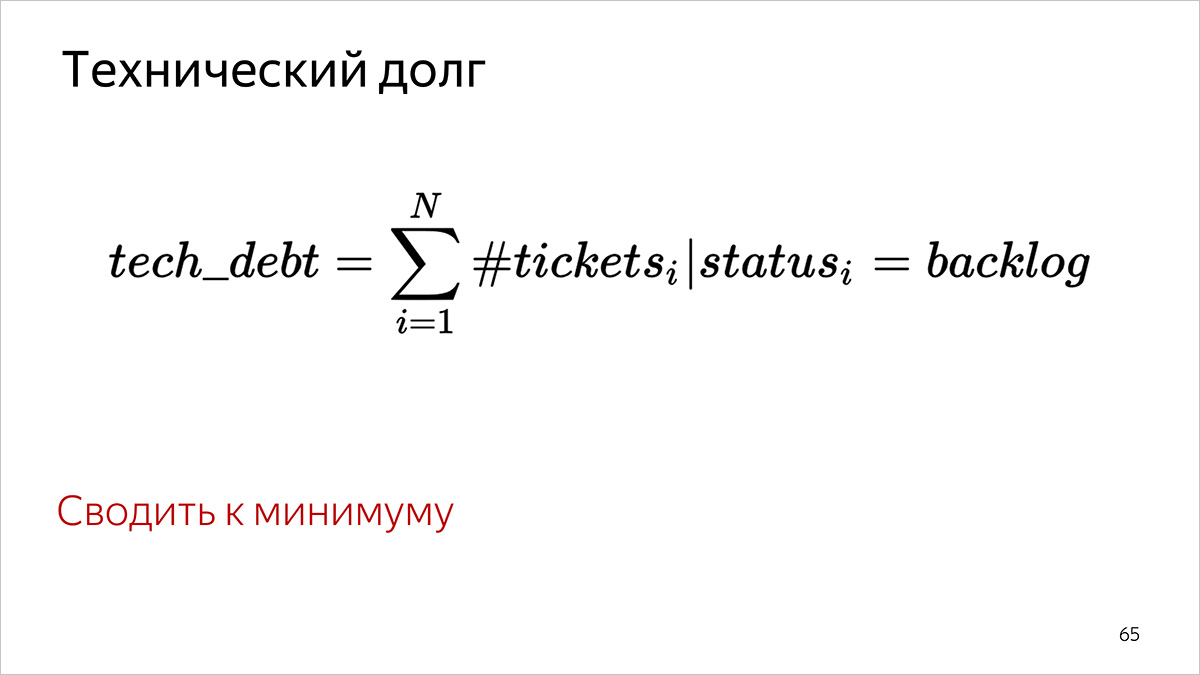
How do we count: by the number of tasks that have the “Backlog” status in the Tracker.
Technical implementation of calculating performance metrics
At the top level, the metrics counting system consists of the following components and information links.
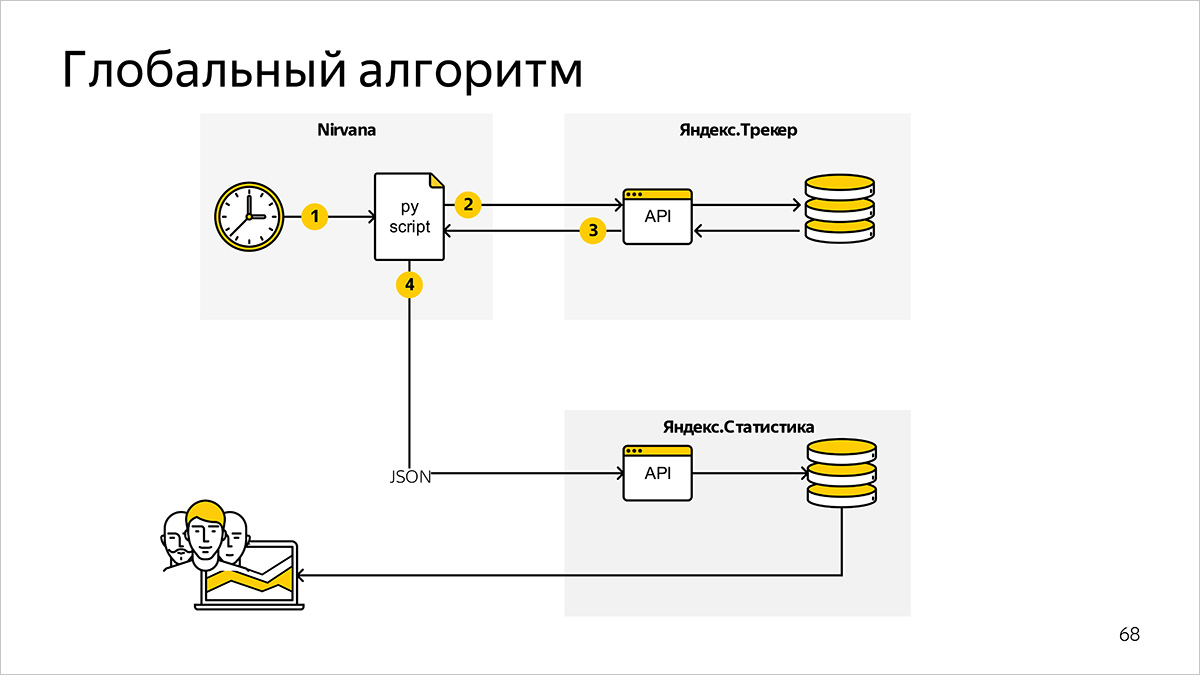
Scheduled Metrics Program
We use Nirvana - a universal computing platform. It formally describes the order of starting processes. Together with the internal scheduler (scheduler), Nirvana replaces us with a set of bash scripts and cron.
A program written in Python runs regularly and asks for the data necessary for calculating metrics.
Task setting system
The data for the calculation of metrics in our case is stored in Yandex.Tracker. As an interface to the data, we use the Yandex.Tracker Python API - this is a wrapper on the HTTP API, which allows you to get information faster and easier in suitable data structures for further processing.
You can choose a convenient system with a suitable API, for example, Jira.
Chart preparation system
After calculating the metrics based on data from Yandex.Tracker, our program generates JSON files and sends them to the internal Yandex service. Statistics for drawing graphs.
You can use any JS library that can build graphs. The review of some similar decisions is on Habré:
In the next part, we will describe how we consider the quality metrics of user documentation.
')
Source: https://habr.com/ru/post/449204/
All Articles