Anger, bargaining and depression when working with InfluxDB
If you use the time series database (timeseries db, wiki ) as the main repository for a site with statistics, instead of solving the problem, you can get a lot of headaches. I work on a project where such a database is used, and sometimes InfluxDB, which is being discussed, presented unexpected surprises in general.
Disclaimer : The issues listed are for InfluxDB version 1.7.4.
Why time series?
The project is to track transactions in various blockchains and display statistics. Specifically, we look at the emission and burning of stable-coin ( wiki ). Based on these transactions, you need to build graphs and show pivot tables.
')
When analyzing transactions, an idea came up: use the InfluxDB time series database as the main repository. Transactions are points in time, and they fit well into the time series model.
The aggregation functions also looked very convenient - they are ideally suited for processing graphs with a long period. The user needs a schedule for the year, and the database contains a set of data with a timeframe of five minutes. It is pointless to send all one hundred thousand points to him - except for long processing, they will not fit on the screen. You can write your own implementation of increasing the timeframe, or use the aggregation functions built into Influx. With their help, you can group the data by day and send the necessary 365 points.
It was a bit embarrassing that usually such databases are used to collect metrics. Monitoring servers, iot-devices, everything from which millions of points of view “pour”: [<time> - <metric value>]. But if the database works well with a large data stream, then why should a small volume cause problems? With this thought, took InfluxDB to work.
What else is convenient in InfluxDB
In addition to the aggregation functions mentioned above, there is another remarkable thing - continuous queries ( doc ). This is a scheduler built into the database that can process data according to a schedule. For example, every 24 hours you can group all the records per day, read the average and write one new point to another table without writing your own bikes.
There is also retention policies ( doc ) - setting to delete data after a certain period. It is useful when, for example, you need to store the load on the CPU for a week with measurements once a second, and at a distance of a couple of months such accuracy is not needed. In this situation, you can do so:
- create a continuous query to aggregate data into another table;
- For the first table, determine the policy for deleting metrics that are older than that week.
And Influx will independently reduce the size of the data and delete the unnecessary.
About stored data
Not a lot of data is stored: about 70 thousand transactions and another million points with market information. Adding new records - no more than 3000 points per day. There are also site metrics, but there is little data and there are not more than a month for retention policy.
Problems
During the development and subsequent testing of the service, more and more critical problems arose during the operation of InfluxDB.
1. Delete data
There is a series of data with transactions:
SELECT time, amount, block, symbol FROM transactions WHERE symbol='USDT' Result:
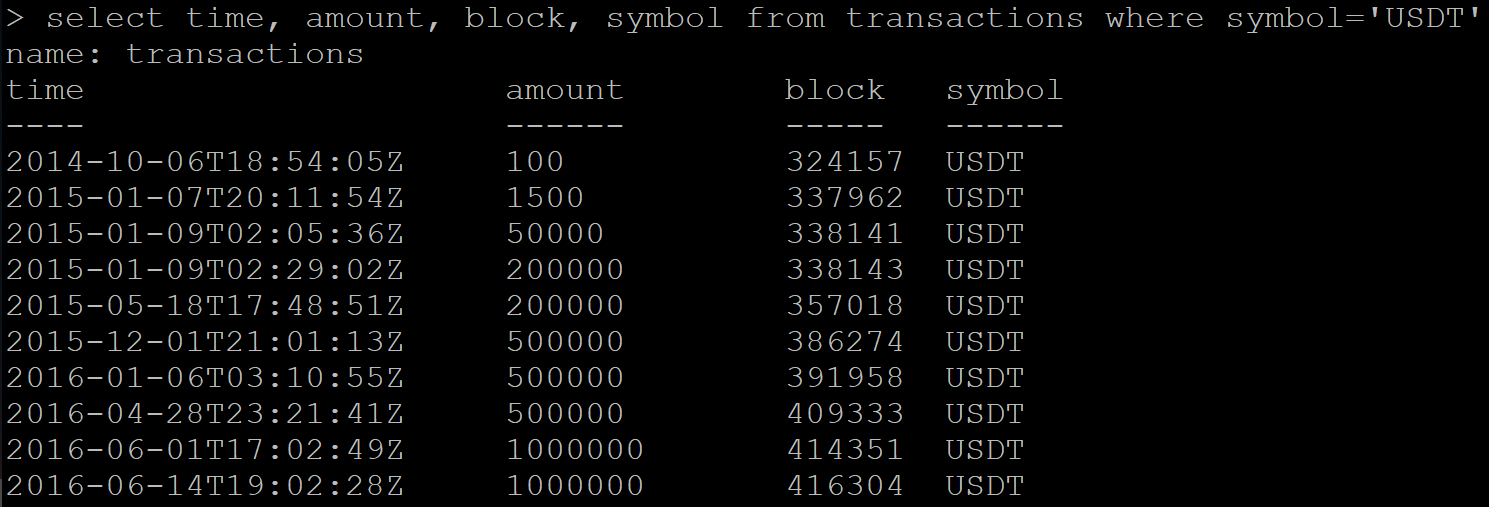
I send a command to delete data:
DELETE FROM transactions WHERE symbol='USDT' Next, I make a request to retrieve already deleted data. And instead of a blank response, Influx returns a portion of the data that needs to be deleted.
I try to delete the entire table:
DROP MEASUREMENT transactions Checking table deletion:
SHOW MEASUREMENTS I do not observe the table in the list, but the new data request still returns the same set of transactions.
I had a problem only once, since the case with deletion is an isolated case. But this behavior of the base clearly does not fit into the framework of "correct" work. Later on github found an open ticket almost a year ago on this topic.
As a result, the removal and subsequent restoration of the entire database helped.
2. Floating point numbers
Mathematical calculations using the built-in InfluxDB functions give precision errors. Not that it was something unusual, but unpleasant.
In my case, the data has a financial component and I would like to process it with high accuracy. Because of this, plans to abandon continuous queries.
3. Continuous queries cannot be adapted to different time zones.
The service has a table with daily transaction statistics. For each day, you need to group all transactions for the day. But the day for each user will begin at different times, hence the set of transactions is different. UTC has 37 shift options for which you need to aggregate data.
When grouping by time in InfluxDB, you can additionally specify a shift, for example, for Moscow time (UTC + 3):
SELECT MEAN("supply") FROM transactions GROUP BY symbol, time(1d, 3h) fill(previous) But the result of the query will be incorrect. For some reason, the data grouped by day will start as early as 1677 (InfluxDB officially supports the time period from this year):
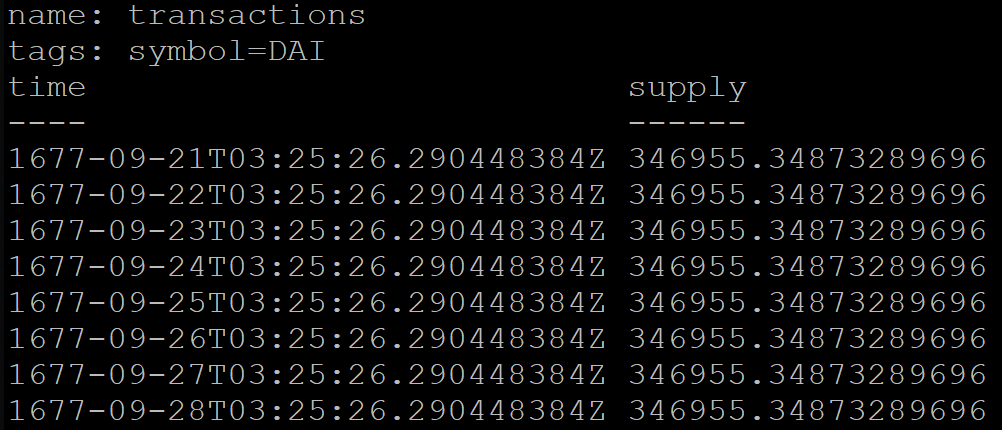
To work around this problem, the service was temporarily transferred to UTC + 0.
4. Performance
There are many benchmarks on the Internet with comparisons of InfluxDB and other databases. At the first acquaintance they looked like marketing materials, but now I think that there is some truth in them.
I'll tell you my case.
The service provides an API method that returns statistics for the last 24 hours. When calculating, the method queries the base three times with such queries:
SELECT * FROM coins_info WHERE time <= NOW() GROUP BY symbol ORDER BY time DESC LIMIT 1 SELECT * FROM dominance_info ORDER BY time DESC LIMIT 1 SELECT * FROM transactions WHERE time >= NOW() - 24h ORDER BY time DESC Explanation:
- In the first query, we get the last points for each coin with market data. Eight points for eight coins in my case.
- The second request gets one newest point.
- The third one asks for a list of transactions for the last 24 hours; there may be several hundred of them.
I’ll clarify that in InfluxDB an index is automatically built by tags and by time, which speeds up queries. In the first request, symbol is a tag.
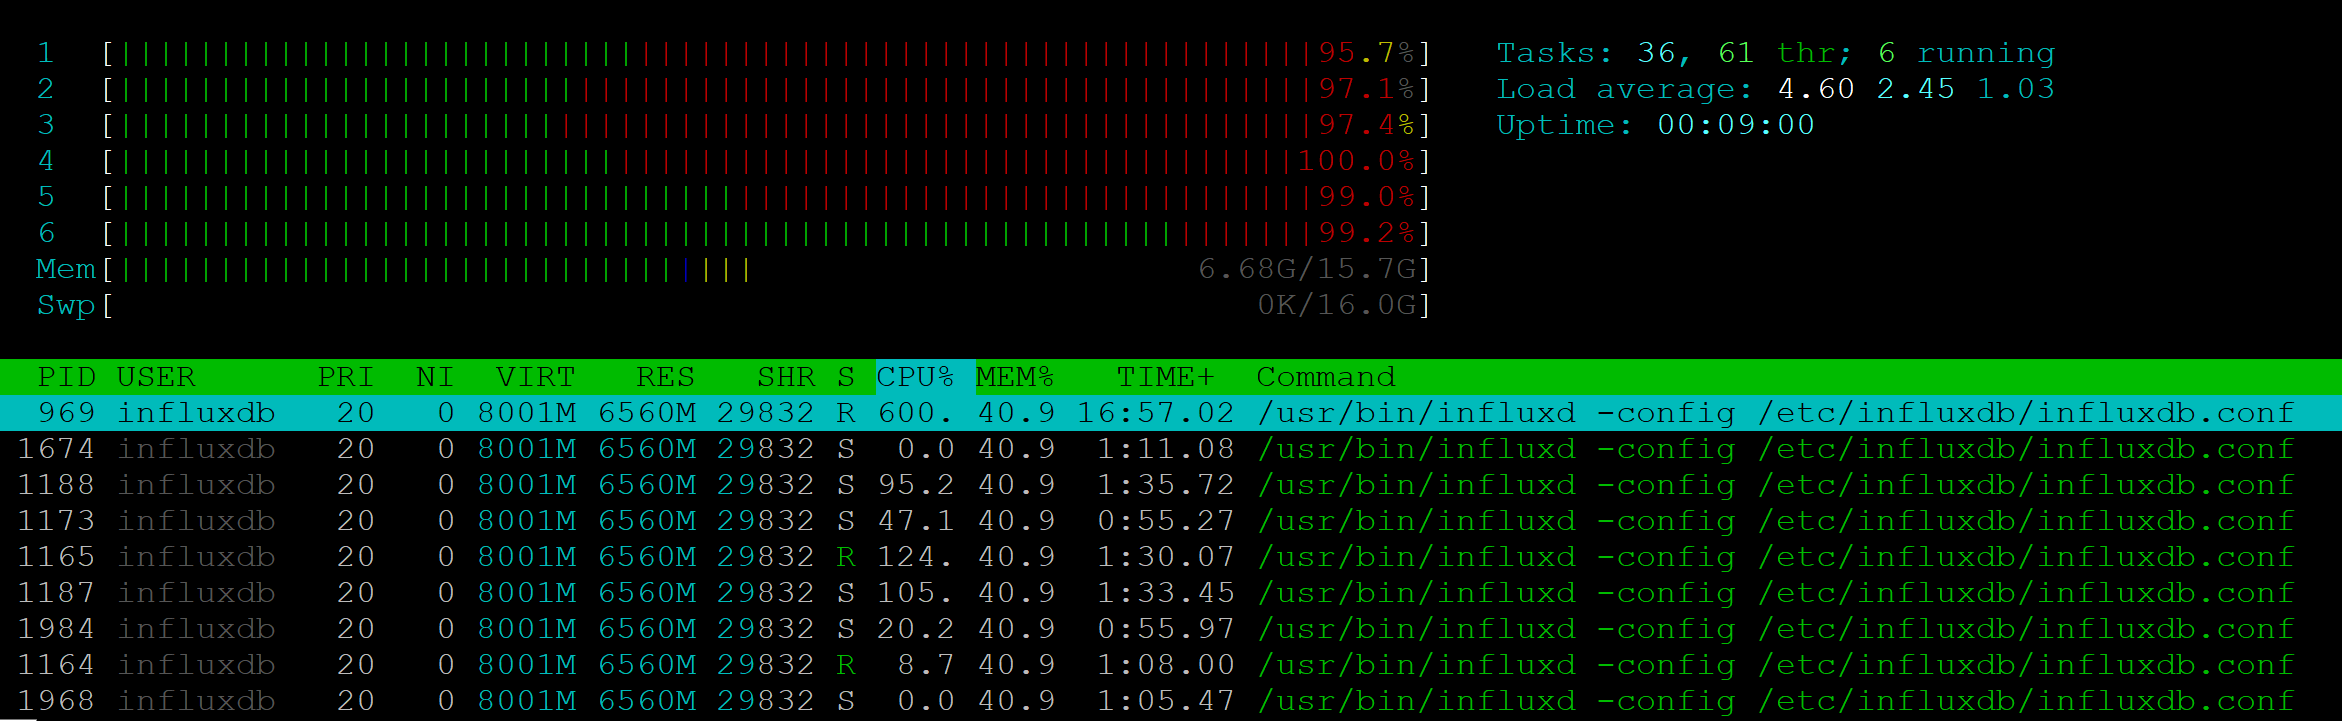
I did a stress test for this API method. For 25 RPS, the server showed a full load of six CPUs:
At the same time, the NodeJs process did not load at all.
The execution speed degraded already at 7-10 RPS: if one client could get an answer in 200 ms, then 10 clients had to wait in seconds. 25 RPS - the border from which stability suffered, 500 errors were returned to customers.
With such performance, using Influx in our project is impossible. Moreover, in a project where monitoring needs to be demonstrated to multiple clients, similar problems may appear and the metrics server will be overloaded.
Conclusion
The most important conclusion from the experience gained is that it is impossible to take an unknown technology into a project without sufficient analysis. A simple screening of open tickets on github could give information so as not to take InfluxDB as the main data repository.
InfluxDB should have been a good fit for the tasks of my project, but as practice has shown, this database does not meet the needs and mows a lot.
You can already find version 2.0.0-beta in the project repository, it is hoped that there will be significant improvements in the second version. In the meantime, I'm going to study the TimescaleDB documentation.
Source: https://habr.com/ru/post/449028/
All Articles