Android application in memory. Optimization Report for Yandex.Luncher
In the lightweight Android Go system, there are increased requirements for pre-installed applications - size and memory used. We faced a challenge to meet these requirements. We carried out a number of optimizations and decided to seriously change the architecture of our graphical shell, Yandex.Luncher. The head of the applied mobile solutions development team, Alexander Starchenko, shared this experience.
- My name is Alexander, I am from St. Petersburg, from the team that develops Yandex.Loncher and Yandex.Telephone. Today I will tell you how we optimized memory in Launcher. First, briefly explain what Launcher. Next, we discuss the reasons why we need to optimize memory. After that we will consider how to measure memory correctly and what it consists of. Then move on to practice. I will tell you how we optimized memory in Launcher and how we came to a radical solution of the issue. And at the end I will tell about how we monitor memory usage, how we keep it under control.

')
“Launcher” or “Launcher” is not so important. We in Yandex are used to calling him Launcher, and in the report I will use the word Launcher.
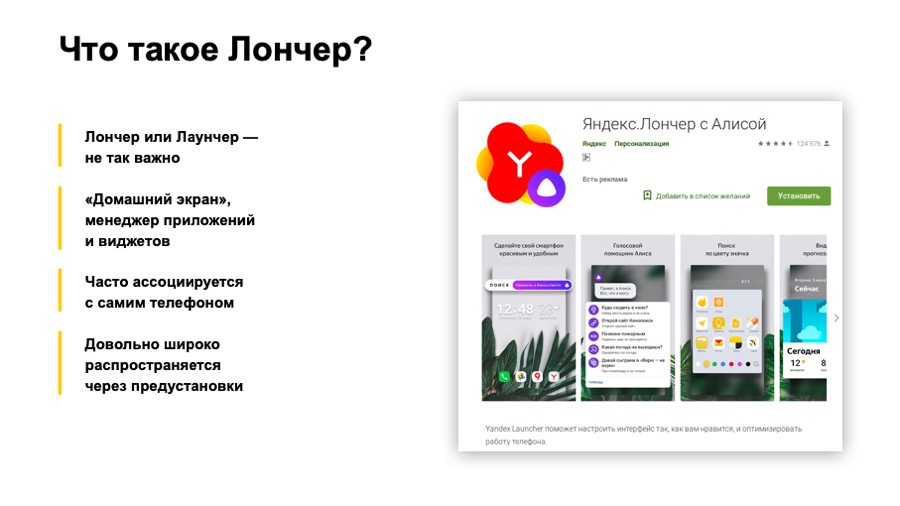
Another important point: Launcher is widely distributed through presets, that is, when you buy a new phone, Yandex.Loncher quite often may be the one and only application manager, home desk manager on your phone.
Now for the reasons why we need to optimize memory. I'll start with our reason. In short, this is Android Go. And now it's longer. At the end of 2017, Google introduced Android Oreo and its special version, Android Oreo Go edition. What is it special? This version is designed for low-end, for low-cost phones with RAM up to one gigabyte. What else is it special? For apps that are pre-installed on this version of Android, Google places additional requirements. In particular - the requirements for the consumption of RAM. Roughly speaking, some time after the launch, the application memory is removed, and the size for Launcher should not exceed 30-50 megabytes, depending on the size of the phone screen. 30 on the smallest, 50 on the big screens.
It should also be noted that Google continues to develop this area, and there is already an Android Pie Go edition.
What else could be the reasons to optimize memory usage? First, your application will be less likely to be unloaded. Secondly, it will work faster, as the garbage collector will work less often and memory will be allocated less often. No unnecessary objects will be created, unnecessary views will not inflate, and so on. Indirectly, judging by our experience, this will reduce the size of the apk of your application. All this together will provide you with more installations and better ratings on Google Play.
Great, now we know why optimize memory. Let's see what means to measure it and what it consists of.
Probably many of you have seen this picture. This is a screenshot from Android Studio Profile, from memory view. This tool is described in some detail on developer.android.com. Probably many of you used them. Who did not use - try.
What is good here? It is always at hand. It is convenient to use in the development process. However, it has some drawbacks. Not all locations of your application are visible here. For example, downloaded fonts are not visible here. Also using this tool is inconvenient to see which classes are loaded into memory, and this tool you can not use in automatic mode, that is, you can not set up some kind of automatic test based on Android Studio Profile.

The following tool exists since the days of Android development in Eclipse, it is Memory Analyzer, MAT, in short. It is provided as a standalone application and is compatible with memory dumps that you can save from Android Studio.
To do this, you will need to use a small utility, a professional converter. It comes with the Android Go edition and has several advantages. For example, it can build Paths to gs roots. It helped us a lot to see which classes are loaded by Launcher and when they are loaded. We could not do this using Android Studio Profiler.
The next tool is dumpsys, specifically dumpsys meminfo. Here you see part of the output of this command. It gives a fairly high-level knowledge of memory consumption. Nevertheless, it has certain advantages. It is convenient to use in automatic mode. You can easily set up tests that simply call this command. It also shows memory in all processes at once. And shows all the locations. As far as we know, Google uses the value of memory from this tool in the process of tests.
Let's take a brief look at the output example, what the application memory consists of. The first is Java Heap, all locations of your Java and Kotlin code. Usually this section is quite large. The following is Native Heap. Allocations from the native code are located here. Even if you obviously do not use native code in your application, allocations will be present here, since many Android objects — the same view — allocate native memory. The next section is Code. Here everything that is connected with the code gets: byte code, fonts. Code can also be quite large if you use many third-party, non-optimized libraries. The following is a software stack of Java and native code, usually small. Next comes the graphic memory. This includes Surface, textures, that is, the memory that spreads between the CPU and the GPU, is used for drawing. Next is the Private Other section. Everything that did not fall into the listed sections gets here, everything that the system could not scatter on them. Usually these are some native allocations. Next is the System section, this is the part of the system memory that is attributed to your application.
And at the end we have TOTAL, this is the sum of all the sections listed. We want to reduce it.

What else is important to know about memory measurement? First of all, our application does not fully control all allocations. That is, we as developers do not have complete control over what code will be loaded.
Following. The memory of the application can be very "jumping". During the measurement, you can observe strong differences in the readings. This may be due to both the time of taking the testimony and various scenarios. In this regard, when we optimize memory, analyze it, it is very important to do it under the same conditions. Ideally, on the same device. Even better, if you have the ability to call the Garbage Collector.
Fine. We know why we need to optimize memory, how to measure it correctly, what it consists of. Let's move on to practice, and I will tell you how we optimized memory in Launcher.

That is how things were at first. We had three processes, which in total allocated about 120 megabytes. This is almost four times more than we would like to receive.

Regarding the allocation of the main process, there was a large section of the Java Heap, a lot of graphics, a large code and a large Native Heap.

First, we approached the problem rather naively and decided to follow some recommendations from Google with some resources, to try to solve the problem quickly. We drew attention to the synthetic methods that are generated during the compilation process. We had more than 2 thousand of them. For a couple of hours we deleted them all, removed the memory.

And got a win of about one or two megabytes in the code section. Fine.
Next, we paid attention to the enum. As you know, enum is a class. And as Google finally admitted, enum is not very efficient in terms of memory. We have translated all enum in InDef and in StringDef. Here you can argue to me that ProgArt will help here. But in fact, ProgArt will not replace enum with primitive types. Better to do it yourself. By the way, we had more than 90 enum, quite a lot.

This optimization has already taken days, since most of it had to be done manually, and we won about three to six megabytes in the Java heap section.
Next, we paid attention to the collection. We used fairly standard Java collections such as HashMap. We had more than 150 of them, and they were all created at the start of Luncher. We replaced them with SparseArray, SimpleArrayMap and ArrayMap and began to create collections with a previously known size so that empty slots would not be allocated. That is, we pass the size of the collection to the constructor.

This also gave a definite gain, and our optimization also took days, most of which we did manually.
Then we took a more specific step. We saw that we have three processes. As we know, even an empty process in Android takes about 8-10 megabytes of memory, quite a lot.
In detail about the processes told my colleague Arthur Vasilov. Not so long ago at the Mosdroid conference was his report , also about Android Go.
What did we have after these optimizations? On the main test device, we observed memory consumption in the region of 80–100 megabytes, not bad enough, but still not enough. We began to measure memory on other devices. We found that on faster devices memory consumption was much more. It turned out that we had many different deferred initializations. After a while, Launcher inflated some views, initiated some libraries, and so on.

What have we done? First of all, we walked through the view, through all the layouts. Removed all views that have been inflamed with visibility gone. We brought them into separate layouts, began to inflate them programmatically. Those that we did not need, we generally stopped inflating until they are needed by the user. We paid attention to the optimization of images. Stopped loading pictures that the user now does not see. In the case of Launcher, these were the image icons of applications in the full list of applications. Before its opening, we will not ship them. This gave us a very good win in the graphics section.
We also checked our picture caches in memory. It turned out that not all of them were optimal, they did not store in memory all the pictures corresponding to the screen of the phone on which Launcher was running.
After that, we began to analyze the code section and noticed that we had a lot of rather heavy classes from somewhere. It turned out that these were mainly library classes. In some libraries, we found quite strange things. One of the libraries created a HashMap and in a static initializer scored it with a sufficiently large number of objects.

Another library also loaded audio files in the static block, which occupied about 700 kilobytes of memory.
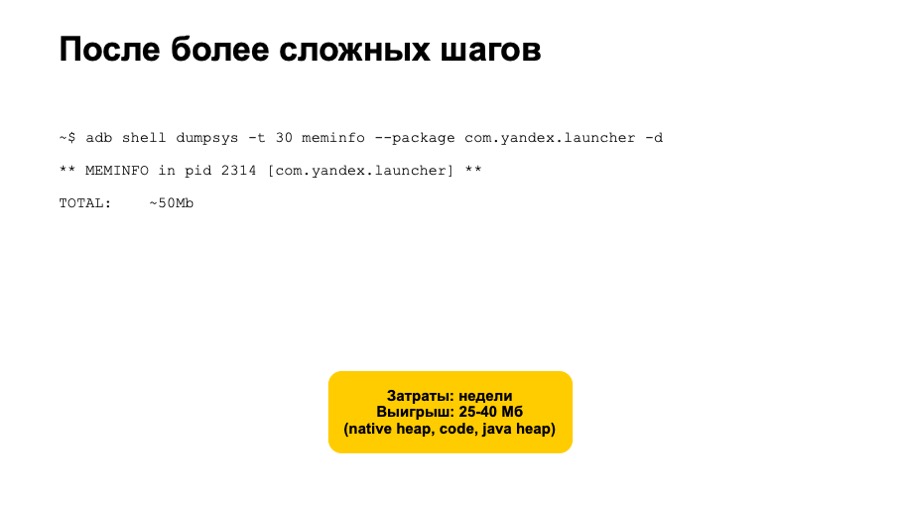
We stopped initializing such libraries, began to work with them only when these functions are really needed by users. All of these optimization took several weeks. We tested a lot, checked that we didn’t introduce additional problems. But we also got a fairly good gain, about 25 of 40 megabytes in the Native, Heap, Code and Java Heap sections.
But this was not enough. Memory consumption is still not lowered to 30 megabytes. It seemed that we had exhausted all the variants of some simple automatic and safe optimizations.
We decided to consider radical solutions. Here we saw two options - creating a separate lite-application or reworking the Launcher architecture and switching to a modular architecture with the ability to build Launcher assemblies without additional modules. The first option is quite long and expensive. Most likely, the creation of such an application will result for you into a full-fledged separate application that will need to be fully supported and developed. On the other hand, the modular architecture option is also quite expensive, rather risky, but still it is faster, since you are already working with a known code base, you already have a set of automatic unit tests, integration tests, and manual tests. -cases
It should be noted that whichever option you choose, you will somehow have to give up some of the features of your application in the Android Go version. This is normal. Google does the same in its Go apps.
As a result, having implemented a modular architecture, we reliably solved our memory problems and began to pass tests even on devices with a small screen, that is, we reduced the memory consumption to 30 megabytes.

A little bit about memory monitoring, how we keep memory usage under control. First of all, we set up static analyzers, the same Lint on an error in cases when we use enum, create synthetic methods or use non-optimized collections.
Further more difficult. We set up automated integration tests that run Launcher on emulators and after a while remove memory consumption. If it is very different from the previous build, we have warnings and alerts. Then we begin to investigate the problem and do not publish changes that increase Launcher’s memory usage.
Let's sum up. There are various memory monitoring tools, memory measurements for fast and efficient operation. It is better to use them all, as they have their own advantages and disadvantages.
Radical solutions with a modular architecture for us proved to be more reliable and efficient. We regret not having taken them right away. But those steps that I mentioned at the very beginning of the report were not in vain. We noticed that the main version of the application was using memory optimally, working faster. Thank.
- My name is Alexander, I am from St. Petersburg, from the team that develops Yandex.Loncher and Yandex.Telephone. Today I will tell you how we optimized memory in Launcher. First, briefly explain what Launcher. Next, we discuss the reasons why we need to optimize memory. After that we will consider how to measure memory correctly and what it consists of. Then move on to practice. I will tell you how we optimized memory in Launcher and how we came to a radical solution of the issue. And at the end I will tell about how we monitor memory usage, how we keep it under control.
')
“Launcher” or “Launcher” is not so important. We in Yandex are used to calling him Launcher, and in the report I will use the word Launcher.
Another important point: Launcher is widely distributed through presets, that is, when you buy a new phone, Yandex.Loncher quite often may be the one and only application manager, home desk manager on your phone.
Now for the reasons why we need to optimize memory. I'll start with our reason. In short, this is Android Go. And now it's longer. At the end of 2017, Google introduced Android Oreo and its special version, Android Oreo Go edition. What is it special? This version is designed for low-end, for low-cost phones with RAM up to one gigabyte. What else is it special? For apps that are pre-installed on this version of Android, Google places additional requirements. In particular - the requirements for the consumption of RAM. Roughly speaking, some time after the launch, the application memory is removed, and the size for Launcher should not exceed 30-50 megabytes, depending on the size of the phone screen. 30 on the smallest, 50 on the big screens.
It should also be noted that Google continues to develop this area, and there is already an Android Pie Go edition.
What else could be the reasons to optimize memory usage? First, your application will be less likely to be unloaded. Secondly, it will work faster, as the garbage collector will work less often and memory will be allocated less often. No unnecessary objects will be created, unnecessary views will not inflate, and so on. Indirectly, judging by our experience, this will reduce the size of the apk of your application. All this together will provide you with more installations and better ratings on Google Play.
Great, now we know why optimize memory. Let's see what means to measure it and what it consists of.
Link from the slide
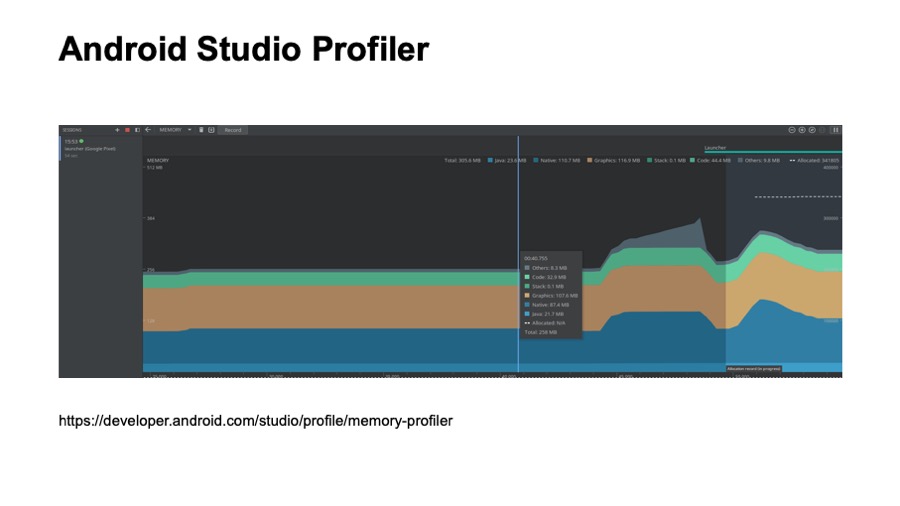
Probably many of you have seen this picture. This is a screenshot from Android Studio Profile, from memory view. This tool is described in some detail on developer.android.com. Probably many of you used them. Who did not use - try.
What is good here? It is always at hand. It is convenient to use in the development process. However, it has some drawbacks. Not all locations of your application are visible here. For example, downloaded fonts are not visible here. Also using this tool is inconvenient to see which classes are loaded into memory, and this tool you can not use in automatic mode, that is, you can not set up some kind of automatic test based on Android Studio Profile.
Links from the slide: first , second
The following tool exists since the days of Android development in Eclipse, it is Memory Analyzer, MAT, in short. It is provided as a standalone application and is compatible with memory dumps that you can save from Android Studio.
To do this, you will need to use a small utility, a professional converter. It comes with the Android Go edition and has several advantages. For example, it can build Paths to gs roots. It helped us a lot to see which classes are loaded by Launcher and when they are loaded. We could not do this using Android Studio Profiler.
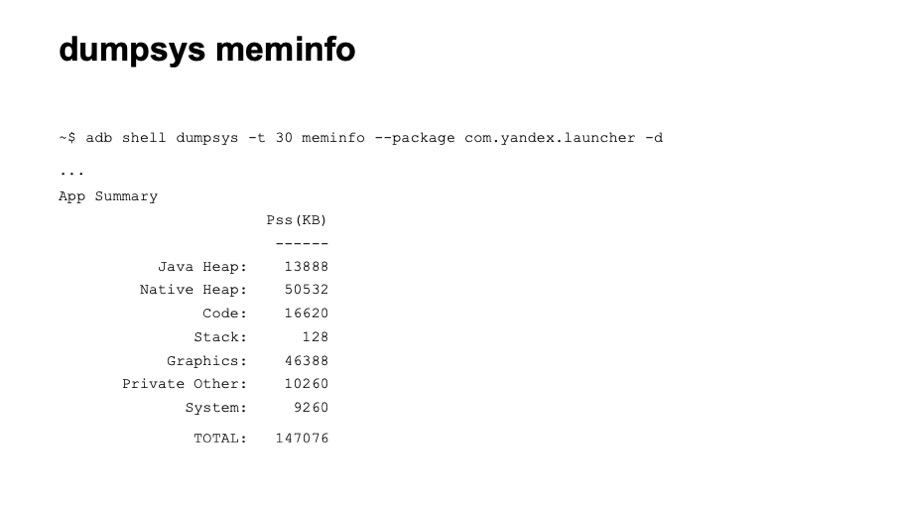
The next tool is dumpsys, specifically dumpsys meminfo. Here you see part of the output of this command. It gives a fairly high-level knowledge of memory consumption. Nevertheless, it has certain advantages. It is convenient to use in automatic mode. You can easily set up tests that simply call this command. It also shows memory in all processes at once. And shows all the locations. As far as we know, Google uses the value of memory from this tool in the process of tests.
Let's take a brief look at the output example, what the application memory consists of. The first is Java Heap, all locations of your Java and Kotlin code. Usually this section is quite large. The following is Native Heap. Allocations from the native code are located here. Even if you obviously do not use native code in your application, allocations will be present here, since many Android objects — the same view — allocate native memory. The next section is Code. Here everything that is connected with the code gets: byte code, fonts. Code can also be quite large if you use many third-party, non-optimized libraries. The following is a software stack of Java and native code, usually small. Next comes the graphic memory. This includes Surface, textures, that is, the memory that spreads between the CPU and the GPU, is used for drawing. Next is the Private Other section. Everything that did not fall into the listed sections gets here, everything that the system could not scatter on them. Usually these are some native allocations. Next is the System section, this is the part of the system memory that is attributed to your application.
And at the end we have TOTAL, this is the sum of all the sections listed. We want to reduce it.
What else is important to know about memory measurement? First of all, our application does not fully control all allocations. That is, we as developers do not have complete control over what code will be loaded.
Following. The memory of the application can be very "jumping". During the measurement, you can observe strong differences in the readings. This may be due to both the time of taking the testimony and various scenarios. In this regard, when we optimize memory, analyze it, it is very important to do it under the same conditions. Ideally, on the same device. Even better, if you have the ability to call the Garbage Collector.
Fine. We know why we need to optimize memory, how to measure it correctly, what it consists of. Let's move on to practice, and I will tell you how we optimized memory in Launcher.
That is how things were at first. We had three processes, which in total allocated about 120 megabytes. This is almost four times more than we would like to receive.
Regarding the allocation of the main process, there was a large section of the Java Heap, a lot of graphics, a large code and a large Native Heap.
First, we approached the problem rather naively and decided to follow some recommendations from Google with some resources, to try to solve the problem quickly. We drew attention to the synthetic methods that are generated during the compilation process. We had more than 2 thousand of them. For a couple of hours we deleted them all, removed the memory.
And got a win of about one or two megabytes in the code section. Fine.
Next, we paid attention to the enum. As you know, enum is a class. And as Google finally admitted, enum is not very efficient in terms of memory. We have translated all enum in InDef and in StringDef. Here you can argue to me that ProgArt will help here. But in fact, ProgArt will not replace enum with primitive types. Better to do it yourself. By the way, we had more than 90 enum, quite a lot.
This optimization has already taken days, since most of it had to be done manually, and we won about three to six megabytes in the Java heap section.
Next, we paid attention to the collection. We used fairly standard Java collections such as HashMap. We had more than 150 of them, and they were all created at the start of Luncher. We replaced them with SparseArray, SimpleArrayMap and ArrayMap and began to create collections with a previously known size so that empty slots would not be allocated. That is, we pass the size of the collection to the constructor.
This also gave a definite gain, and our optimization also took days, most of which we did manually.
Then we took a more specific step. We saw that we have three processes. As we know, even an empty process in Android takes about 8-10 megabytes of memory, quite a lot.
In detail about the processes told my colleague Arthur Vasilov. Not so long ago at the Mosdroid conference was his report , also about Android Go.
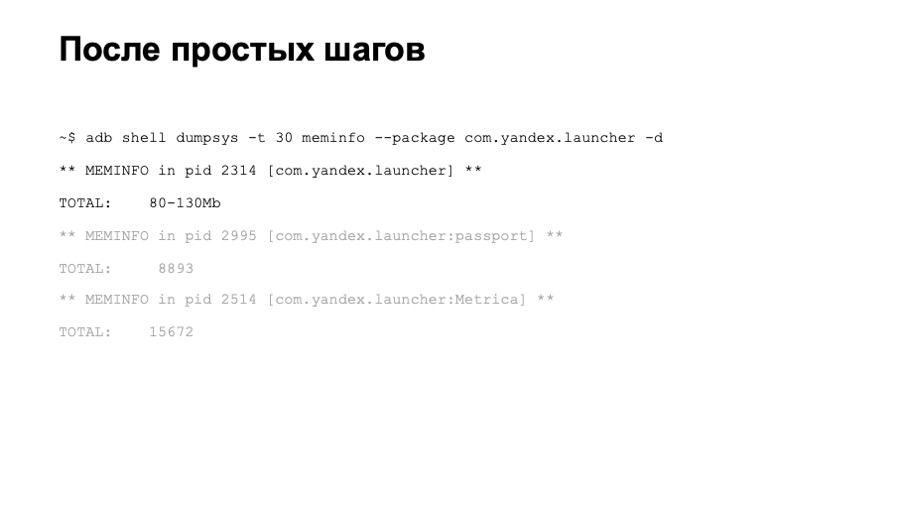
What did we have after these optimizations? On the main test device, we observed memory consumption in the region of 80–100 megabytes, not bad enough, but still not enough. We began to measure memory on other devices. We found that on faster devices memory consumption was much more. It turned out that we had many different deferred initializations. After a while, Launcher inflated some views, initiated some libraries, and so on.
What have we done? First of all, we walked through the view, through all the layouts. Removed all views that have been inflamed with visibility gone. We brought them into separate layouts, began to inflate them programmatically. Those that we did not need, we generally stopped inflating until they are needed by the user. We paid attention to the optimization of images. Stopped loading pictures that the user now does not see. In the case of Launcher, these were the image icons of applications in the full list of applications. Before its opening, we will not ship them. This gave us a very good win in the graphics section.
We also checked our picture caches in memory. It turned out that not all of them were optimal, they did not store in memory all the pictures corresponding to the screen of the phone on which Launcher was running.
After that, we began to analyze the code section and noticed that we had a lot of rather heavy classes from somewhere. It turned out that these were mainly library classes. In some libraries, we found quite strange things. One of the libraries created a HashMap and in a static initializer scored it with a sufficiently large number of objects.
Another library also loaded audio files in the static block, which occupied about 700 kilobytes of memory.
We stopped initializing such libraries, began to work with them only when these functions are really needed by users. All of these optimization took several weeks. We tested a lot, checked that we didn’t introduce additional problems. But we also got a fairly good gain, about 25 of 40 megabytes in the Native, Heap, Code and Java Heap sections.
But this was not enough. Memory consumption is still not lowered to 30 megabytes. It seemed that we had exhausted all the variants of some simple automatic and safe optimizations.
We decided to consider radical solutions. Here we saw two options - creating a separate lite-application or reworking the Launcher architecture and switching to a modular architecture with the ability to build Launcher assemblies without additional modules. The first option is quite long and expensive. Most likely, the creation of such an application will result for you into a full-fledged separate application that will need to be fully supported and developed. On the other hand, the modular architecture option is also quite expensive, rather risky, but still it is faster, since you are already working with a known code base, you already have a set of automatic unit tests, integration tests, and manual tests. -cases
It should be noted that whichever option you choose, you will somehow have to give up some of the features of your application in the Android Go version. This is normal. Google does the same in its Go apps.
As a result, having implemented a modular architecture, we reliably solved our memory problems and began to pass tests even on devices with a small screen, that is, we reduced the memory consumption to 30 megabytes.
A little bit about memory monitoring, how we keep memory usage under control. First of all, we set up static analyzers, the same Lint on an error in cases when we use enum, create synthetic methods or use non-optimized collections.
Further more difficult. We set up automated integration tests that run Launcher on emulators and after a while remove memory consumption. If it is very different from the previous build, we have warnings and alerts. Then we begin to investigate the problem and do not publish changes that increase Launcher’s memory usage.
Let's sum up. There are various memory monitoring tools, memory measurements for fast and efficient operation. It is better to use them all, as they have their own advantages and disadvantages.
Radical solutions with a modular architecture for us proved to be more reliable and efficient. We regret not having taken them right away. But those steps that I mentioned at the very beginning of the report were not in vain. We noticed that the main version of the application was using memory optimally, working faster. Thank.
Source: https://habr.com/ru/post/448966/
All Articles