Monitoring of weather data in Grafana
This article will discuss how to display the necessary system indicators for graphics for monitoring without having written a single line of code. The used software is distributed freely except for the database server - this is an MS SQL server deployed in the MS Azure cloud service, which you can easily replace with any other.
The meteorological station records the temperature and humidity indicators of the air and in real time sends them to MS Azure server, which puts this data into the database. Thus, a certain time series is generated, which is proposed to be monitored with the help of Grafana and output to the admin dashboard.

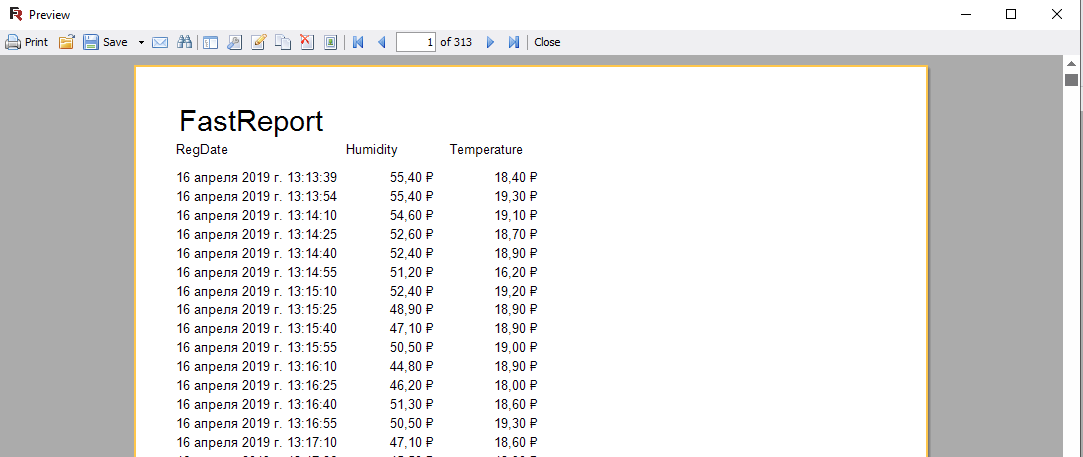
The task of the weather station in this article is not considered, we analyze the data, for this we use FastReport.
')
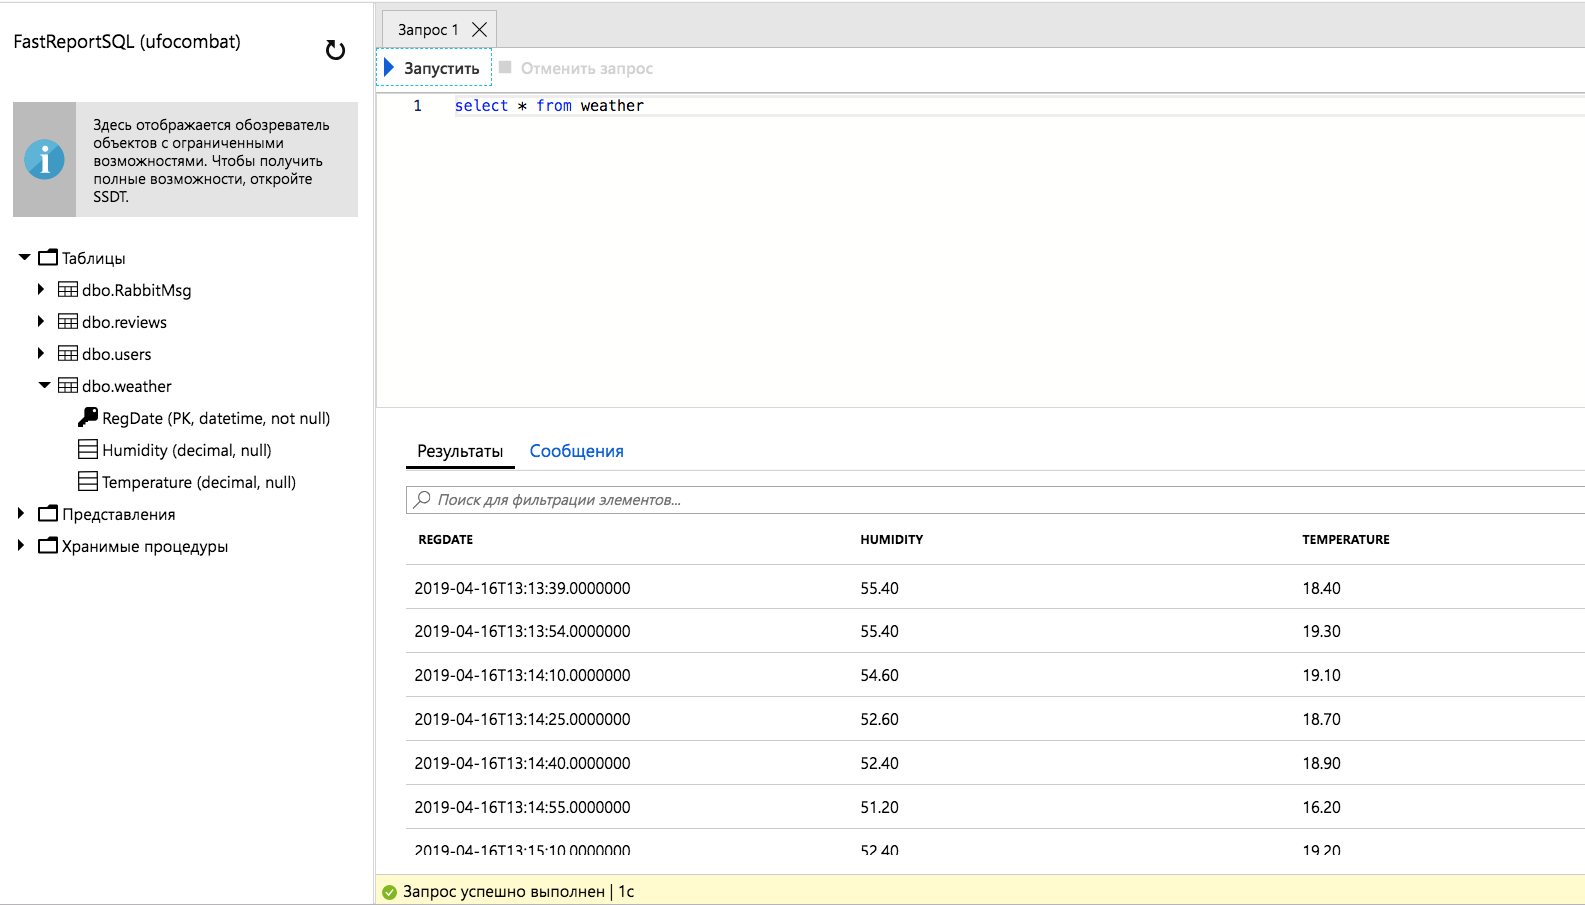
This is how it is stored in the database.
Download from grafana.com and install the Grafana server, then connect to the database with data.

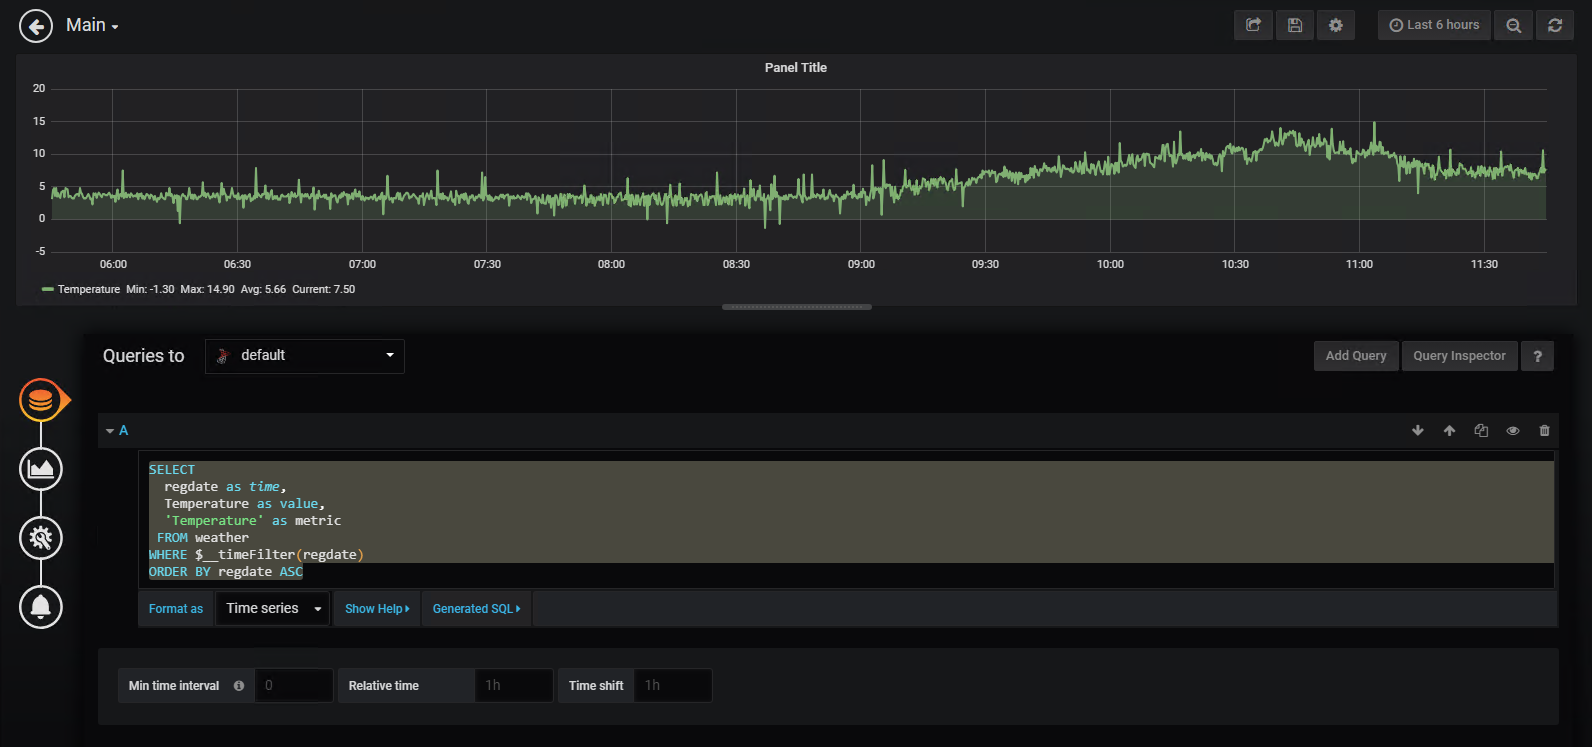
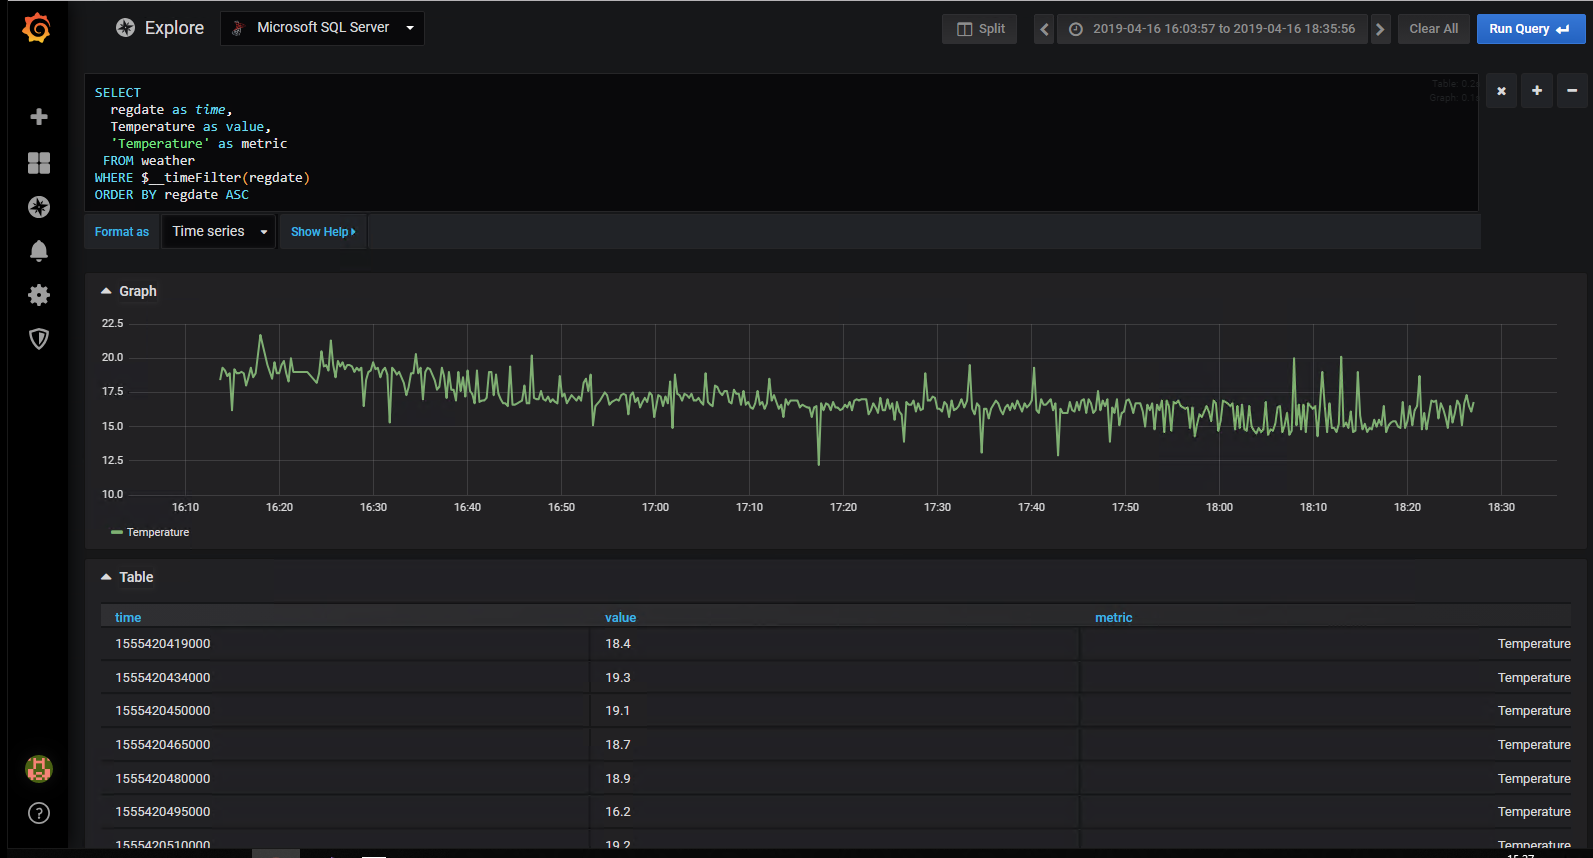
Next, we build a query to reflect the time series of temperature:
At the beginning of the article it was said that there is no need to program, it’s really because the proposed sample request is generated by the system itself. On the one hand, there is no need to program anything, and on the other hand, to quickly build complex queries, it is easy to modify the query and “explain” the system in a language that it understands.
A similar query is built for moisture and saved as a dashboard:

Live it looks like this
An observant reader will immediately notice the unnatural behavior of the humidity sensor in the upper graph:
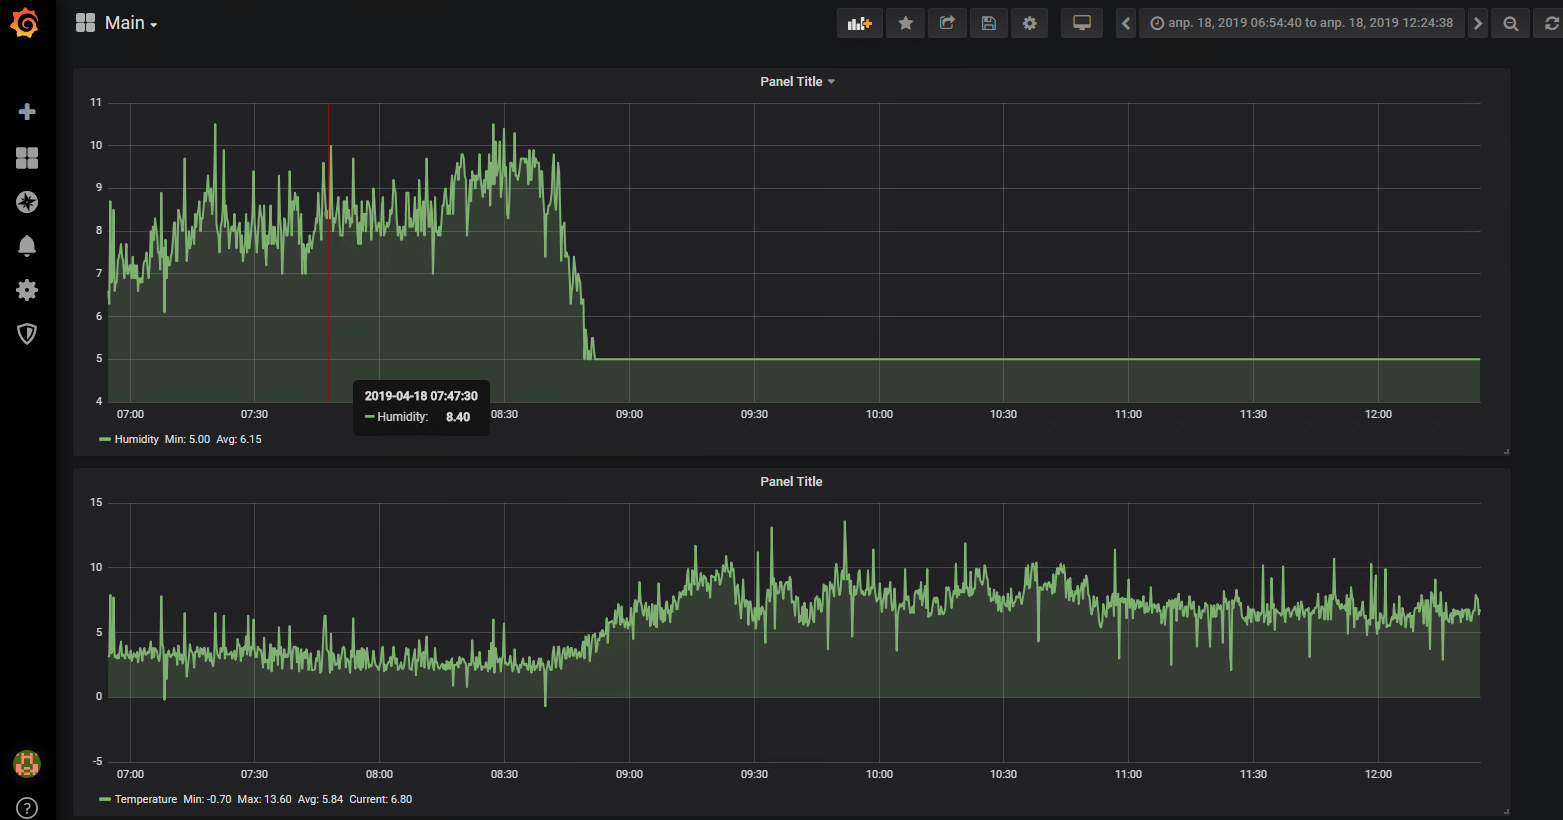
This makes it possible to easily determine the moment at which the sensor failed or completely broke. The Grafana system allows you to track such situations using alerts, while finding the moment in the database table is much more labor-intensive.
The considered approach allows you to quickly build monitoring of various indicators, the system allows you to connect various plug-ins with predefined metrics and graph forms that can satisfy any needs.
The meteorological station records the temperature and humidity indicators of the air and in real time sends them to MS Azure server, which puts this data into the database. Thus, a certain time series is generated, which is proposed to be monitored with the help of Grafana and output to the admin dashboard.
The task of the weather station in this article is not considered, we analyze the data, for this we use FastReport.
')
This is how it is stored in the database.
Download from grafana.com and install the Grafana server, then connect to the database with data.
Next, we build a query to reflect the time series of temperature:
SELECT regdate as time, Temperature as value, 'Temperature' as metric FROM weather WHERE $__timeFilter(regdate) ORDER BY regdate ASC At the beginning of the article it was said that there is no need to program, it’s really because the proposed sample request is generated by the system itself. On the one hand, there is no need to program anything, and on the other hand, to quickly build complex queries, it is easy to modify the query and “explain” the system in a language that it understands.
A similar query is built for moisture and saved as a dashboard:
Live it looks like this
An observant reader will immediately notice the unnatural behavior of the humidity sensor in the upper graph:
This makes it possible to easily determine the moment at which the sensor failed or completely broke. The Grafana system allows you to track such situations using alerts, while finding the moment in the database table is much more labor-intensive.
The considered approach allows you to quickly build monitoring of various indicators, the system allows you to connect various plug-ins with predefined metrics and graph forms that can satisfy any needs.
Source: https://habr.com/ru/post/448676/
All Articles