Is monitoring dead? - Long live monitoring
Since 2008, our company has been primarily engaged in infrastructure management and round-the-clock technical support for web projects: we have over 400 clients, this is about 15% of e-commerce in Russia. Accordingly, the support is very diverse architecture. If something falls, we have to fix it within 15 minutes. But in order to understand that the accident occurred, you need to monitor the project and respond to incidents. And how to do it?
I believe that there is trouble in organizing the right monitoring system. If there was no misfortune, then my speech consisted of one thesis: “Please install Prometheus + Grafana and plugins 1, 2, 3”. Unfortunately, now it does not work. And the main problem is that everyone continues to believe in something that existed in 2008, in terms of software components.
')
Regarding the organization of the monitoring system, I would venture to say that ... there are no projects with competent monitoring. And the situation is so bad, if something falls, there is a risk that it will go unnoticed - all are sure that "everything is monitored."
Perhaps everything is monitored. But how?
We all faced with a story like the following: some devops, some administrators work, the development team comes to them and says - “we have been releasing, now we are monitoring”. What monitors? How it works?
OK. We monitor in the old fashioned way. And it is already changing, and it turns out that you monitored service A, which became service B, which interacts with service C. But the development team tells you: “Put on the software, it should monitor everything!”
So what has changed? - Everything has changed!
2008 Everything is fine
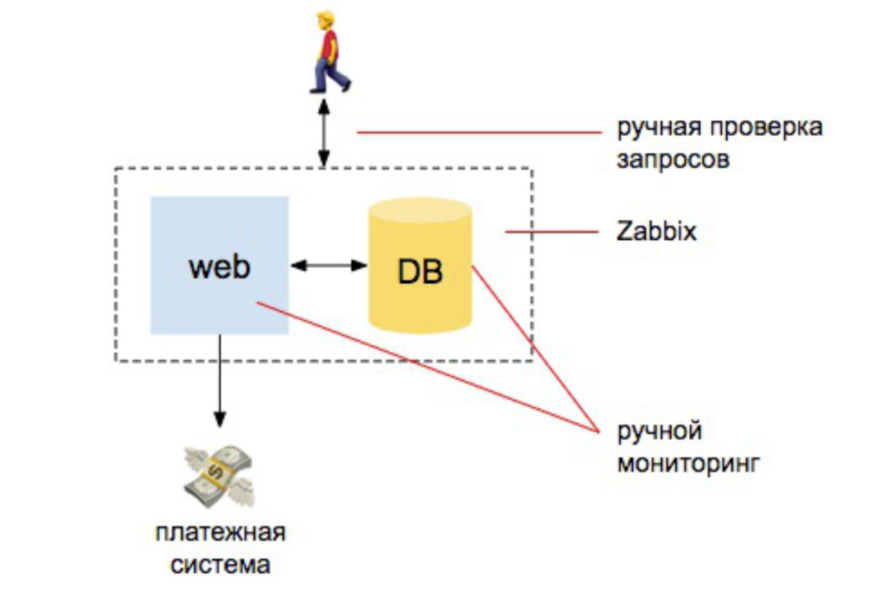
There are a couple of developers, one server, one database server. From here everything goes. We have some infa, we put zabbix, Nagios, cacti. And then we expose understandable alerts to the CPU, to work the disks, to the place on the disks. We also do a couple of manual checks that the site responds that orders come to the database. And that's all - we are more or less protected.
If you compare the amount of work that the admin did to ensure monitoring, then at 98% it was automatic: the person who is monitoring should understand how to install Zabbix, how to set it up and set up alerts. And 2% for external checks: that the site responds and makes a request to the database that new orders have arrived.
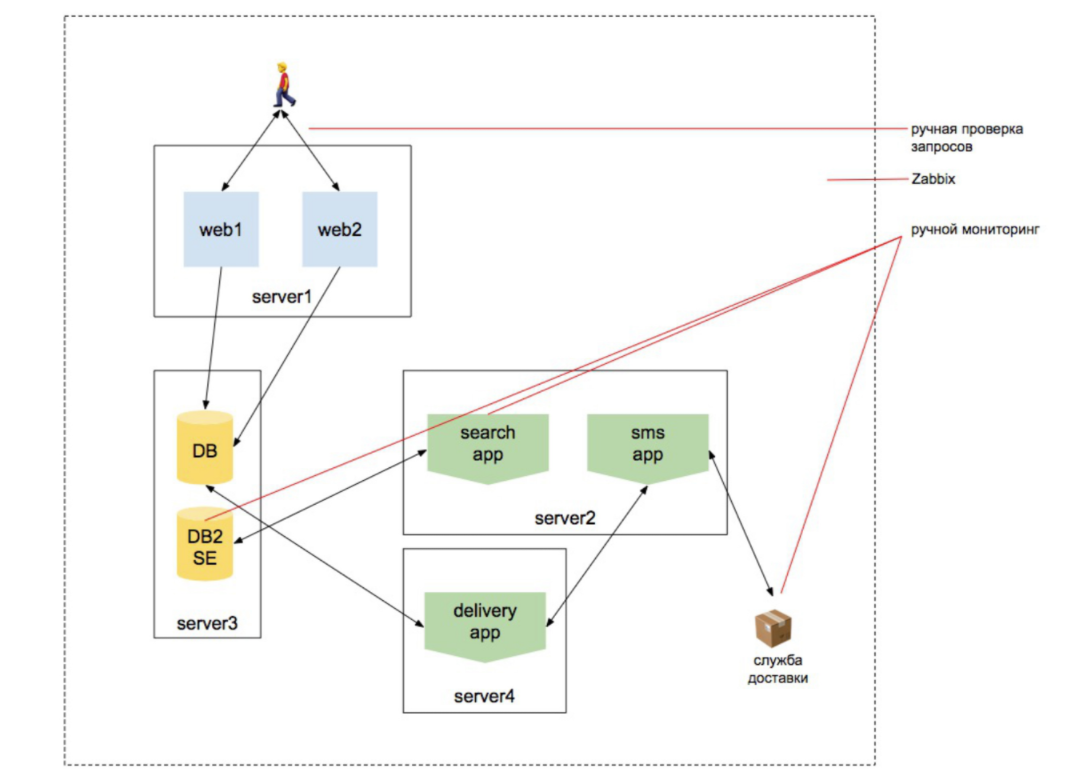
2010 Load increases
We are starting to scale the web, add a search engine. We want to be sure that the product catalog contains all products. And that the search for goods works. That the base works, that orders are made, that the site responds externally and responds from two servers and the user does not throw them out of the site while it is being rebalanced to another server, etc. Entities getting bigger.
Moreover, the essence of infrastructure, is still the largest in the head of the manager. As before, the idea that the person monitoring is sitting in his head is a person who installs zabbix and is able to configure it.
But at the same time, there are works on carrying out external checks, on creating a set of scripts for search indexer requests, a set of scripts to check that the search changes during the indexing process, a set of scripts that check that goods are delivered to the delivery service, etc. etc.

Note: I wrote a set of scripts 3 times. That is, the person responsible for monitoring is no longer the one who simply installs zabbix. This is a person who starts coding. But in the minds of the team, nothing has changed yet.
But the world is changing, complicating more and more. Added a layer of virtualization, several new systems. They begin to interact with each other. Who said “smacks of microservices?” But each service still looks separately like a site. We can turn to him and understand that he gives the necessary information and works by itself. And if you are an admin who has been constantly engaged in a project that has been developing for 5-7-10 years, you have accumulated this knowledge: a new level appears - you realize it, another level appears - you realize it ...
But rarely someone accompanies the project for 10 years.
Monitoring Monitoring Summary
Suppose you came to a new startup that immediately recruited 20 developers, wrote 15 microservices, and you are the admin who is told: “Build a CI / CD. Pozhaaaaluysta. You built a CI / CD and suddenly you hear: “It’s difficult for us to work with production in the“ cube ”, not understanding how the application will work in it. Make us a sandbox in the same "cube".
You make a sandbox in this cube. They immediately say to you: “We want to stage the database, which is updated every day from production, in order to understand that it works on the database, but at the same time not to spoil the production database”.
You live in it all. It remains 2 weeks before the release, you are told: "Now it would all monitore ..." Ie monitor the cluster infrastructure, monitor the microservice architecture, monitor the work with external services ...
And colleagues get such a familiar pattern from their heads and say: “So here everything is clear! Put the program, which is all monitored. " Yes, yes: Prometheus + Grafana + plugins.
And they add: “You have two weeks to do so that everything is safe.”
In a heap of projects that we see, one person is allocated for monitoring. Imagine that we want to hire a person for 2 weeks to monitor, and we make him a resume. What skills should this person have - if you take into account everything we said before?
- He must understand the monitoring and specifics of the work of the iron infrastructure.
- He must understand the specifics of monitoring Kubernetes (and everyone wants to be in the "cube", because you can disengage from everything, hide, because the admin will deal with the rest) - by itself, its infrastructure, and understand how to monitor applications inside.
- He must understand that services communicate with each other in special ways, and know the specifics of the interaction between services. It is quite realistic to see the project, where some of the services communicate synchronously, because there is no other way. For example, the backend goes through REST, via gRPC to the directory service, receives a list of goods and returns it. You can't wait here. And with other services, it works asynchronously. Transfer the order to the delivery service, send a letter, etc.
You probably already sailed from all this? And the admin who needs to monitor it, swam even more. - He should be able to plan and plan correctly - as work becomes more and more.
- He must, therefore, create a strategy from the created service in order to understand how this specifically monitors. He needs an understanding of the architecture of the project and its development + an understanding of the technologies used in the development.
Recall an absolutely normal case: part of services on php, part of services on Go, part of services on JS. They somehow work among themselves. Hence the term "microservice": there are so many separate systems that developers can not understand the project as a whole. One part of the team writes services on JS, which work by themselves and do not know how the rest of the system works. The other part writes services in Python and does not go into how other services work, they are isolated in their field. The third - writes services on php or something else.
All these 20 people are divided into 15 services, and there is only one admin who must understand all this. Stop! we have just broken the system into 15 microservices, because 20 people cannot understand the whole system.
But it must somehow monitored ...
What is the result? As a result, there is one person to whom everything that a whole team of developers cannot understand, and yet he should know and be able to do what we have indicated above - iron infrastructure, Kubernetes infrastructure, etc.
What can I say ... Houston, we have problems.
Monitoring a modern software project is a software project in itself.
From the false certainty that monitoring is software, we have faith in miracles. But miracles, alas, does not happen. You can not put zabbix and wait for everything to work. It makes no sense to put Grafana and hope that everything will be ok. Most of the time will be spent on the organization of inspections of the services and their interaction with each other, checks how external systems work. In fact, 90% of the time is spent not on writing scripts, but on developing software. And it must deal with a team that understands the work of the project.
If in this situation one person is thrown on monitoring, then trouble will happen. What is happening everywhere.
For example, there are several services that communicate with each other through Kafka. The order came, we sent a message about the order to Kafka. There is a service that listens to order information and ships the goods. There is a service that listens to order information and sends a letter to the user. And then a bunch of services appear, and we start to get confused.
And if you still give it to the admin and developers at a stage when a short time is left before the release, the person will need to understand the whole protocol. Those. A project of this scale takes considerable time, and this should be incorporated into the development of the system.
But very often, especially in burning, in startups, we see monitoring being postponed for later. “Now we will make the Proof of Concept, we will start with it, let it fall - we are ready to sacrifice. And then we all monitored. " When (or if) the project starts to make money, the business wants to cut even more features - because it started working, it means you need to wind up further! And you are at the point where you first need to monitor all the previous, which takes not 1% of the time, but much more. And by the way, the developers will need to be monitored, and it is easier to put them on new features. As a result, new features are written, everything is wound up, and you are in an endless deadlock.
So how to monitor the project, starting from the beginning, and what to do if you got a project that needs to be monitored, and you do not know where to start?
First, you need to plan.
Lyrical digression: very often start with monitoring infrastructure. For example, we have Kubernetes. To begin with, we will install Prometheus with Grafana, we will install plugins under the “cube” monitoring. Not only developers, but admins also have a regrettable practice: "We will install this plugin, and the plugin probably knows how to do it." People love to start with simple and clear, and not with important actions. And monitoring infrastructure is easy.
First, decide what and how you want to monitor, and then pick up a tool, because other people cannot think for you. Yes, and should? Other people thought about themselves, about the universal system - or did not think at all when they wrote this plugin. And the fact that this plugin has 5 thousand users does not mean that it carries some kind of benefit. Perhaps you will become the 5001st simply because there were already 5,000 people there before.
If you start monitoring the infrastructure and your application’s backend stops responding, all users will lose touch with the mobile application. An error will crash. They will come to you and say, “The application does not work, what are you doing here?” - “We are monitoring.” - “How do you monitor if you do not see that the application is not working?”
- I believe that it is necessary to start monitoring from the user's entry point. If the user does not see that the application is working - everything is a failure. And the monitoring system should warn about this first.
- And only then can we monitor the infrastructure. Or do it in parallel. The infrastructure is simpler - here, finally, we can simply install zabbix.
- And now you need to go to the roots of the application to understand where that does not work.
My main thought is that monitoring should go hand in hand with the development process. If you have torn off the monitoring team for other tasks (creating a CI / CD, sandboxes, reorganizing the infrastructure), monitoring will start to fall behind and you may never catch up with the development (or sooner or later you will have to stop it).
All levels
This is how I see the organization of the monitoring system.
1) Application Level:
- monitoring the business logic of the application;
- monitoring health metrics of services;
- integration monitoring.
2) Infrastructure level:
- orchestration level monitoring;
- system software monitoring;
- monitoring the level of "iron".
3) Again, the application level - but already as an engineering product:
- collection and monitoring of application logs;
- APM;
- tracing.
4) Alerting:
- organization of the warning system;
- organization of the duty system;
- organization of a “knowledge base” and incident handling workflow.
Important : we reach alert not after, but immediately! You do not need to start monitoring and “somehow later” invent who will receive alerts. After all, what is the task of monitoring: to understand where something is wrong in the system, and let the right people know about it. If this is left at the end, then the right people will find out that something is going wrong, just by calling "nothing works for us."
Application Tier - Business Logic Monitoring
Here we are talking about checks of the fact that the application works for the user.
This level must be made at the design stage. For example, we have a conditional Prometheus: it climbs to the server that deals with the checks, pulls the endpoint, and the endpoint goes and checks the API.
When they often ask to monitor the main page to make sure that the site is working, programmers give a handle that can be pulled every time you need to make sure that the API is working. And programmers at this moment still take and write / api / test / helloworld
The only way to make sure everything works? - Not!
- The creation of such checks - in fact, the task of developers. Unit tests should be written by programmers who write code. Because if you merge it on the admin "Dude, here's a list of API protocols for all 25 functions, please, monitor everything!" - nothing happens.
- If you print “hello world”, no one will ever know that the API should and does work. Every API change should lead to a change of checks.
- If you already have such a misfortune, stop the features and highlight the developers who write these checks, or accept the losses, accept that nothing is checked and will fall.
Technical Tips:
- Be sure to organize an external server to organize inspections - you must be sure that your project is available to the outside world.
- Organize a check on the entire API protocol, and not just on individual endpoint.
- Create a prometheus-endpoint with the results of the checks.
Application Level - Monitoring Health Metrics
Now we are talking about external health metrics of services.
We decided that all the “handles” of the application are monitored using external checks that we call from the external monitoring system. But these are the “pens” that the user “sees”. We want to be sure that the services themselves work for us. Here, the story is better: in K8s there are health checks, so that at least the “cube” itself is convinced that the service is working. But half the checks I saw are the same print “hello world”. Those. he jerks once after the deployment, he replied that everything is fine and that’s all. And the service, if the rest-ohm issues its API, there is a huge number of entry points of the API itself, which also needs to be monitored, because we want to know that it works. And we monitor it already inside.
How to implement this technically correctly: each service puts an endpoint on its current performance, and in the graphs of Grafana (or any other application) we see the status of all services.
- Every API change should lead to a change of checks.
- Create a new service immediately with health metrics.
- The admin can come to the developers and ask "add me a couple of features so that I understand everything and add information about it to my monitoring system." But developers usually respond, “Two weeks before the release, we will not add anything.”
Let development managers know that there will be such losses, let the development managers know that too. Because when everything falls, someone will call anyway and demand that the “permanently falling service” be monitored (c) - By the way, highlight the developers to write plug-ins for Grafana — this will be a good help for admins.
Application Level - Integration Monitoring
Integration monitoring focuses on monitoring communication between business-critical systems.
For example, there are 15 services that communicate with each other. These are no longer separate sites. Those. we can not pull the service by itself, get / helloworld and understand that the service is working. Because the web service for placing an order must send order information to the bus — the warehouse service must receive this message from the bus and work with it further. And the e-mail service should process it somehow further, and so on.
Accordingly, we can not understand, poking into each individual service that it all works. Because we have a kind of bus through which everything communicates and interacts.
Therefore, this stage should mark the stage of testing services for interaction with other services. It is impossible, by monitoring a message broker, to organize monitoring of communication. If there is a service that provides data, and a service that receives them, when monitoring a broker, we will only see data that flies from side to side. Even if we somehow managed to monitor the interaction of this data inside - that a certain producer would post the data, someone reads it, this stream continues to go to Kafka - it still does not give us information if one service gave the message in one version, but another service did not expect this version and missed it. We will not know about this, because the services will tell us that everything works.
As I recommend doing:
- For synchronous communication: endpoint performs requests for related services. Those. we take this endpoint, pull the script inside the service that goes to all points and says “I can pull there and pull there, I can pull there ...”
- For asynchronous communication: incoming messages - endpoint checks the bus for test messages and provides processing status.
- For asynchronous communication: outgoing messages - endpoint sends test messages to the bus.
As usually happens: we have a service that throws data into the bus. We come to this service and ask to tell about its integrative health. And if the service has to sell some message somewhere further (WebApp), then it will produce this test message. And if we pull the service on the side of OrderProcessing, he will first post what he can post independent, and if there are any dependent things, he reads a set of test messages from the bus, realizes that he can process them, report about it and , if necessary, post them further, and about it he says - everything is OK, I'm alive.
Very often we hear the question “how can we test this on combat data?” For example, we are talking about the same order service. The order sends messages to the warehouse where the goods are written off: we cannot test this on the combat data, because “my goods will be written off!” Exit: at the initial stage, plan this entire test. You have unit tests that make mock-and. So, do it at a deeper level, where you will have a communication channel that does not hurt the business.
Infrastructure level
Infrastructure monitoring is something that has long been considered monitoring itself.
- Infrastructure monitoring can and should be run as a separate process.
- You should not start with monitoring the infrastructure on a running project, even if you really want to. This is a sore for all devops. “First, the monitors cluster, the monitors infrastructure” - i.e. At first, it will zamonitit what lies below, but it will not get into the application. Because the application - incomprehensible thing for devops. He leaked it, and he does not understand how it works. And he understands the infrastructure and starts with it. But no - you always need to monitor the application first.
- Do not overdo it with the number of alerts. Given the complexity of modern systems, alerts are flying all the time, and with this bunch of alerts you have to somehow live. And the on-call person, looking at a hundred consecutive alerts, decides "I don't want to think about it." Alerts should notify only critical things.
Application tier as a business unit
Key points:
- ELK. This is an industry standard. If for some reason you do not aggregate the logs, immediately start doing it.
- APM. External APM as a way to quickly close monitoring applications (NewRelic, BlackFire, Datadog). You can temporarily put this thing in order to somehow understand what is happening with you.
- Tracing. In dozens of microservices you have to treys everything, because the request no longer lives by itself. Writing later is very difficult, so it’s better to immediately plan tracing in development - this is the job and the utility of the developers. If you have not yet implemented - implement! See Jaeger / Zipkin
Alerting
- Organization of the alert system: in terms of monitoring the pile of things, there should be a unified alert distribution system. It is possible in Grafana. In the West, everyone uses PagerDuty. Alerts should be clear (for example, where they came from ...). And it is desirable to control that alerts generally reach
- Organization of the duty system: no alerts should come to everyone (either they will all respond to the crowd, or no one will respond). Oncall also needs to be developers: be sure to define areas of responsibility, make clear instructions and write in it, who specifically to call on Monday and Wednesday, and to whom on Tuesday and Friday (otherwise they won't call anyone even in case of big trouble - they will be afraid to wake up, disturb : people generally do not like to call and wake other people, especially at night). And explain that asking for help is not an indicator of incompetence (“I ask for help, it means I'm a bad worker”), encourage requests for help.
- Organization of a “knowledge base” and incident handling workflow: for each serious incident, postmortem should be planned, as a temporary measure actions should be recorded that will solve the incident. And start the practice that repeating alerts is a sin; they should be fixed in code or infrastructure works.
Technology stack
Let's imagine that we have the following stack:
- data collection - Prometheus + Grafana;
- log analysis - ELK;
- for APM or Tracing - Jaeger (Zipkin).
The choice of options is not critical. Because if at the beginning you understood how to monitor the system and painted a plan, then you start to choose the tools for your requirements. The question is, what did you choose to monitor at the beginning? Because, perhaps, the tool that you chose at the beginning - it does not fit your requirements at all.
A few technical points that I see everywhere lately:
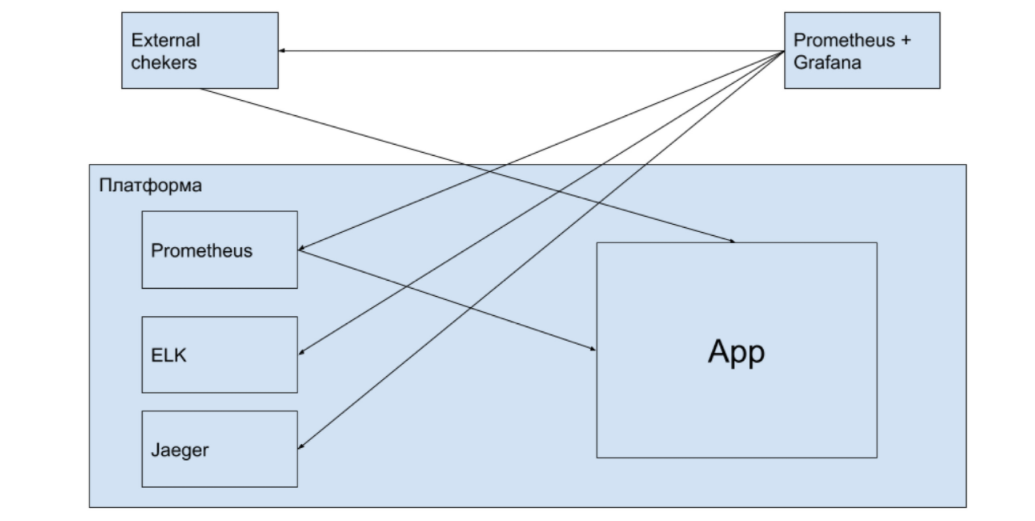
Prometheus is shoved inside Kubernetes - who thought it up ?! If your cluster falls, what will you do? If you have a complex cluster inside, then a certain monitoring system inside the cluster should work, and some - from the outside, which will collect data from inside the cluster.
Inside the cluster we collect logs and everything else. But the monitoring system should be outside. Very often in a cluster where there is Promtheus, which is placed inside, there are also systems that do external checks of the site. And if your connections to the outside world have fallen and the application does not work? It turns out that everything inside you is good, but this is not easier for users.
findings
- The development of monitoring is not the installation of utilities, but the development of a software product. 98% of today's monitoring is coding. Coding in services, coding external checks, checking external services, and all-all-all.
- Take the time of the developers to monitor: it can take up to 30% of their work, but worth it.
- Devopsy, do not worry that you do not get something to monitor, because some things - it is generally a different mindset. You were not a programmer, and the work of monitoring is their work.
- If the project is already working and not monitors (and you are the manager) - allocate resources for monitoring.
- If the product is already in production, and you are the devops who were told to “set up monitoring”, try to explain to the management what I wrote all this about.
This is an extended version of the report at the Saint Highload ++ conference.
If you are interested in my ideas and thoughts on it and near-that-topic, then you can read the channel :-)
Source: https://habr.com/ru/post/448602/
All Articles