We are looking for memory leaks in Python applications
¡Hola! We are continuing a series of publications dedicated to the launch of the course “Web Developer in Python” and right now are sharing with you the translation of another interesting article.
At Zendesk, we use Python to create machine-learning products. In machine learning applications, one of the most common problems we have encountered is memory leakage and spikes. Python code is usually executed in containers using distributed processing frameworks such as Hadoop , Spark, and AWS Batch . Each container is allocated a fixed amount of memory. As soon as the code execution exceeds the specified memory limit, the container will stop its work due to errors caused by insufficient memory.

')
You can quickly fix the problem by allocating more memory. However, it can waste resources and affect application stability due to unpredictable memory surges. Causes of memory leaks may be as follows :
A useful practice is to profile the use of memory by applications to gain a better understanding of the efficient use of code space and the packages used.
This article covers the following aspects:
Memory profiling over time
You can take a look at variable memory usage during the execution of a Python program using the memory-profiler package.
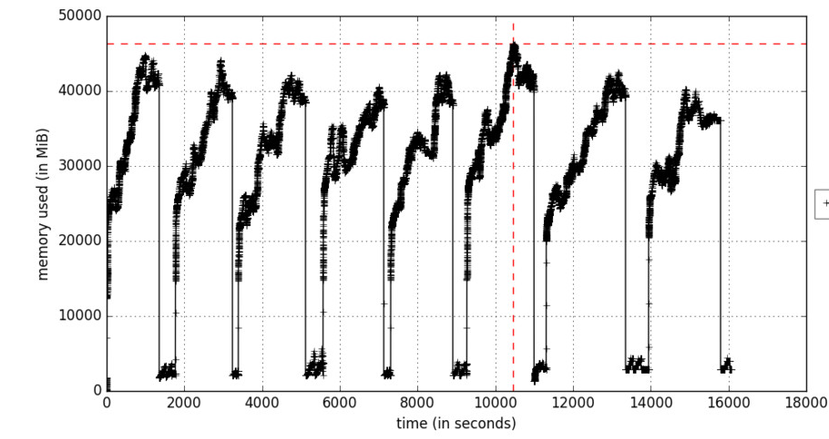
Figure A. Memory profiling as a function of time
The include-children parameter will include the use of memory by any child processes spawned by parent processes. Figure A reflects an iterative learning process that causes memory increases in cycles at the times when the training data packets are processed. Objects are deleted during garbage collection.
If memory usage is constantly increasing, it is considered a potential threat of a memory leak. Here is a sample code reflecting this:
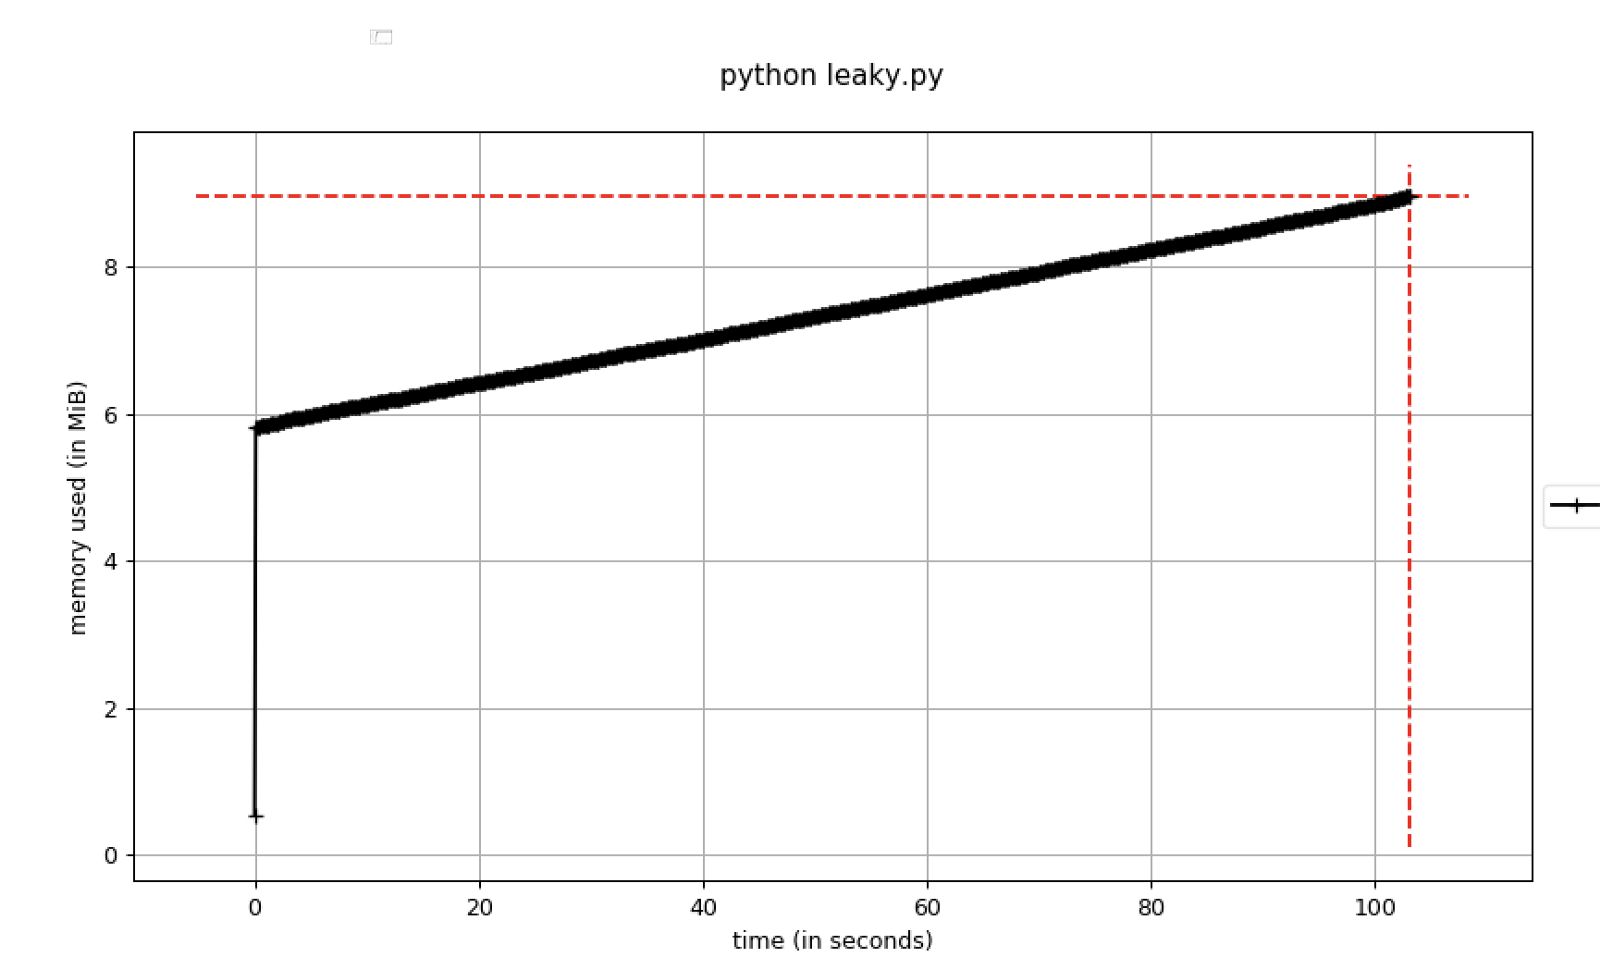
Figure B. Memory usage increasing over time.
You should set breakpoints in the debugger as soon as the memory usage exceeds a certain threshold. To do this, you can use the pdb-mmem parameter , which is useful during troubleshooting.
Memory dump at a specific point in time
It is useful to estimate in advance the expected number of large objects in the program and whether they should be duplicated and / or converted to different formats.
For further analysis of objects in memory, you can create a dump-heap in certain lines of the program using muppy .
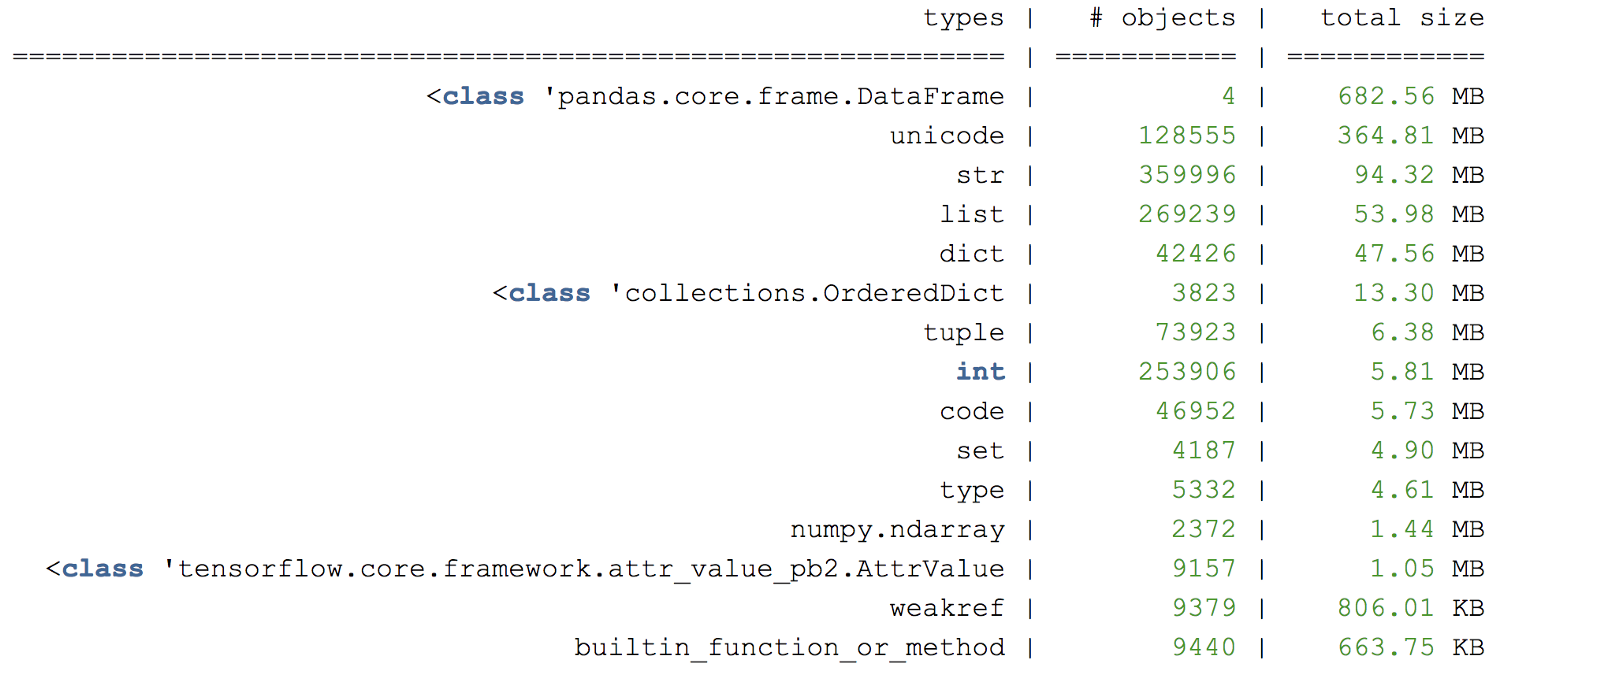
Figure C. Example dump-heap summary
Another useful library for memory profiling is objgraph , which allows you to generate graphs to check the origin of objects.
Useful pointers
A useful approach is to create a small “test case” that runs the appropriate code causing a memory leak. Consider using a subset of randomly selected data if full input data is deliberately long processed.
Executing tasks with a large memory load in a separate process
Python does not necessarily release the memory immediately for the operating system. To make sure that the memory has been freed, after executing the code snippet, it is necessary to start a separate process. More information about the garbage collector in Python can be found here .
The debugger can add links to objects.
If a breakpoint debugger such as pdb is used , all created objects that the debugger manually refers to will remain in memory. This can create a false sense of memory leakage, since objects are not deleted in a timely manner.
Beware of packages that may cause memory leaks.
Some libraries in Python could potentially cause a leak, for example
Have a nice leak hunt!
Useful links:
docs.python.org/3/c-api/memory.html
docs.python.org/3/library/debug.html
Write in the comments if this article was helpful to you. And those who want to learn more about our course, we invite you to the open day , which will be held on April 22.
At Zendesk, we use Python to create machine-learning products. In machine learning applications, one of the most common problems we have encountered is memory leakage and spikes. Python code is usually executed in containers using distributed processing frameworks such as Hadoop , Spark, and AWS Batch . Each container is allocated a fixed amount of memory. As soon as the code execution exceeds the specified memory limit, the container will stop its work due to errors caused by insufficient memory.
')
You can quickly fix the problem by allocating more memory. However, it can waste resources and affect application stability due to unpredictable memory surges. Causes of memory leaks may be as follows :
- Protracted storage of large objects that are not removed;
- Cyclic links in the code;
- Base libraries / C extensions leading to memory leaks;
A useful practice is to profile the use of memory by applications to gain a better understanding of the efficient use of code space and the packages used.
This article covers the following aspects:
- Profiling application memory usage over time;
- How to check the memory usage in a certain part of the program;
- Tips for debugging errors caused by memory problems.
Memory profiling over time
You can take a look at variable memory usage during the execution of a Python program using the memory-profiler package.
# install the required packages pip install memory_profiler pip install matplotlib # run the profiler to record the memory usage # sample 0.1s by defaut mprof run --include-children python fantastic_model_building_code.py # plot the recorded memory usage mprof plot --output memory-profile.png Figure A. Memory profiling as a function of time
The include-children parameter will include the use of memory by any child processes spawned by parent processes. Figure A reflects an iterative learning process that causes memory increases in cycles at the times when the training data packets are processed. Objects are deleted during garbage collection.
If memory usage is constantly increasing, it is considered a potential threat of a memory leak. Here is a sample code reflecting this:
Figure B. Memory usage increasing over time.
You should set breakpoints in the debugger as soon as the memory usage exceeds a certain threshold. To do this, you can use the pdb-mmem parameter , which is useful during troubleshooting.
Memory dump at a specific point in time
It is useful to estimate in advance the expected number of large objects in the program and whether they should be duplicated and / or converted to different formats.
For further analysis of objects in memory, you can create a dump-heap in certain lines of the program using muppy .
# install muppy pip install pympler # Add to leaky code within python_script_being_profiled.py from pympler import muppy, summary all_objects = muppy.get_objects() sum1 = summary.summarize(all_objects) # Prints out a summary of the large objects summary.print_(sum1) # Get references to certain types of objects such as dataframe dataframes = [ao for ao in all_objects if isinstance(ao, pd.DataFrame)] for d in dataframes: print d.columns.values print len(d) Figure C. Example dump-heap summary
Another useful library for memory profiling is objgraph , which allows you to generate graphs to check the origin of objects.
Useful pointers
A useful approach is to create a small “test case” that runs the appropriate code causing a memory leak. Consider using a subset of randomly selected data if full input data is deliberately long processed.
Executing tasks with a large memory load in a separate process
Python does not necessarily release the memory immediately for the operating system. To make sure that the memory has been freed, after executing the code snippet, it is necessary to start a separate process. More information about the garbage collector in Python can be found here .
The debugger can add links to objects.
If a breakpoint debugger such as pdb is used , all created objects that the debugger manually refers to will remain in memory. This can create a false sense of memory leakage, since objects are not deleted in a timely manner.
Beware of packages that may cause memory leaks.
Some libraries in Python could potentially cause a leak, for example
pandas has several known memory leak problems.Have a nice leak hunt!
Useful links:
docs.python.org/3/c-api/memory.html
docs.python.org/3/library/debug.html
Write in the comments if this article was helpful to you. And those who want to learn more about our course, we invite you to the open day , which will be held on April 22.
Source: https://habr.com/ru/post/448474/
All Articles