From process modeling to designing an automated system (Part 2)
“One day in the life of a squirrel” or from modeling processes to designing an automated system for accounting of material values “Belka-1.0” (Part 2)
Summary of the previous series
In the first part, we used the "fairy tale" subject area, inspired by examples of studying UML diagrams based on fairy tale plots (see, for example, here [1]). Before the start of modeling, we agreed on the use of some elements of the Activity chart and began to form a modeling agreement. Taking into account these agreements, at the 1st stage we described the process in the form of Activity diagrams, and at the 2nd stage we identified the process steps for which automation is required (and is possible).
Let me remind you that we are going to automate the activity on accounting of material values, which arises in these processes.
...
An island on the sea lies, (E1, E2)
Hail on an island stands (E3, E1)
With golden-headed churches, (E4)
With towers and gardens; (E5, E6)
Spruce grows in front of the palace, (E7, E8)
And under it a crystal house; (E9)
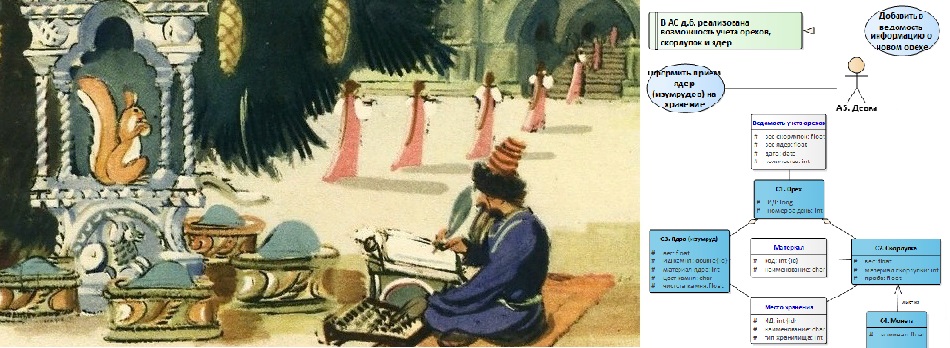
Squirrel lives there manual, (A1)
Yes, what a joke! (A1)
Squirrel sings songs, (P1, A1)
Yes, nuts nibble everything, (P2)
And nuts are not simple, (C1)
All shells are gold, (C2)
The kernels are pure emerald; (C3)
The servants of the squirrel guard, (P3, A2)
Serve her as a domestic servant (P4)
And assigned clerk mandative (A3)
Strict account nuts; (P5, C1)
Gives her an honor army; (P6, A4)
From the shell pour a coin, (P7, C2, C4)
Yes float around the world; (P8)
Girls pour emerald (P9, A5, C3)
In the storerooms, but under the bushel; (E10, E11)
...
(A.S. Pushkin, "The Tale of Tsar Saltan, of his son, the glorious and mighty warrior, Prince Gvidon Saltanovich, and of the beautiful Princess Swans," is believed to be a freestyle treatment of the folk tale "Knee-high in gold, elbowed in silver" which was recorded by Pushkin in various ways )
In this example, I use the Enterprise Architect environment from the Australian company Sparx Systems [2], and in the classroom I apply Modelio [3].
Let me remind you that the processes are different, you can get acquainted, for example, here [4] and here [5].
For more information on the applied approaches to modeling and design, see [6, 7].
See the full UML specification here [8].
Now we are ready to proceed to the next steps and begin designing the functions of the system and its internal organization. The numbering of the drawings will continue.
Stage 3. The step to be automated should be assigned to the function or functions of the system
The developed automated system (AS) is designed to maintain strict accounting of nuts, remember? For each selected step (see Figure 3, Figure 4 in the 1st part ), which we will automate, we will write down the functional requirement, applying approximately such a construction “The opportunity should be realized in the system ...” and we will develop a Use-case diagram. Now we are actually complementing our modeling agreement with new rules. I will explain what elements we will use.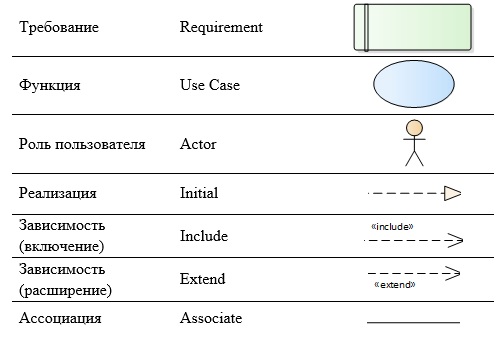
Between the “User Role” and the “Function” we will use the “Association” link (Figure 5), this means that this function is available for the user with this role.

Figure 5. Using association type association
From the “Function” to the “Requirement” we will conduct the “Implementation” link (Figure 6) to show that this requirement will be realized by these functions; the relation may be “many-to-many”, i.e. one function may participate in the implementation of several requirements, and more than one function may be needed to implement the requirement.
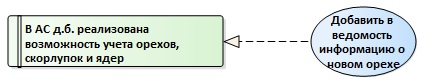
Figure 6. Using the implementation link
If one function requires for its execution, that another function is to be performed, and it is mandatory, we will use the “Dependency” connection with the “Include” stereotype - inclusion (Figure 7). If, however, the performance of an additional function is required under certain conditions, then we will use the relationship “Dependency” with the stereotype “Extend” - extension. Everything is very easy to remember: “Include” is ALWAYS, and “Extend” is ALWAYS.

Figure 7. Using a Dependency (Enable) connection
As a result, our diagram will look something like this (Figure 8).
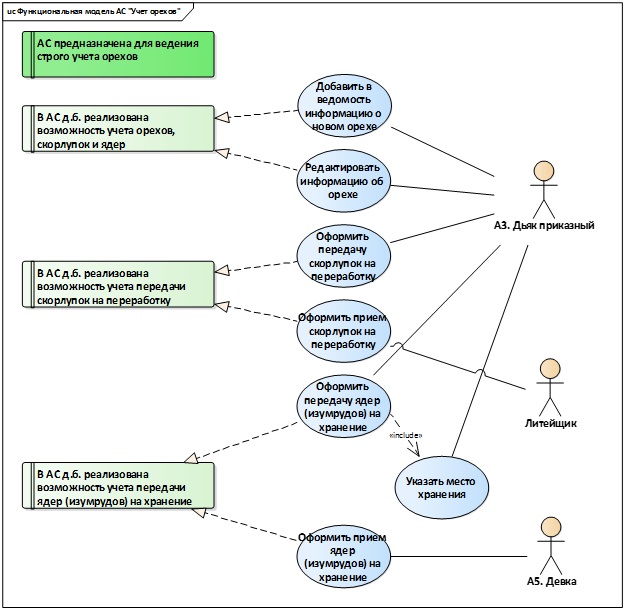
Figure 8. Use-case diagram (functional model of the AU)
In addition, the Use-case diagram is used to simulate user roles (Figure 9).

Figure 9. Use-case diagram (roles of users of the AU)
Step 4. Describe the internal organization of the AU using the class diagram
Using information about the input and output artifacts of our process (see Activity diagrams - Figure 2, Figure 3, Figure 4), we will develop a class diagram. We will use the modeling “Class” elements and various types of connections between them.

To show the “whole-part” relationship, we will use the “Aggregation” link (Figure 10): a nut is a whole, and the shells and the core are parts.

Figure 10. Integer-part relationship
As a result, a fragment of our diagram will look something like this (Figure 11). The color marks the classes that we highlighted directly in the textual description of the process.

Figure 11. Class diagram
The class diagram was also used to model other artifacts - not only those that will be relevant to the conceptual model of the automated material values accounting process, but also related to the execution environment - the environment (Figure 12) and “neighboring” processes (Figure 13) that can influence the automated process, but are not yet in the focus of our attention (we assume that the system will evolve, and this information will be useful).

Figure 12. Class diagram (environment)
Relationship inheritance shows a generalization of various buildings, "child" classes, under the generalized "parent" class "Structure".

Figure 13. Class diagram (additional information about artifacts)
“Reaction to the situation” depends on the “Visual Control Data”. For several dependency relationships, the “trace” stereotype is used to show the trace of classes that are not explicitly indicated in the process description, but which are necessary for its automation, to the classes for which instances there is an exact indication in our description.
Step 5. Analyze the notes on the track "Business Rules"
The following rules were indicated (see Figure 2 in the 1st part ):
- the need to split one of the steps into 2 parts, the second part starts to be performed only under certain conditions;
- an appointment to carry out the accounting of nuts of a certain official;
- a technique (white color of elements), which indicates that the element was not clearly indicated in the process description.
It should be noted that we have already used all these rules when designing diagrams.
Concluding remarks
So, we have passed 5 stages and built 3 types of diagrams. I will add another small comment about the organization of our models in the modeling environment. There are a large number of frameworks that help structure the models being developed, but this is not the subject of this article, so we will limit ourselves to the following simple set of packages for the orderly management of our project: Business process, Functional model, Artifacts, Participants and Environment (Figure 14).
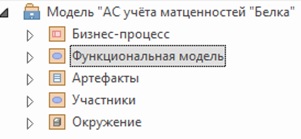
Figure 14. Project package structure
Thus, we have developed consistent models that describe a system of accounting for material values from various angles: a model of an automated business process, a functional model, and a model of the internal organization of the system at a conceptual level.
From process modeling to designing an automated system (Part 1)
- Site "UML2.ru". Forum of the Community of Analysts. General section. Examples Examples of fairy tales, designed in the form of UML diagrams. [Electronic resource] Access mode: Internet: http://www.uml2.ru/forum/index.php?topic=486.0
- Sparx Systems website. [Electronic resource] Access mode: Internet: https://sparxsystems.com
- Website Modelio. [Electronic resource] Access mode: Internet: https://www.modelio.org
- Big Encyclopedic Dictionary. Process (interpretation). [Electronic resource] Access mode: Internet: https://dic.academic.ru/dic.nsf/enc3p/246322
- Site "Organization of effective management." Blog. Heading "Business Process Management". Business process definition. [Electronic resource] Access mode: Internet: https://rzbpm.ru/knowledge/pochemu-processy-stali-s-pristavkoj-biznes.html
- Certificate No. 18249 on registration and deposit of the work of the result of intellectual activity. Alfimov R.V., Zolotukhina E.B., Krasnikova S.A. The manuscript of the educational-methodical manual called "Modeling the subject area using Enterprise Architect" // 2011.
- Zolotukhina EB, Vishnya AS, Krasnikova S.A. Business process modeling. - M .: COURSE, SEC INFRA-M, EBS Znanium.com. - 2017.
- OMG Unified Modeling Language (OMG UML) Specification. Version 2.5.1. [Electronic resource] Access mode: Internet: https://www.omg.org/spec/UML/2.5.1/PDF
')
Source: https://habr.com/ru/post/448186/
All Articles