From process modeling to designing an automated system (Part 1)
“One day in the life of a squirrel” or from modeling processes to designing an automated system for accounting of material values “Belka-1.0” (Part 1)
What does the "protein"?
Immediately explain what's the "protein". Stumbling on the Web for fun projects to study UML based on the subject area, borrowed from fairy tale plots (for example, here [1]), I also decided for my students to prepare a similar example so that you can study for the beginning only three types of diagrams: Activity Diagram, Use-case Diagram and Class Diagram. I deliberately do not translate the names of diagrams into Russian in order to avoid disputes about the “difficulties of translation”. What for what - I will explain a little later. In this example, I use the Enterprise Architect environment from Australian company Sparx Systems [2] - a good tool for reasonable money. And as part of the training sessions, I use Modelio [3], a good free object-oriented design tool that supports the UML2.0 and BPMN standards, without unnecessary frills in terms of visual capabilities, but quite sufficient for learning the basics of the language.
We are going to automate the activity on accounting of material values, which arises in these processes.
...
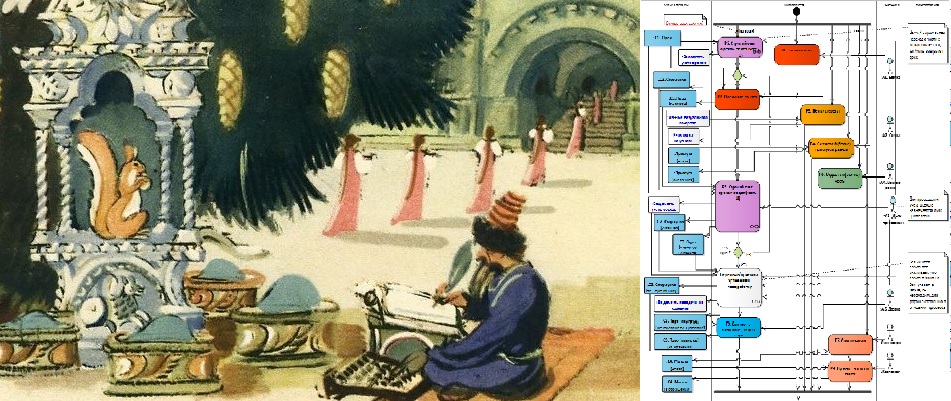
An island on the sea lies, (E1, E2)
Hail on an island stands (E3, E1)
With golden-headed churches, (E4)
With towers and gardens; (E5, E6)
Spruce grows in front of the palace, (E7, E8)
And under it a crystal house; (E9)
Squirrel lives there manual, (A1)
Yes, what a joke! (A1)
Squirrel sings songs, (P1, A1)
Yes, nuts nibble everything, (P2)
And nuts are not simple, (C1)
All shells are gold, (C2)
The kernels are pure emerald; (C3)
The servants of the squirrel guard, (P3, A2)
Serve her as a domestic servant (P4)
And assigned clerk mandative (A3)
Strict account nuts; (P5, C1)
Gives her an honor army; (P6, A4)
From the shell pour a coin, (P7, C2, C4)
Yes float around the world; (P8)
Girls pour emerald (P9, A5, C3)
In the storerooms, but under the bushel; (E10, E11)
...
(A.S.Pushkin "Tale of Tsar Saltan, of his son, the glorious and mighty warrior Prince Gvidon Saltanovich, and of the beautiful princess Swans" Pushkin "(part III, 1832, pp. 130-181) - 10 years from concept to publication, by the way!)
A bit about the codes that are written to the right of the lines. “A” (from “Actor”) means that the line contains information about the participant in the process. “C” (from “Class”) - information about class objects that are processed during the execution of processes. “E” (from “Environment”) - information about the objects of classes that characterize the environment of the process. “P” (from “Process”) - information about the processes themselves.
By the way, the exact definition of the process also claims to be the cause of methodological disputes, if only because the processes are different: business, industrial, technological, etc. etc. (You can read, for example, here [4] and here [5]). To avoid controversy, we will agree that we are interested in the process in terms of its repeatability over time and the need for automation , i.e. shifting the execution of any part of the process operations to an automated system.
Activity Chart Application Notes
Let's start modeling our process and use the Activity diagram for this. First, I will explain how the above codes will be used in the model. It is easier to explain with a graphic example, and at the same time we will analyze some (almost all of the elements of the Activity diagram that we need).
Let's analyze the following fragment:
...
Squirrel sings songs, (P1, A1)
Yes, nuts nibble everything, (P2)
And nuts are not simple, (C1)
All shells are gold, (C2)
The kernels are pure emerald; (C3)
...
We have two steps of process P1 and P2, participant A1, and objects of three different classes: an object of class C1 enters the input of a step, objects of classes C2 and C3 are obtained as an output as a result of the activity of this step P2 of our process. For the diagram use the following modeling elements.

A fragment of our process can be represented something like this (Figure 1).

Figure 1. Fragment of the Activity Chart
For organizing the space and structuring the Activity diagram, we apply a not quite standard approach, in terms of the classic use of UML notation. But there are several reasons for this. First, just before the start of the simulation, we will draw up a so-called modeling agreement , in which we will fix all the features of using the notation. Secondly, this approach was repeatedly successfully applied at the stage of business modeling in real projects to create software systems, the results were recorded by our small team of authors in the corresponding copyright object [6], and also used in the training manual [7]. For the Activity diagram, we define that the diagram field is structured using the “swim lanes” - Swim lanes. The track name will correspond to the type of chart elements that will be placed on this track.
"Input and output artifacts": Objects elements will be placed on this track - objects that are used or are the result of performing a certain process step.
"Steps of the process": here we put the elements of the Activity - the actions of participants in the process.
"Participants": the track for the elements that will denote the roles of executors of actions in our process, for them we will use the same modeling element Object - an object, but we will add to it the stereotype "Actor".
The next track is called “Business Rules” and on this track we place in the text form the rules for executing the steps of the process, and we will use for this purpose the modeling element Note - note.
We will stop here, although in addition one could still use the “Tools” track to collect information about the level of process automation. The track “Positions and Subdivisions of Participants” can still be useful, it can be used to link roles with posts and divisions of participants in the process.
All that I have just described is a fragment of a modeling agreement ; this part of the agreement concerns the rules for organizing a single diagram and, accordingly, the rules for writing and reading it.
"Recipe"
Now we will consider the option of modeling the system from the Activity diagram. This is only one of the options, I note that he, of course, is not the only one. Activity diagram will interest us from the point of view of its role for the transition from process modeling to the design of an automated system. To do this, we will follow the guidelines - a kind of recipe, consisting of only five stages and providing for the development of only three types of diagrams. The application of this recipe will help to get a formalized description of the process that we want to automate, and collect data for system design. And for students at the beginning of the study, UML is a kind of lifeline that will not allow them to drown in the whole variety of graphic tools and techniques that exist in UML and modern modeling tools.
Here, in fact, is the recipe itself, followed by diagrams constructed for our “fairy tale” subject area.
Stage 1. We describe the process in the form of an Activity diagram. For a process in which more than 10 steps are highlighted, it makes sense to apply the principle of decomposition of the steps of the process in order to increase the readability of the diagram.
Step 2. Select what can be automated (steps can be, for example, highlighted in the diagram).
Stage 3. The automated step needs to be associated with a function or system functions (the relationship may be many-to-many), draw a Use-case diagram. These are the functions of our system.
Stage 4. We describe the internal organization of the AU using the class diagram - Class. Swimming track "Input and output objects (documents)" in the diagram Activity is the basis for constructing an object model and an entity-relationship model.
Stage 5. We will analyze the notes on the track “Business Rules” , they give various kinds of restrictions and conditions, gradually transforming into non-functional requirements.
The resulting set of diagrams (Activity, Use-case, Class) gives us a formalized description in a fairly strict notation, i.e. has an unequivocal reading. Now you can develop a technical task, specify the specification of requirements, etc.
Let's start modeling.
Stage 1. We describe the process in the form of an Activity diagram.
Let me remind you that we structured the chart field using “swim” tracks, elements of the same type are located on each track (Figure 2). In addition to the above-described elements of the diagram, we will use additional elements, let's describe from.
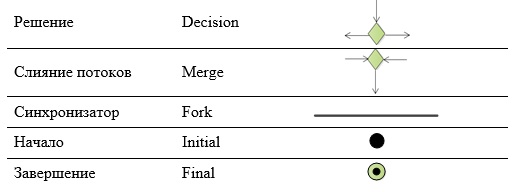
Decision (Decision) denotes the branch point of our process in the diagram, and merge flows (Merge) - the point of their reunion. In square brackets on the transitions recorded transition conditions.
Between two synchronizers (Fork) we will show parallel branches of the process.
Our process can have only one beginning - one entry point (Initial). But there may be several completions (Final), but not for our specific diagram.
The shooter turns out to be quite a lot; with a large number of elements and links, you can select the process stages first, and then perform the decomposition of these stages. But for clarity, I would like to show our “fairy-tale” process entirely on one diagram, while, of course, we need to ensure that the arrows “do not stick together,” we can accurately track what is connected with it.
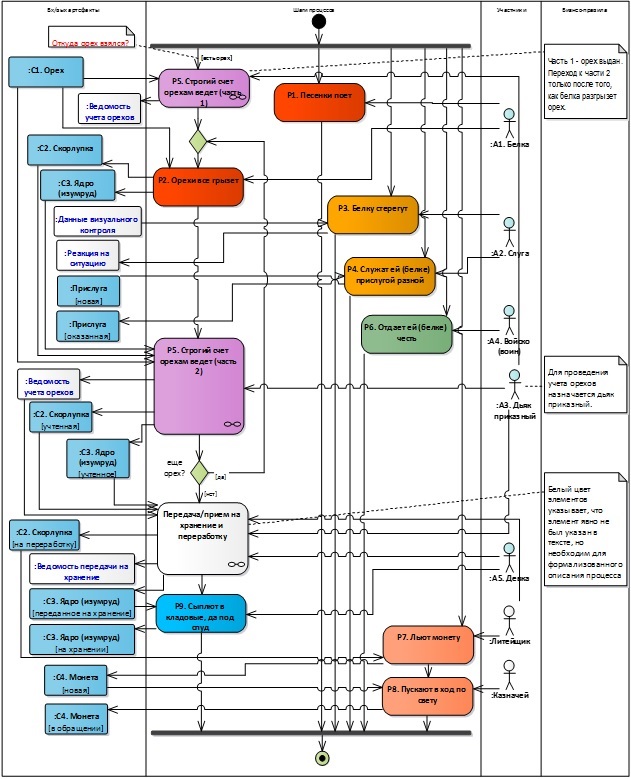
Figure 2. Activity diagram - general view of the process
Because some verses of the process are omitted in the verse lines, they had to be restored, they are shown with elements with a white background. These details include the “Transfer / Receipt for Storage and Processing” step and several input and output artifacts. It is worth noting that this step also does not fully disclose the process, since we would need to separately designate the transmission step and the reception step, and also add a separate step for the shells, and also think that all these material values should be temporarily stored somewhere, etc. etc.
We also note that the question of the origin of nuts remains unanswered - where do they come from and how do they get to the protein? And this question (it is highlighted in red in the font in the note - the Note element) requires a separate study! This is how the analyst works - bit by bit collecting information, making assumptions and getting “okay” or “non-okay” from domain experts - very important and simply irreplaceable people at the stage of business modeling when creating systems.
Note also that the P5 process step consists of two parts.
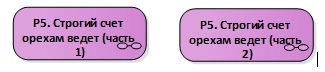
And we decompose each part and consider in more detail (Figure 3, Figure 4), since activities performed within the framework of these steps will be automated.

Figure 3. Activity Diagram - Detailing (Part 1)
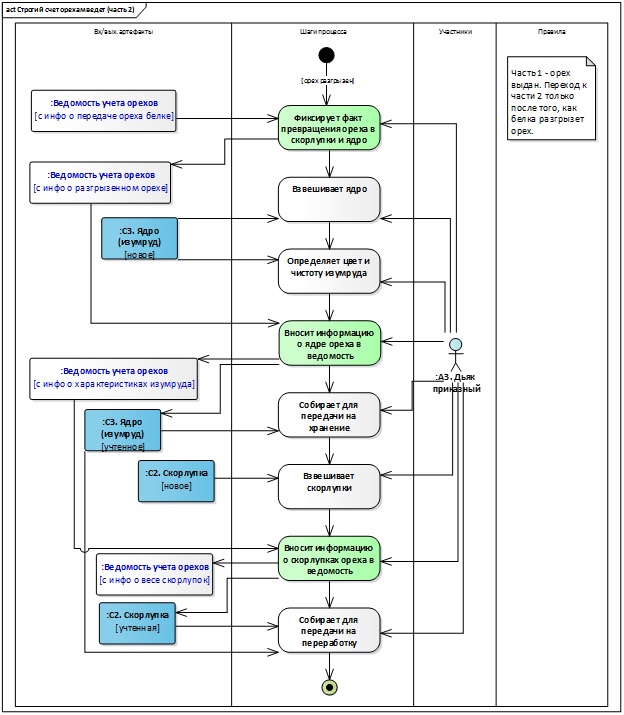
Figure 4. Activity Diagram - Detailing (Part 2)
Stage 2. Select what you can automate.
The steps to be automated in the diagrams are highlighted in color (see Figure 3, Figure 4).
All of them are carried out by one participant in the process - Diac clerical:
- Includes information on the weight of the nut in the list;
- Enter information on the transfer of the nut in the list;
- Fixes the fact that the walnut is turned into a shell and a kernel;
- Includes information on the kernel of the nut in the list;
- Enters information on walnut shells in the list.
Analysis of the work done. What's next?
So, we have done a lot of preparatory work: collected information about the process that we are going to automate; began to form a modeling agreement (so far only in terms of using the Activity diagram); performed a process simulation and even decomposed several of its steps; identified process steps that will be automated. Now we are ready to proceed to the next steps and begin designing the functions of the system and its internal organization.
As you know, theory without practice is nothing. It is necessary to try “modeling” with your own hands; this is also useful for understanding the proposed approach. For example, you can work in the modeling environment Modelio [3]. We decomposed only part of the steps of the general view of the process diagram (see Figure 2). As a practical task, it may be proposed to repeat all the diagrams in the Modelio environment and decompose the “Transfer / Acceptance for Storage and Recycling” step.
We are not reviewing work in specific modeling environments, but this may be the subject of separate articles and reviews.
In the second part of the article we will examine the modeling and design techniques required in stages 3-5, we will use the Use-case and Class UML diagrams. To be continued .
- Site "UML2.ru". Forum of the Community of Analysts. General section. Examples Examples of fairy tales, designed in the form of UML diagrams. [Electronic resource] Access mode: Internet: http://www.uml2.ru/forum/index.php?topic=486.0
- Sparx Systems website. [Electronic resource] Access mode: Internet: https://sparxsystems.com
- Website Modelio. [Electronic resource] Access mode: Internet: https://www.modelio.org
- Big Encyclopedic Dictionary. Process (interpretation). [Electronic resource] Access mode: Internet: https://dic.academic.ru/dic.nsf/enc3p/246322
- Site "Organization of effective management." Blog. Heading "Business Process Management". Business process definition. [Electronic resource] Access mode: Internet: https://rzbpm.ru/knowledge/pochemu-processy-stali-s-pristavkoj-biznes.html
- Certificate No. 18249 on registration and deposit of the work of the result of intellectual activity. Alfimov R.V., Zolotukhina E.B., Krasnikova S.A. The manuscript of the educational-methodical manual called "Modeling the subject area using Enterprise Architect" // 2011.
- Zolotukhina EB, Vishnya AS, Krasnikova S.A. Business process modeling. - M .: COURSE, SEC INFRA-M, EBS Znanium.com. - 2017.
')
Source: https://habr.com/ru/post/448146/
All Articles