Display and optimization of output to the terminal on the web
Not so long ago, I was faced with a rather simple and at the same time interesting task: the implementation of a read-only terminal in a web application. Interest in the task was given three important aspects:
- support for basic ANSI escape sequences
- support for at least 50,000 data lines
- display data as they become available.
In this article, I will talk about how it implemented and how it was then optimized.
Disclaimer: I am not an experienced web developer, so some things may seem obvious to you, and the conclusions or decisions are wrong. For corrections and clarifications, I will be grateful.
What was it for?
The whole task looks like this: a script works on the server (bash, python, etc.) and writes something to stdout. And this conclusion should be displayed on the web page as it is received. At the same time, it should look like on the terminal (with formatting, cursor movements, etc.)
The script itself and its output, I can not control and display in its pure form.
Of course between the web interface and the script there must be an intermediary - a web server. And if you don’t be cunning - I already have a web application and server and somehow work. The scheme looks something like this:
But earlier the server was responsible for processing and formatting. And I wanted to improve it for a number of reasons:
- double data processing - first parsing on the server, then transformation into html components on the client
- non-optimal algorithm due to data preparation for the client
- high server load - output processing from one script could completely load a single stream on the server
- incomplete support for ANSI Escape sequences
- subtle bugs
- the client was very bad at displaying even 10k formatted strings
Therefore, it was decided to transfer all the logic of parsing to a web application, and leave the server only streaming raw data
Formulation of the problem
On the client come parts of the text. The client must disassemble them into components: plain text, line break, carriage return and special ANSI commands. There are no guarantees for the integrity of parts - one command or word can come in different packages.
ANSI commands can affect the format of the text (color, background, style), the position of the cursor (where the next text should be displayed) or do a part of the screen cleaning.
An example of how it looks:
In addition, among the text may be URLs that also need to be recognized and highlighted.
Take the library ready and ...
I understood that correct and fast processing of all commands is not an easy task. Therefore, I decided to look for a ready-made library. And, about a miracle, literally at once came across xterm.js . The finished component of the terminal, which is already used a lot where, and, in addition, "is really fast, it even includes a GPU-accelerated renderer" . The last was for me the most important, because I wanted to finally get a very fast client.
Despite the fact that I love to write my own bikes, I was extremely glad that I could not only save time, but also get a lot of useful functionality for free.
Attempts to connect the terminal it took me 2 pm and I could not cope with it. Totally.
Different row heights, curved allocation, adaptive terminal size, very strange API, lack of meaningful documentation ...
But I still had a little enthusiasm and I believed that I could deal with these problems.
Until I fed my test 10k lines to the terminal ... He died. And buried with him the remnants of my hopes.
Description of the final algorithm
First of all, I copied the current algorithm implemented in python and adapted it to javascript (just the removal of curly braces and another for for syntax).
I knew all the main advantages and disadvantages of the old algorithm, so I only needed to improve the ineffective places in it.
After deliberation, trial and error, I stopped at the following option: we divide the algorithm into 2 components:
- model for parsing text and storing the current state of the "terminal"
- a mapping that translates the model into HTML
Model (structure and algorithm)
- All rows are stored in an array (row number = index in array)
- Text styles are stored in a separate array.
- The current position of the cursor is stored and can be changed by commands.
- The algorithm itself checks the input data character by character:
- If this is just text, add to the current line
- If the line break, then increase the current row index
- If this is one of the command characters, then put it in the command buffer and wait for the next character.
- If the command buffer is correct, then run this command, otherwise we write this buffer as text.
- The model notifies listeners about which lines have changed after processing the incoming text.
In my implementation, the complexity of the algorithm is O ( n log n ), where log n is the preparation of modified rows for the alert (uniqueness and sorting). At the time of this writing, I realized that for a particular case, you can get rid of log n , since the lines are most often added to the end.
Display
- Displays text as HTML elements.
- If the line has changed, it completely replaces all elements of the line.
- Splits each line based on styles: each stylized segment has its own element
With such a structure, testing is a fairly simple task - we transfer the text to the model (in a single package or in parts) and simply check the current state of all the lines and styles in it. And to display just a few tests, because it always redraws changed lines.
An important advantage is also a certain laziness of the display. If in one piece of text we overwrite the same line (for example, the progress bar), then after the model works, for display it will look like one changed line.
DOM vs Canvas
I would like to dwell on why I chose the DOM, although the goal was performance. The answer is simple - laziness. For me, rendering everything in Canvas alone looks like a rather difficult task. When saving usability: selection, copying, screen size, tidy look, etc. The xterm.js example clearly showed me that this is not at all easy. Their drawing on canvas was far from perfect.
In addition, debugging the DOM tree in the browser and the ability to cover a unit with tests is an important advantage.
In the end, my goal was 50k lines, and I knew that the DOM had to cope with this, based on the work of the old algorithm.
Optimization
The algorithm was ready, debugged and slowly but surely worked. It was time to open the profiler and optimize. Looking ahead, I will say that most of the optimizations were a surprise for me (as is usually the case).
Profiling was carried out on 10k lines, each of which contained stylized elements. The total number of DOM elements is about 100k.
No special approaches and tools were used. Only Chrome Dev Tools and a couple of launches for each measurement. In practice, only absolute values of measurements (how many seconds to perform) differed in launches, but not the percentage ratio between the methods. Therefore, I consider this technique conditionally sufficient.
Below I would like to elaborate on the most interesting improvements. And for a start, a graph of what was:
All profiling graphics were built after implementation, by de-optimizing code in memory.
string.trim
First of all, I came across an incomprehensible string.trim, which ate up a very noticeable amount of CPU (I think it was around 10-20%)
trim () is the base language function. Why is a library used for it? And even if it is some kind of polyfill, then why did he turn on the latest version of chrome?
A little googling and the answer is found: https://babeljs.io/docs/en/babel-preset-env . By default, it includes polyfill for a fairly large number of browsers, and it does so at compile time. The solution for me was to specify the 'targets': '> 0.25%, not dead'
But in the end, I removed the trim call entirely, as unnecessary.
Vue.js
Last year, I transferred the terminal component to Vue.js. Now I had to translate it back to vanilla, the reason is in the screenshot below (see the number of lines with Vue.js):
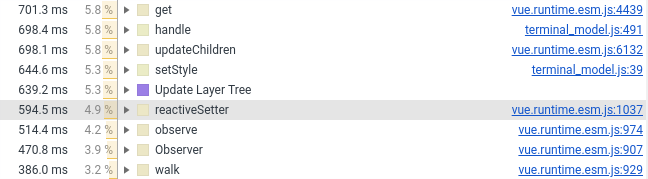
I left in the Vue component only the wrapper, styles and handling of the mouse. All that relates to the creation of DOM elements went to pure JS, which is connected to the Vue component as a regular field (which is not tracked by the framework).
created() { this.terminalModel = new TerminalModel(); this.terminal = new Terminal(this.terminalModel); }, I do not think this is a minus or a flaw in Vue.js. It’s just that frameworks and performance are poorly combined by themselves. Well, when you throw tens and hundreds of thousands of objects into a reactive framework, it is very difficult to expect processing in a couple of milliseconds. And frankly, I'm even surprised that Vue.js did a pretty good job.
Adding new items
Everything is simple - if you have several thousand new elements and you want to add them to the parent component, making appendChild is not a good idea. The browser has to do a bit more processing and spend more time on rendering. One of the side effects in my case was the slowdown of autoscroll, since it forces recalculation of all added components.

To solve the problem, there is a DocumentFragment. First we add all the elements to it, and then it to the parent component itself. The browser will take care of inline incoming components.
This approach reduces the amount of time the browser spends drawing and positioning elements.
I also tried other ways to speed things up. None of them could add anything on top of the DocumentFragment.
span vs div
In fact, it could be called display:inline (span) v display:block (div).
Initially, I had every line in a span and ended with a newline. However, in terms of performance, this is not very efficient: the browser has to calculate where the element begins and ends. With display: block, such calculations are much easier.
Replacing the div accelerated rendering almost 2 times.
Unfortunately, in the case of display:block highlighting a few lines of text looks worse:

For a long time I couldn’t decide which is better - the extra 2 seconds of drawing or human selection. In the end, practicality won beauty.
CSS Wizard Level 10
Another ~ 10% of the drawing time was cut off by the "optimization" of the CSS, which I use to format the text.
I was played against inexperience in web development and understanding of the basics. I thought that the more accurate the selectors, the better, but specifically in my case this was not the case.
To format the text in the terminal I used these selectors:
#script-panel-container .log-content > div > span.text_color_green, But (in chrome), the next option is a bit faster:
span.text_color_green I don’t really like this selector because too global, but performance is more expensive.
string.split
If you have a deja vu because of one of the preceding paragraphs, then it is false. This time it's not about the polyfill, but about the standard implementation in chrome:

(I wrapped string.split in defSplit so that the function is shown in the profiler)
1% is the little things. But the idealist cyclist in me did not give rest. In my case, split is always done one at a time and without any regularizers. Therefore, I implemented a simple option. Here is the result:

function fastSplit(str, separatorChar) { if (str === '') { return ['']; } let result = []; let lastIndex = 0; for (let i = 0; i < str.length; i++) { const char = str[i]; if (char === separatorChar) { const chunk = str.substr(lastIndex, i - lastIndex); lastIndex = i + 1; result.push(chunk); } } if (lastIndex < str.length) { const lastChunk = str.substr(lastIndex, str.length - lastIndex); result.push(lastChunk); } return result; } I believe that after this, I am obliged to take the Google Chrome team without an interview.
Optimization, afterword
Optimization is a process without end and something can be improved to infinity. Especially considering that different use cases require different (and contradictory) optimizations.
For my case, I chose the main use case and optimized its operating time from 15 seconds to 5 seconds. On this I decided to stop.
There are still a couple of places that I plan to improve, but this is due to the experience.
Bonus Mutation testing.
It so happened that over the past few months I have often come across the term "mutational testing." And I decided that this task is a great way to try this beast. Especially after I didn’t have code coverage in the Webstorm, for karma tests.
Since both the technology and the library are new to me, I decided to get away with a little blood: test only one component - the model. In this case, you can clearly specify which file we are testing, and which test suite is intended for it.
But whatever one may say, I had to tinker a lot to achieve integration with karma and webpack.
In the end, everything started and after half an hour I saw sad results: about half of the mutants survived. I killed a part immediately, left some for the future (when I implemented the missing ANSI commands).
After that, laziness won, and currently the results are as follows (for 128 tests):
Ran 79.04 tests per mutant on average. ------------------|---------|----------|-----------|------------|---------| File | % score | # killed | # timeout | # survived | # error | ------------------|---------|----------|-----------|------------|---------| terminal_model.js | 73.10 | 312 | 25 | 124 | 1 | ------------------|---------|----------|-----------|------------|---------| 23:01:08 (18212) INFO Stryker Done in 26 minutes 32 seconds. In general, this approach seemed to me very useful (obviously better than code coverage) and fun. The only negative is a terribly long time - 30 minutes per class is a bust.
And most importantly, this approach made me think once again about 100% coverage and whether it is worth absolutely everything to be covered with tests: now my opinion is even closer to “yes” when answering this question.
Conclusion
Performance optimization, in my opinion, is a good way to learn something deeper. And also it is a good warm-up for the brain. And it’s a pity that it is rarely really necessary (at least in my projects).
And as always, the "first profiling, then optimization" approach works much better than intuition.
Links
Old implementation:
New implementation:
Unfortunately, there is no demo of the web component, so you just won't be able to poke it. So I apologize in advance
Thank you for your time, I will be glad of comments, suggestions and reasonable criticism!
')
Source: https://habr.com/ru/post/448030/
All Articles