Time Travel Debugging in Visual Studio Enterprise 2019
The preview version of Time Travel Debugging (TTD) in Visual Studio Enterprise 2019 allows you to record the execution of a web application running on an Azure virtual machine, and then accurately restore and replay the algorithm. TTD integrates with our Snapshot Debugger offer and allows you to rewind and replay each line of code as many times as you like, helping to identify and predict problems that can only occur in combat environments.

The picture is taken from the page of the game Quantum Break (18+) in the Microsoft Store. By the way, there is a 75% discount on it today ($ 10). If someone wanted, but did not find the opportunity, we recommend.
The most effective type of debugging often occurs in the so-called “internal loop”. When you view and debug the code locally, before you go to version control. The problems we face during the development of the inner loop are usually easier to understand and diagnose because they are accessible and repeatable.
')

Today we are pleased to announce the release of Time Travel Debugging (TTD) in Visual Studio Enterprise. With TTD, we give you the ability to record code executed in a production environment and reproduce the execution path inside Visual Studio. TTD also gives you the ability to move back and forth in time, as if you were running local debugging of the “internal loop”. You also get access to important debugging features, such as locals and a call stack.
Modern debuggers usually allow you to stop at a certain point (breakpoint), interrupt the whole process, and only then move forward. Even with more advanced debugging tools, such as IntelliTrace , you record events and data at discrete points in time. TTD has a significant advantage over snapshots, logging, or crash dump files, since these methods usually do not contain accurate information about the execution path that led to a final failure or error.
Time Travel Debugging (TTD) is a reverse debugging solution that allows you to record code execution in an application or process and play it back and forth. TTD improves debugging, since you can go back in time to better understand the conditions that lead to a specific error. In addition, you can reproduce it several times to figure out how to best fix the problem. TTD technology was recently introduced in the preview version of WinDbg for scenarios with native code .
We extended the Snapshot Debugger with TTD so you can write applications as they are executed. You can then play this recording in Visual Studio Enterprise 2019, where you can rewind and replay each line of code as many times as you like. TTD records in a stream that matches snappoint conditions and is usually executed to the end of the method. But if before the end of the method after snappoint there is an “await”, the recording will be stopped. This feature will be a preview for the release of Visual Studio 2019 with a valid license. We are planning to add more TTD scripts in future updates.
Previewing Time Travel Debugging can be enabled in the latest version of Visual Studio Enterprise 2019 for Azure virtual machines running Windows with ASP.NET (4.8+).
After installing the latest version of Visual Studio Enterprise, follow these steps:
1. Open the project that requires Time Travel Debug - make sure you have the same version of source code that is published on the Azure virtual machine.
2. Select Debug> Attach Snapshot Debugger and select the Azure virtual machine on which your project is deployed along with your Azure storage account. When you first try to connect, you will need to install the Snapshot Debugger site extension.
3. Select the Time Travel Debugging option and click the Attach button. Once Visual Studio enters the Snapshot Debugger mode, it will be able to record using TTD.

4. Create a snappoint and configure it to enable Time Travel Debugging. Click Start \ Update Collection .

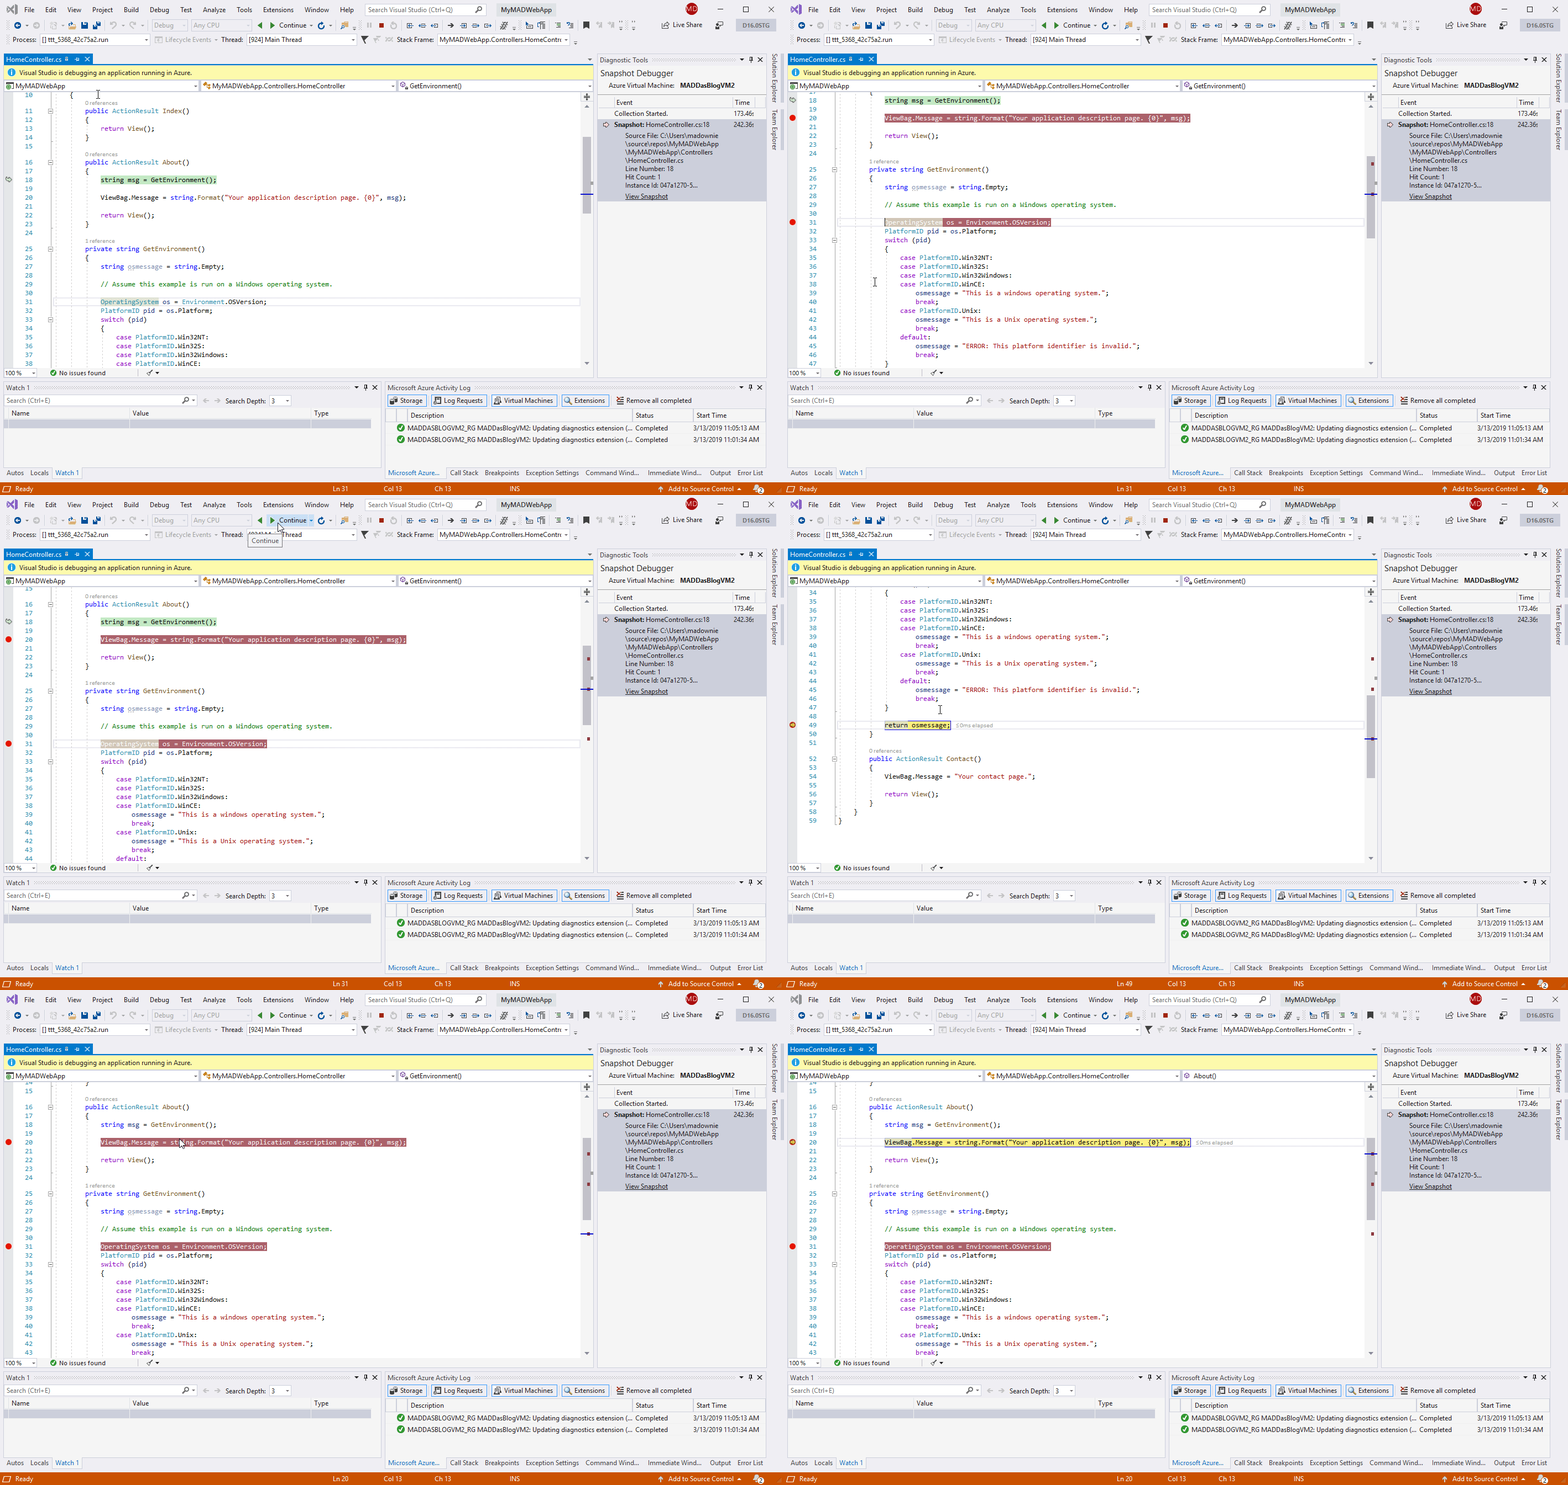
5. After your snapshot has been compiled, click View Snapshot , and you can use the command bar to go back and forth within the recorded method.

Limitations of the preview version of TTD
In the initial preview of the TTD stage, we will support AMD64 web applications running on an Azure virtual machine. We expect the entry to add significant overhead to your running process, slowing it down depending on the size of the process and the number of active threads. We also expect debugging to deteriorate in some of the following scenarios:
Please note: we also will not record asynchronous cause-effect relationships.
During pre-testing, we found that the TTD file size ranged from a few hundred megabytes to several gigabytes, depending on the session duration and the duration of the web application. However, files created by TTD will be cleared after the Snapshot Debugger session is completed and the application pool is restarted. For our pre-release, we also recommend using a virtual machine with at least 8 GB of RAM.
We’re incredibly excited about how this preview feature can help you improve debugging in Azure, but this is just the beginning. Our team continues to develop and create additional TTD features that we plan to add in upcoming releases of Visual Studio.
We look forward to your feedback!

The picture is taken from the page of the game Quantum Break (18+) in the Microsoft Store. By the way, there is a 75% discount on it today ($ 10). If someone wanted, but did not find the opportunity, we recommend.
The most effective type of debugging often occurs in the so-called “internal loop”. When you view and debug the code locally, before you go to version control. The problems we face during the development of the inner loop are usually easier to understand and diagnose because they are accessible and repeatable.
')

Today we are pleased to announce the release of Time Travel Debugging (TTD) in Visual Studio Enterprise. With TTD, we give you the ability to record code executed in a production environment and reproduce the execution path inside Visual Studio. TTD also gives you the ability to move back and forth in time, as if you were running local debugging of the “internal loop”. You also get access to important debugging features, such as locals and a call stack.
Modern debuggers usually allow you to stop at a certain point (breakpoint), interrupt the whole process, and only then move forward. Even with more advanced debugging tools, such as IntelliTrace , you record events and data at discrete points in time. TTD has a significant advantage over snapshots, logging, or crash dump files, since these methods usually do not contain accurate information about the execution path that led to a final failure or error.
What is Time Travel Debugging?
Time Travel Debugging (TTD) is a reverse debugging solution that allows you to record code execution in an application or process and play it back and forth. TTD improves debugging, since you can go back in time to better understand the conditions that lead to a specific error. In addition, you can reproduce it several times to figure out how to best fix the problem. TTD technology was recently introduced in the preview version of WinDbg for scenarios with native code .
We extended the Snapshot Debugger with TTD so you can write applications as they are executed. You can then play this recording in Visual Studio Enterprise 2019, where you can rewind and replay each line of code as many times as you like. TTD records in a stream that matches snappoint conditions and is usually executed to the end of the method. But if before the end of the method after snappoint there is an “await”, the recording will be stopped. This feature will be a preview for the release of Visual Studio 2019 with a valid license. We are planning to add more TTD scripts in future updates.
Getting started with TTD
Previewing Time Travel Debugging can be enabled in the latest version of Visual Studio Enterprise 2019 for Azure virtual machines running Windows with ASP.NET (4.8+).
After installing the latest version of Visual Studio Enterprise, follow these steps:
1. Open the project that requires Time Travel Debug - make sure you have the same version of source code that is published on the Azure virtual machine.
2. Select Debug> Attach Snapshot Debugger and select the Azure virtual machine on which your project is deployed along with your Azure storage account. When you first try to connect, you will need to install the Snapshot Debugger site extension.
3. Select the Time Travel Debugging option and click the Attach button. Once Visual Studio enters the Snapshot Debugger mode, it will be able to record using TTD.

4. Create a snappoint and configure it to enable Time Travel Debugging. Click Start \ Update Collection .

5. After your snapshot has been compiled, click View Snapshot , and you can use the command bar to go back and forth within the recorded method.

Limitations of the preview version of TTD
In the initial preview of the TTD stage, we will support AMD64 web applications running on an Azure virtual machine. We expect the entry to add significant overhead to your running process, slowing it down depending on the size of the process and the number of active threads. We also expect debugging to deteriorate in some of the following scenarios:
- During the compaction phase GC.
- Go through an optimized method, for example, when you enter a method that does not contain snappoint.
- If your application internally loads or unloads application domains.
- Recording occurs only in the stream that was called snappoint. The code that subsequently affects alternative flows will also be degraded.
Please note: we also will not record asynchronous cause-effect relationships.
During pre-testing, we found that the TTD file size ranged from a few hundred megabytes to several gigabytes, depending on the session duration and the duration of the web application. However, files created by TTD will be cleared after the Snapshot Debugger session is completed and the application pool is restarted. For our pre-release, we also recommend using a virtual machine with at least 8 GB of RAM.
Try TTD now!
We’re incredibly excited about how this preview feature can help you improve debugging in Azure, but this is just the beginning. Our team continues to develop and create additional TTD features that we plan to add in upcoming releases of Visual Studio.
We look forward to your feedback!
Source: https://habr.com/ru/post/447998/
All Articles