Custom instruments: when signpost is not enough
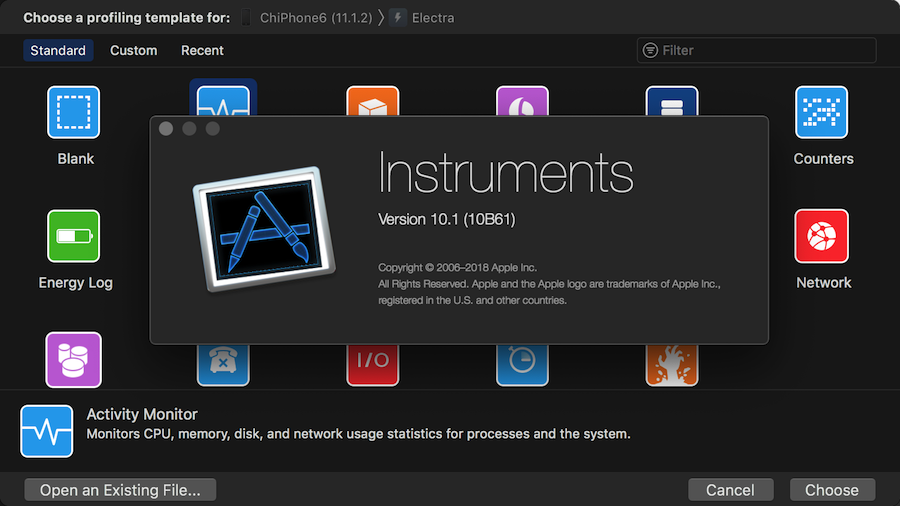
Instruments for Apple's Xcode are tools for analyzing the performance of an iOS application. They are used to collect and display data that is needed in debugging code. Last year, Apple presented Custom Instruments. This is an opportunity to expand the standard set of tools for profiling applications. When the existing tools are not enough, you can create new ones yourself - they will collect, analyze and display the data as you need.
A year has passed, and there are almost no new public tools and information on their creation in the network. So we decided to correct the situation and share how we created our own Custom Instrument, which determines the reason for the weak isolation of the unit tests. It is based on signpost technology (we wrote about it in the previous article ) and allows you to quickly and accurately determine the place where the test flashes.
To create a new tool for Xcode, you need an understanding of two theoretical blocks. Those who want to figure it out on their own will immediately give the necessary links:
')
For the rest - below a brief summary on the necessary topics.
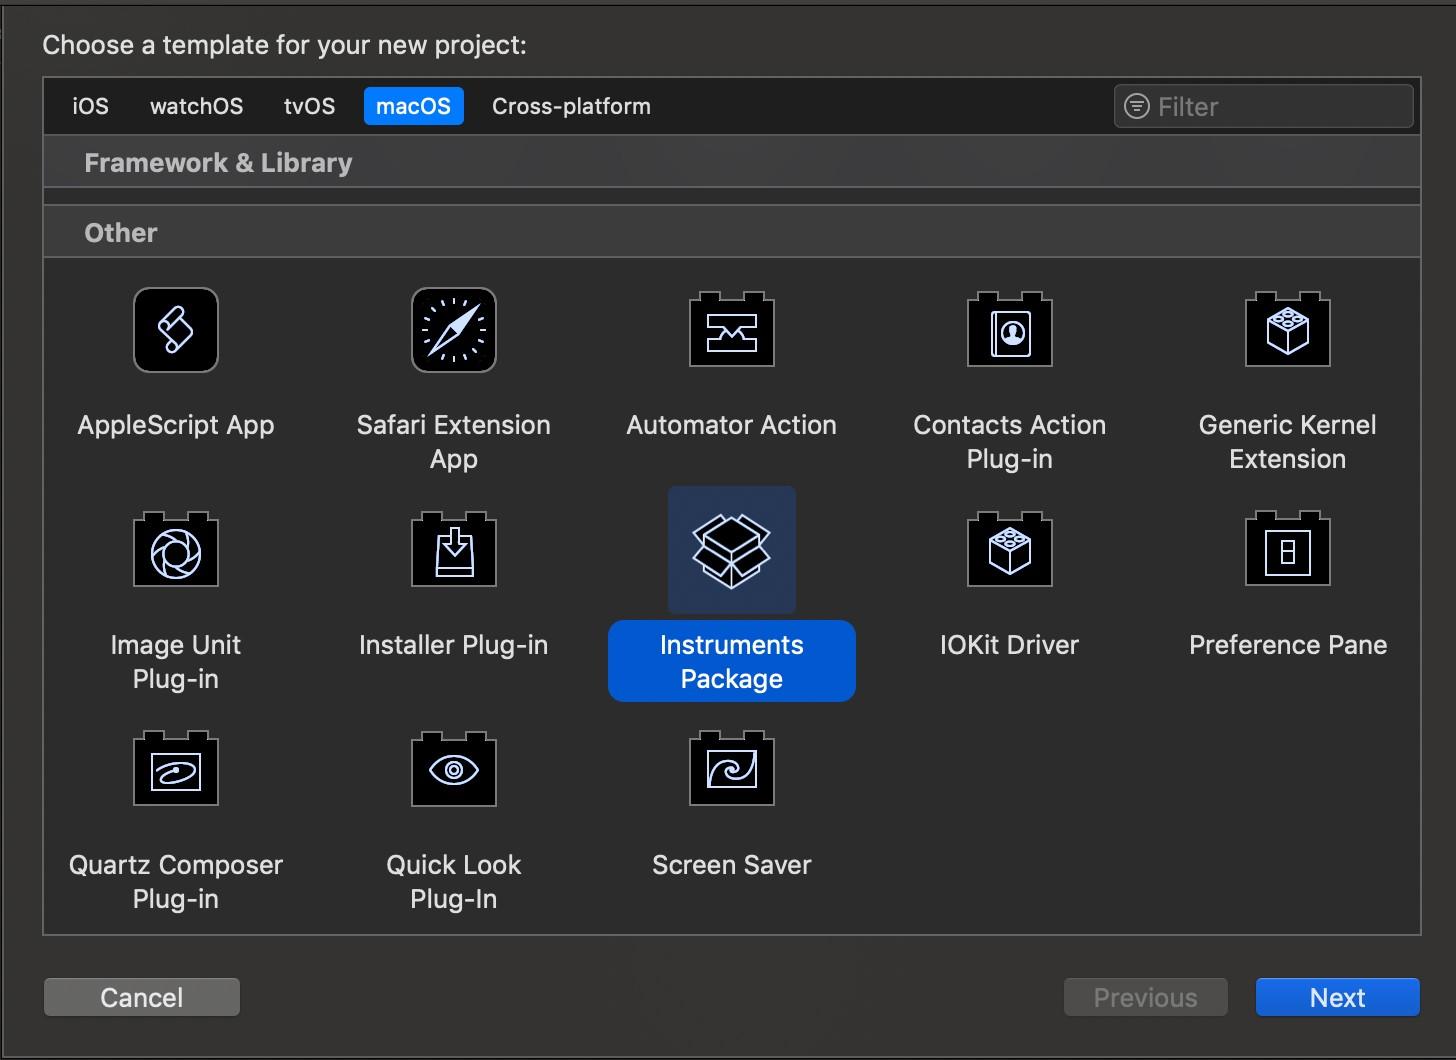
First select File -> New -> Project -> category macOS -> Instruments package. The created project includes a file with the .instrpkg extension, in which a new tool is declared declaratively in the xml format. Let's look at the markup elements:
If we want to supplement the logic of the new tool, then create a .clp file with CLIPS code. Basic entities of the language:
Which rules and in what sequence will be activated is determined by CLIPS itself on the basis of incoming facts, priorities of the rules and the mechanism of conflict resolution.
The language supports the creation of data types based on primitives, the use of arithmetic, logical operations and functions. As well as full-fledged object-oriented programming (OOP) with the definition of classes, sending messages, multiple inheritance.
Consider the basic syntax of the language, which allows you to create logic for custom tools.
1. To create a
Thus, we get the
To delete a fact, use the command
2. To create a
3. To create and use variables, use the following syntax (the name of the variable is preceded by the required "?"):
4. You can create new data types with:
So, we defined a structure called prospect and three attributes name, assets and age of the corresponding type and a default value.
5. Arithmetic and logical operations have a prefix syntax. That is, to add 2 and 3, you must use the following structure:
Or to compare two variables x and y:
In our project, we use the OCMock library to create stub objects. However, there are situations when the mock lives longer than the test for which it was created, and affects the isolation of other tests. In the end, this leads to "flashing" (instability) unit-tests. To track the lifetime of tests and mocks, create your own tool. Below is the algorithm of action.
To detect problem mocks, two categories of interval events are needed - the time of creation and destruction of the mock, the time of start and end of the test. To get these events, go to the

Next, go to the project under study, make markup in unit tests,
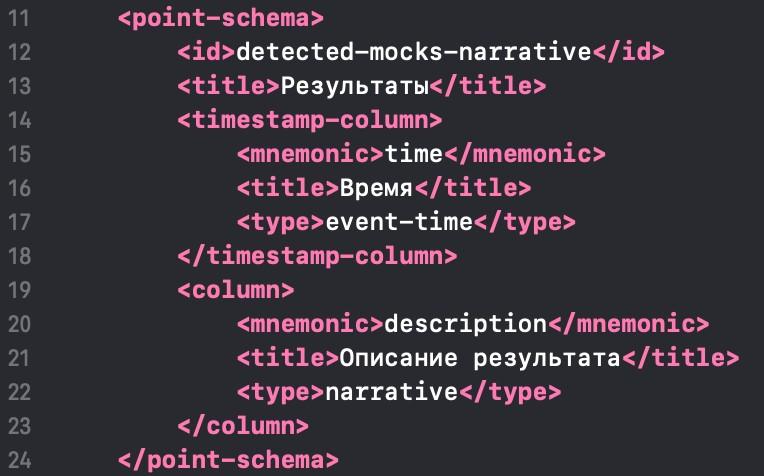
First we determine the type of data at the input. To do this, in the

Next, determine the type of data at the output. In this example, we will output one-time events. Each event will have a time and description. To do this, declare the scheme:
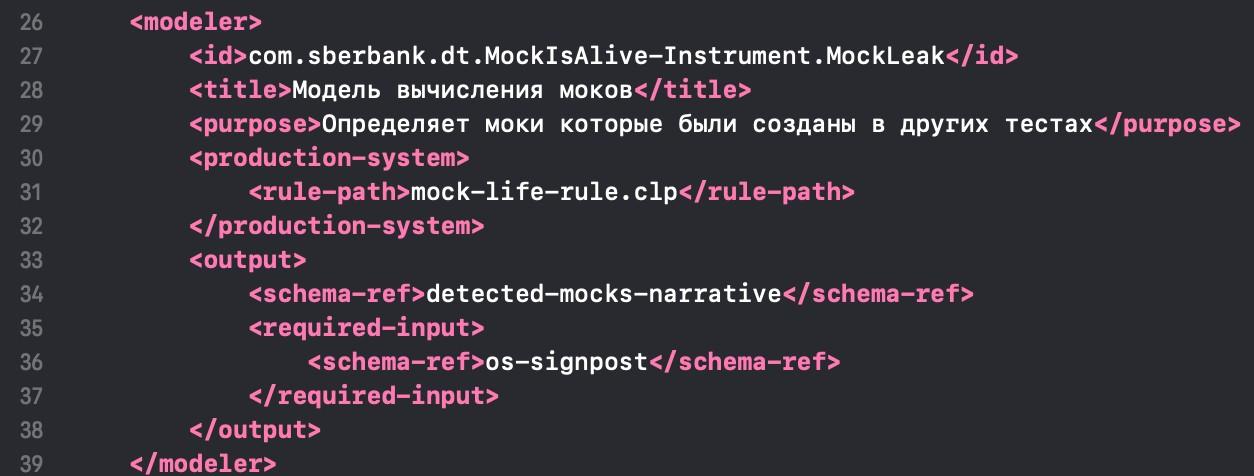
We create a separate file with the
In this block, using the

In the
Moving on to the
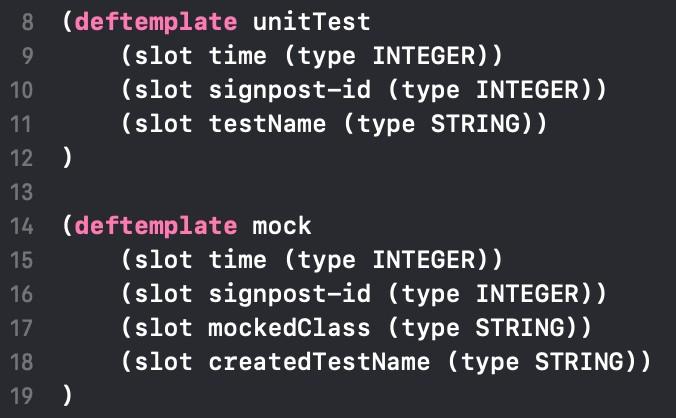
1. We define the mock and unitTest structures with fields — the time of the event, the event identifier, the name of the test, and the class of the mock.
2. Define the rules that will create facts with
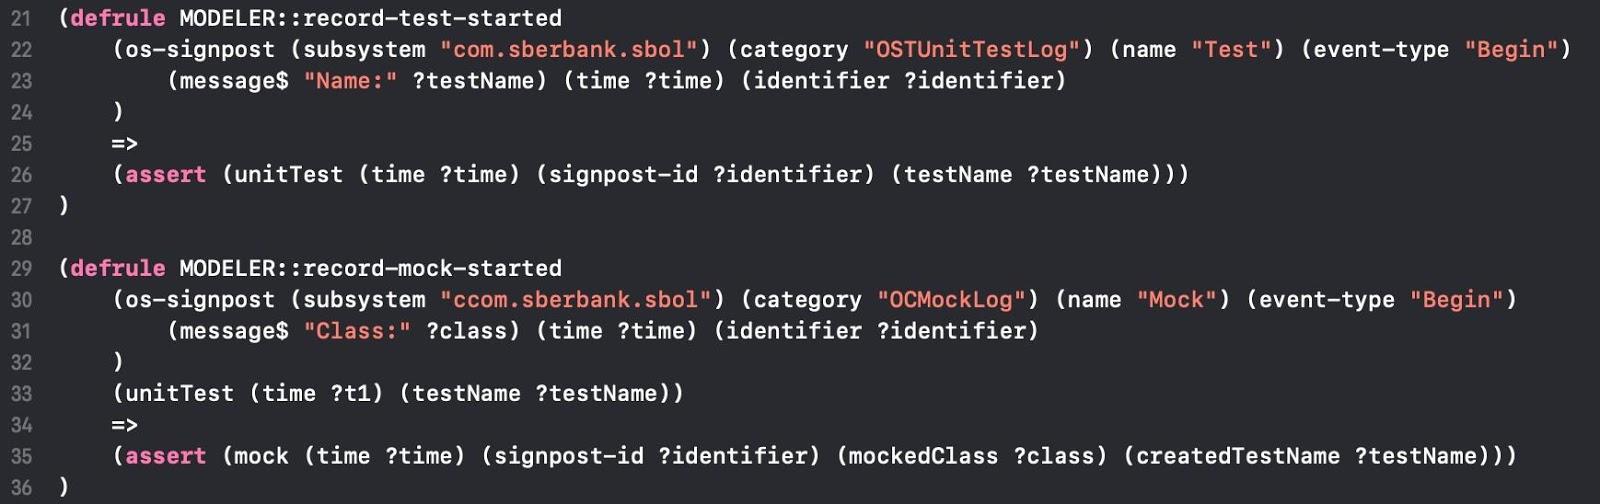
You can read these rules as follows: if at the input we get a fact like ospostpost with the required

The values of variables from signpost events are transmitted as follows:

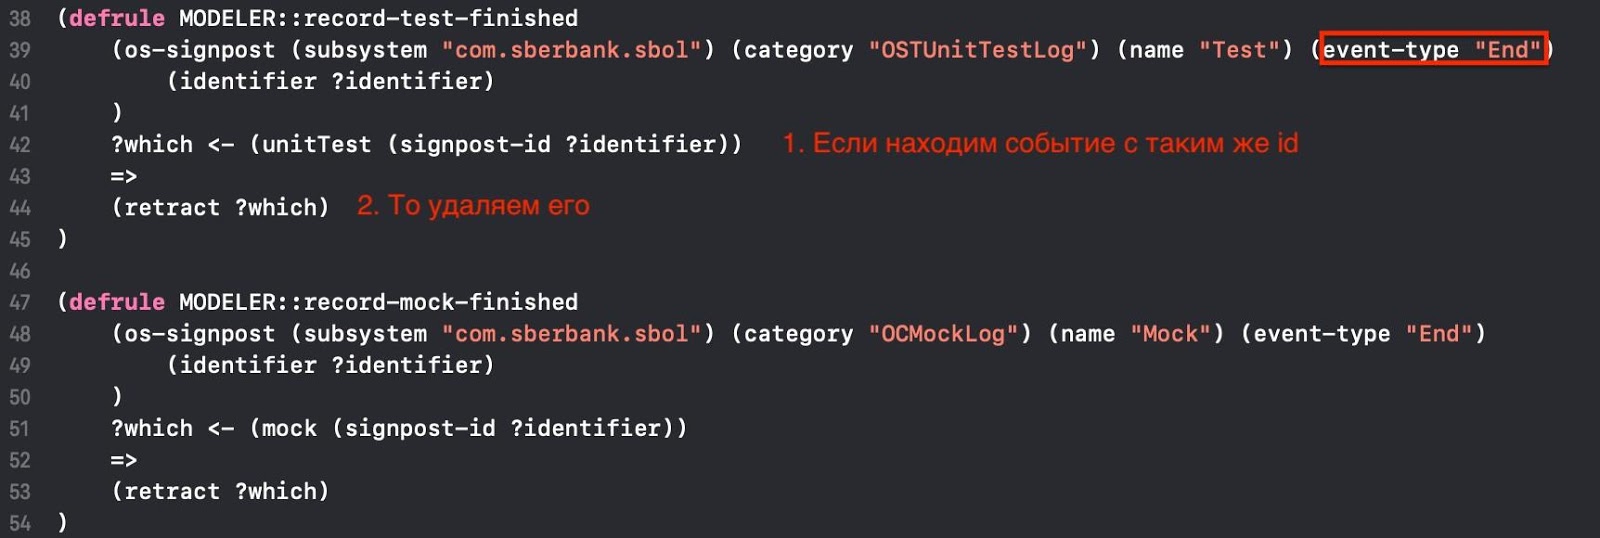
3. We determine the rules that release the completed events (they are redundant, since they do not affect the result).
You can read the rule like this.
If a
1) there is a unitTest and mock;
2) at the same time the beginning of the test comes later than the existing mock;
3) there is a table for storing results with a detected-mocks-narrative scheme;
that
4) create a new record;
5) fill with time;
6) ... and description.

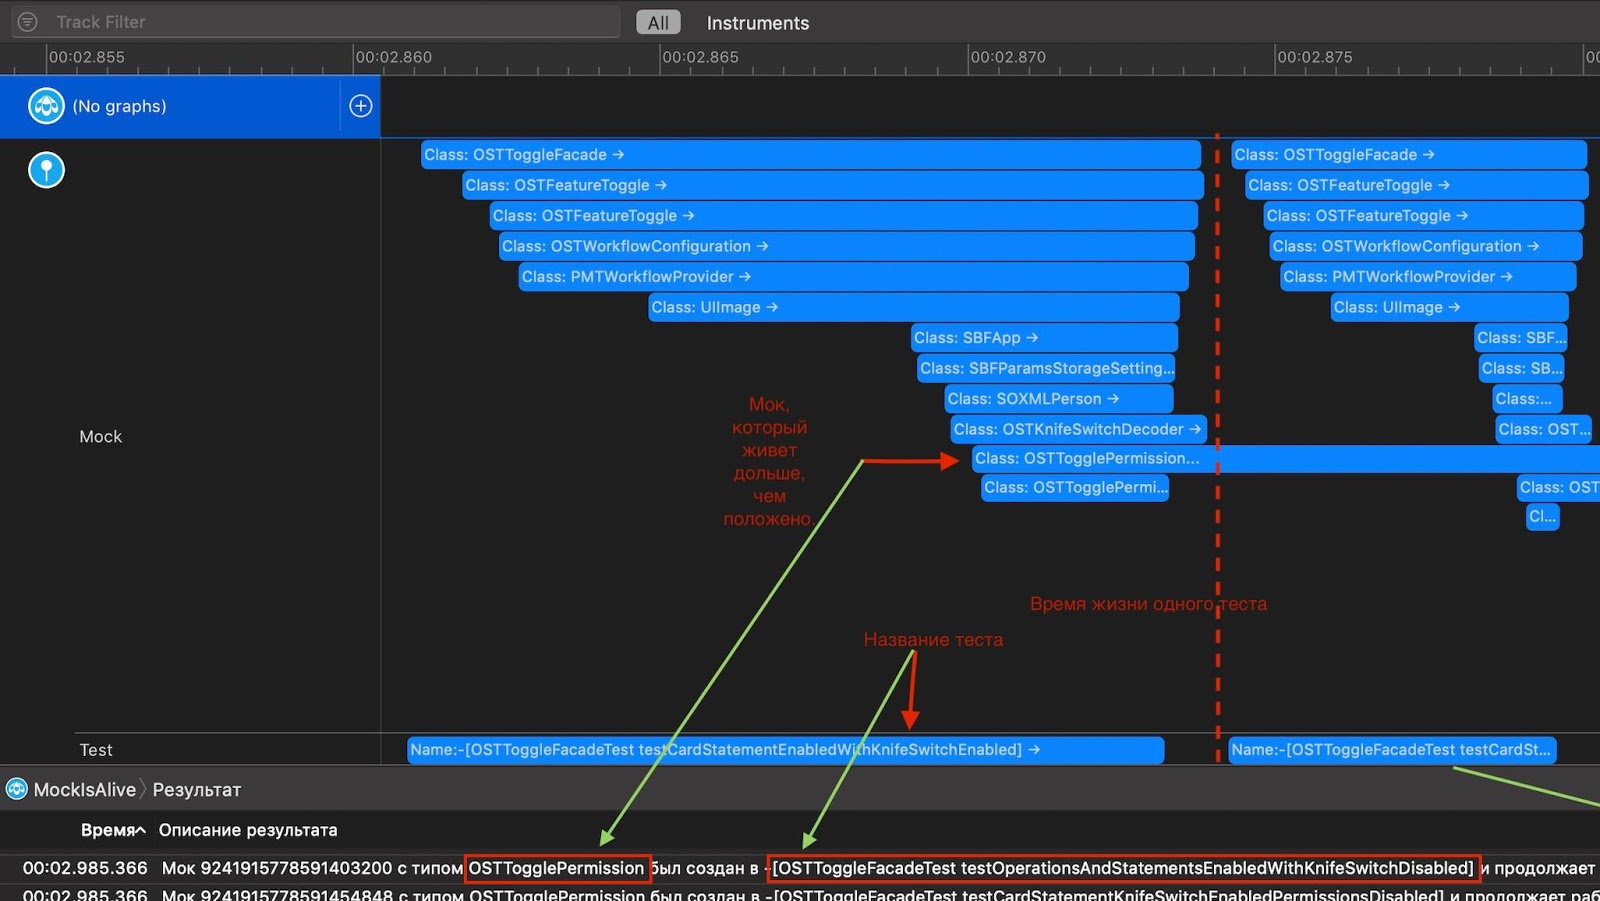
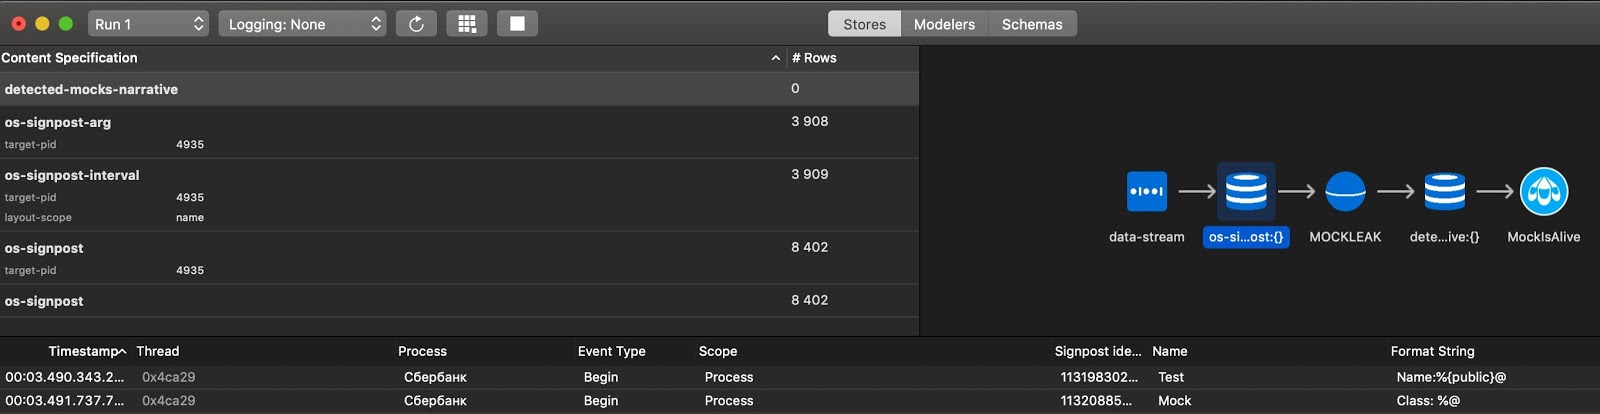
As a result, we see the following picture when using a new tool:
The source code custom instrument and a sample project for using the tool can be viewed on GitHub .
A debugger is used to debug custom tools.
He allows
1. See the compiled code based on the description in instrpkg.
2. See detailed information about what happens to the tool at run time.
3. Display a complete list and description of the system data schemas that can be used as input data in new tools.

4. Run arbitrary commands in the console. For example, display a list of rules with the “list-defrules” command or facts with the “facts” command.

You can run the tools from the command line — profile the application during unit-execution or UI tests on the CI server. This will allow, for example, to catch the memory leak as soon as possible. For profiling tests in the pipeline we use the following commands:
1. Launch tools with attributes:
2. Run tests on the same simulator with the command:
As a result, a report with the .trace extension will be created in the working directory, which can be opened by the Instruments application or by right-clicking on the file and selecting Show Package Contents.
We looked at an example of a signpost upgrade to a full-fledged tool and told how to automatically apply it on CI server “runs” and use it in solving “flashing” (unstable) tests.
As you immerse yourself in the capabilities of custom instruments, you will understand better in what other cases the instruments can be used. For example, they also help us to understand the problems of multithreading - where and when to use thread-safe data access.
Create a new tool was quite simple. But the main thing is that after spending a few days studying the mechanics and documentation for creating it today, you will be able to avoid several sleepless nights trying to fix bugs.
The article was written along with @regno - Anton Vlasov, an iOS developer.
A year has passed, and there are almost no new public tools and information on their creation in the network. So we decided to correct the situation and share how we created our own Custom Instrument, which determines the reason for the weak isolation of the unit tests. It is based on signpost technology (we wrote about it in the previous article ) and allows you to quickly and accurately determine the place where the test flashes.
Theoretical minimum
To create a new tool for Xcode, you need an understanding of two theoretical blocks. Those who want to figure it out on their own will immediately give the necessary links:
')
- on the structure of the markup file tool .instrpkg
- about CLIPS for programming tool logic
For the rest - below a brief summary on the necessary topics.
First select File -> New -> Project -> category macOS -> Instruments package. The created project includes a file with the .instrpkg extension, in which a new tool is declared declaratively in the xml format. Let's look at the markup elements:
| what | Attributes | Description |
| Data schemas | interval-schema, point-schema, etc. | Describes a data structure in the form of a table like sql schemas. Schemes are used in other markup elements to determine the type of data in the input and output of the model, for example, when describing a display (UI). |
| Import data schemas | import-schema | Import ready-made schemes. It allows you to use data structures that are defined by Apple. |
| Tool model | modeler | Associates a tool with a .clp file in which the tool logic is defined, and declares the expected data scheme at the input and output of the model. |
| Tool description | instrument | Describes the data model and determines how events will be displayed in the UI. The data model is described using the create-table, create-parameter, and other attributes. Tool plots are defined by graph attributes, and the details table is list, narrative, etc. |
If we want to supplement the logic of the new tool, then create a .clp file with CLIPS code. Basic entities of the language:
- “Fact” is a certain event registered in the system using the assert command;
- "Rule" is an if-block with a specific syntax, containing the condition under which the set of actions is performed.
Which rules and in what sequence will be activated is determined by CLIPS itself on the basis of incoming facts, priorities of the rules and the mechanism of conflict resolution.
The language supports the creation of data types based on primitives, the use of arithmetic, logical operations and functions. As well as full-fledged object-oriented programming (OOP) with the definition of classes, sending messages, multiple inheritance.
Consider the basic syntax of the language, which allows you to create logic for custom tools.
1. To create a
fact , use the assert construct: CLIPS> (assert (duck)) Thus, we get the
duck entry in the fact table, which can be viewed using the facts command: CLIPS> (facts) To delete a fact, use the command
retract : (retract duck)2. To create a
rule , use the defrule construction: CLIPS> (defrule duck) — duck (animal-is duck)</i> — animal-is duck => (assert (sound-is quack))) — sound-is quack 3. To create and use variables, use the following syntax (the name of the variable is preceded by the required "?"):
?<variable-name> 4. You can create new data types with:
CLIPS> (deftemplate prospect (slot name (type STRING) (default ?DERIVE)) (slot assets (type SYMBOL) (default rich)) (slot age (type NUMBER) (default 80))) So, we defined a structure called prospect and three attributes name, assets and age of the corresponding type and a default value.
5. Arithmetic and logical operations have a prefix syntax. That is, to add 2 and 3, you must use the following structure:
CLIPS> (+ 2 3) Or to compare two variables x and y:
CLIPS> (> ?x ?y) Practical example
In our project, we use the OCMock library to create stub objects. However, there are situations when the mock lives longer than the test for which it was created, and affects the isolation of other tests. In the end, this leads to "flashing" (instability) unit-tests. To track the lifetime of tests and mocks, create your own tool. Below is the algorithm of action.
Step 1. Make markup signpost events
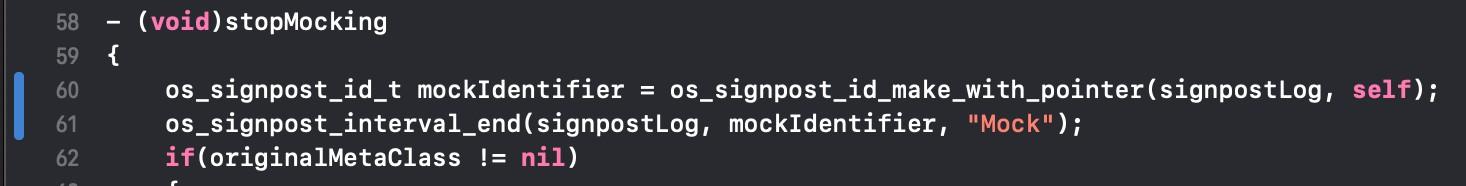
To detect problem mocks, two categories of interval events are needed - the time of creation and destruction of the mock, the time of start and end of the test. To get these events, go to the
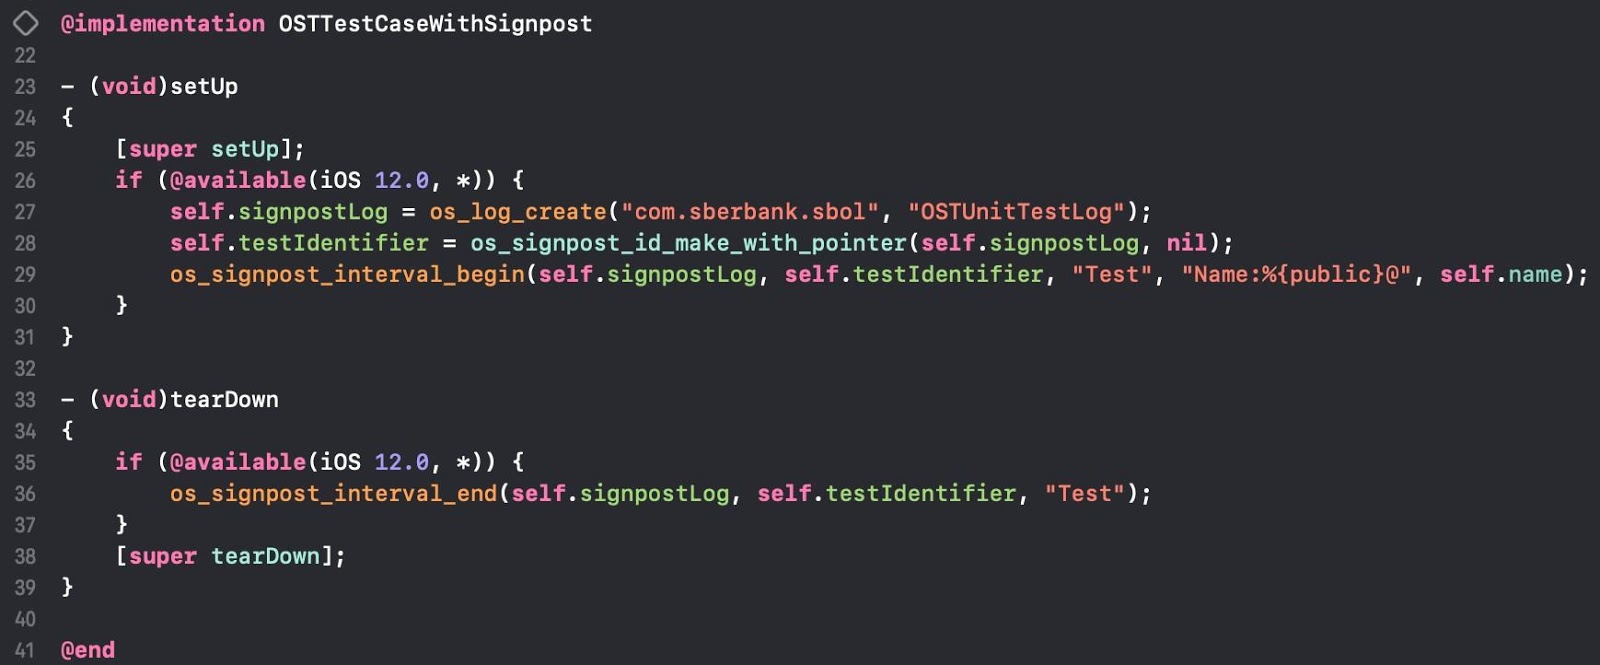
OCMock library and OCMock them using signpost in the init and stopMocking methods of the stopMocking class.Next, go to the project under study, make markup in unit tests,
setUp and tearDown :Step 2. Create a new instrument from the Instrument Package.
First we determine the type of data at the input. To do this, in the
.instrpkg file .instrpkg import the signpost scheme. Now the events created by signpost will fall into the tool:Next, determine the type of data at the output. In this example, we will output one-time events. Each event will have a time and description. To do this, declare the scheme:
Step 3. Describe the logic of the tool
We create a separate file with the
.clp extension, in which we set rules using the CLIPS language. To let the new tool know in which file the logic is defined, add the modeler block:In this block, using the
production-system attribute, specify the relative path to the file with logic. In the attributes output and required-input define the data schemes for input and output, respectively.Step 4. Describe the specifics of the representation of the tool (UI)
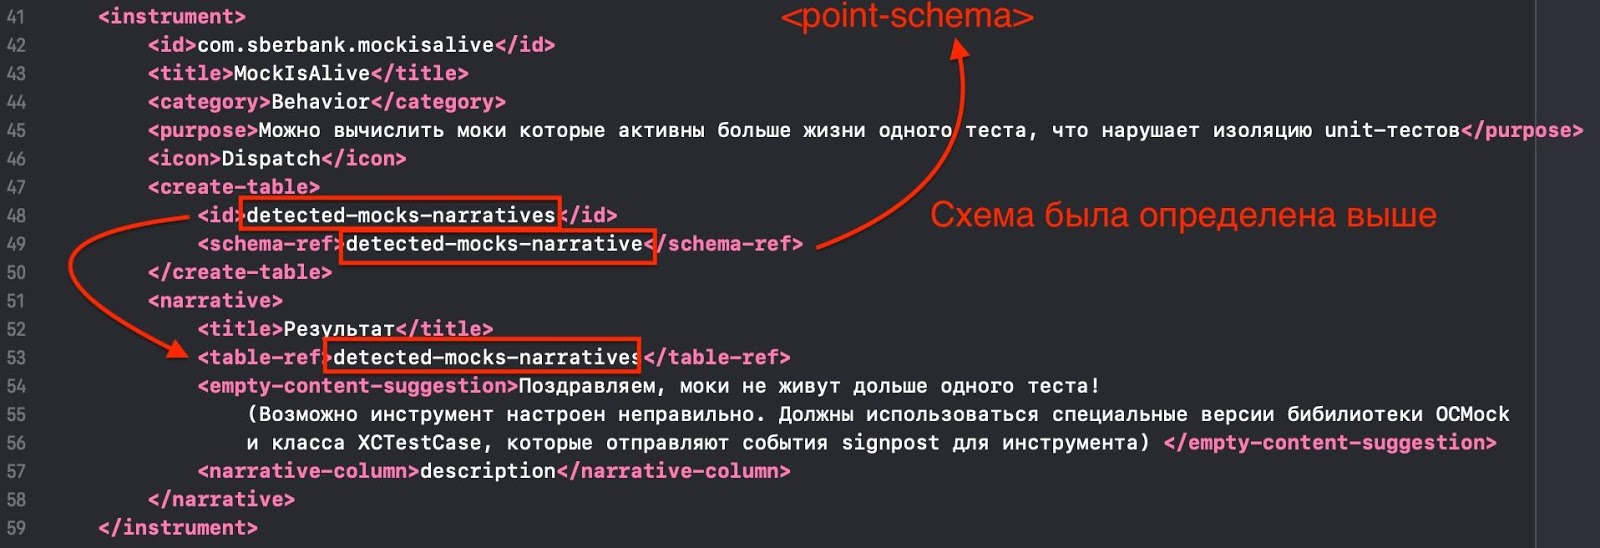
In the
.instrpkg file, .instrpkg remains to describe the tool itself, that is, the display of the results. Create a table for the data in the create-table attribute using the previously declared detected-mocks-narrative scheme in the schema-ref attribute. And configure the type of information output - narrative (descriptive):Step 5. Write the logic code
Moving on to the
.clp file, which defines the logic of the expert system. The logic will be as follows: if the start time of the test intersects with the interval of the life of the mock, then we believe that this time came from another test - which breaks the isolation of the current unit test. In order to eventually create an event with the information of interest, you need to do the following steps:1. We define the mock and unitTest structures with fields — the time of the event, the event identifier, the name of the test, and the class of the mock.
2. Define the rules that will create facts with
mock and unitTest types unitTest on unitTest inbound events:You can read these rules as follows: if at the input we get a fact like ospostpost with the required
subsystem , category , name and event-type , then we create a new fact with the type that was defined above (unitTest or mock) and fill it with values. It is important to remember here - CLIPS is a case-sensitive language and the values of the subsystem, category, name and event-type must match the one used in the code of the project under study.The values of variables from signpost events are transmitted as follows:
3. We determine the rules that release the completed events (they are redundant, since they do not affect the result).
Step 6. Define a rule that will generate results.
You can read the rule like this.
If a
1) there is a unitTest and mock;
2) at the same time the beginning of the test comes later than the existing mock;
3) there is a table for storing results with a detected-mocks-narrative scheme;
that
4) create a new record;
5) fill with time;
6) ... and description.
As a result, we see the following picture when using a new tool:
The source code custom instrument and a sample project for using the tool can be viewed on GitHub .
Debugging tools
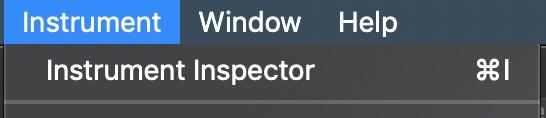
A debugger is used to debug custom tools.
He allows
1. See the compiled code based on the description in instrpkg.
2. See detailed information about what happens to the tool at run time.
3. Display a complete list and description of the system data schemas that can be used as input data in new tools.
4. Run arbitrary commands in the console. For example, display a list of rules with the “list-defrules” command or facts with the “facts” command.
Setup on the CI server
You can run the tools from the command line — profile the application during unit-execution or UI tests on the CI server. This will allow, for example, to catch the memory leak as soon as possible. For profiling tests in the pipeline we use the following commands:
1. Launch tools with attributes:
xcrun instruments -t <template_name> -l <average_duration_ms> -w <device_udid> - where
template_nameis the path to the template with tools or the name of the template.xcrun instruments -swithxcrun instruments -s; average_duration_ms- recording time in milliseconds, must be greater than or equal to the test execution time;device_udid- simulator id. Available with xcrun instruments -s. Must match the identifier of the simulator on which tests will be performed.
2. Run tests on the same simulator with the command:
xcodebuild -workspace <path_to_workspace>-scheme <scheme_with_tests> -destination <device> test-without-building - where
path_to_workspaceis the path to the Xcode workspace; scheme_with_tests- scheme with tests;device- simulator ID.
As a result, a report with the .trace extension will be created in the working directory, which can be opened by the Instruments application or by right-clicking on the file and selecting Show Package Contents.
findings
We looked at an example of a signpost upgrade to a full-fledged tool and told how to automatically apply it on CI server “runs” and use it in solving “flashing” (unstable) tests.
As you immerse yourself in the capabilities of custom instruments, you will understand better in what other cases the instruments can be used. For example, they also help us to understand the problems of multithreading - where and when to use thread-safe data access.
Create a new tool was quite simple. But the main thing is that after spending a few days studying the mechanics and documentation for creating it today, you will be able to avoid several sleepless nights trying to fix bugs.
Sources
- https://developer.apple.com/videos/play/wwdc2018/410/
- https://developer.apple.com/videos/play/wwdc2018/405/
- https://help.apple.com/instruments/developer/mac/current/
- https://help.apple.com/instruments/mac/current/#/devb14 aa5
- http://www.clipsrules.net/Documentation.html
- https://medium.com/appspector/building-custom-instruments-package-9d84fd9339b6
- http://desappstre.com/how-to-custom-instruments-xcode/
The article was written along with @regno - Anton Vlasov, an iOS developer.
Source: https://habr.com/ru/post/447594/
All Articles