GoLand 2019.1: Code Performance Analysis, Smart Step Into, Extract Interface Refactoring, Nilness Analyzer, and more
Hi, Habr!
Two weeks ago we released GoLand 2019.1 and we hasten to tell you about the updates of this release.

Code Performance Analysis
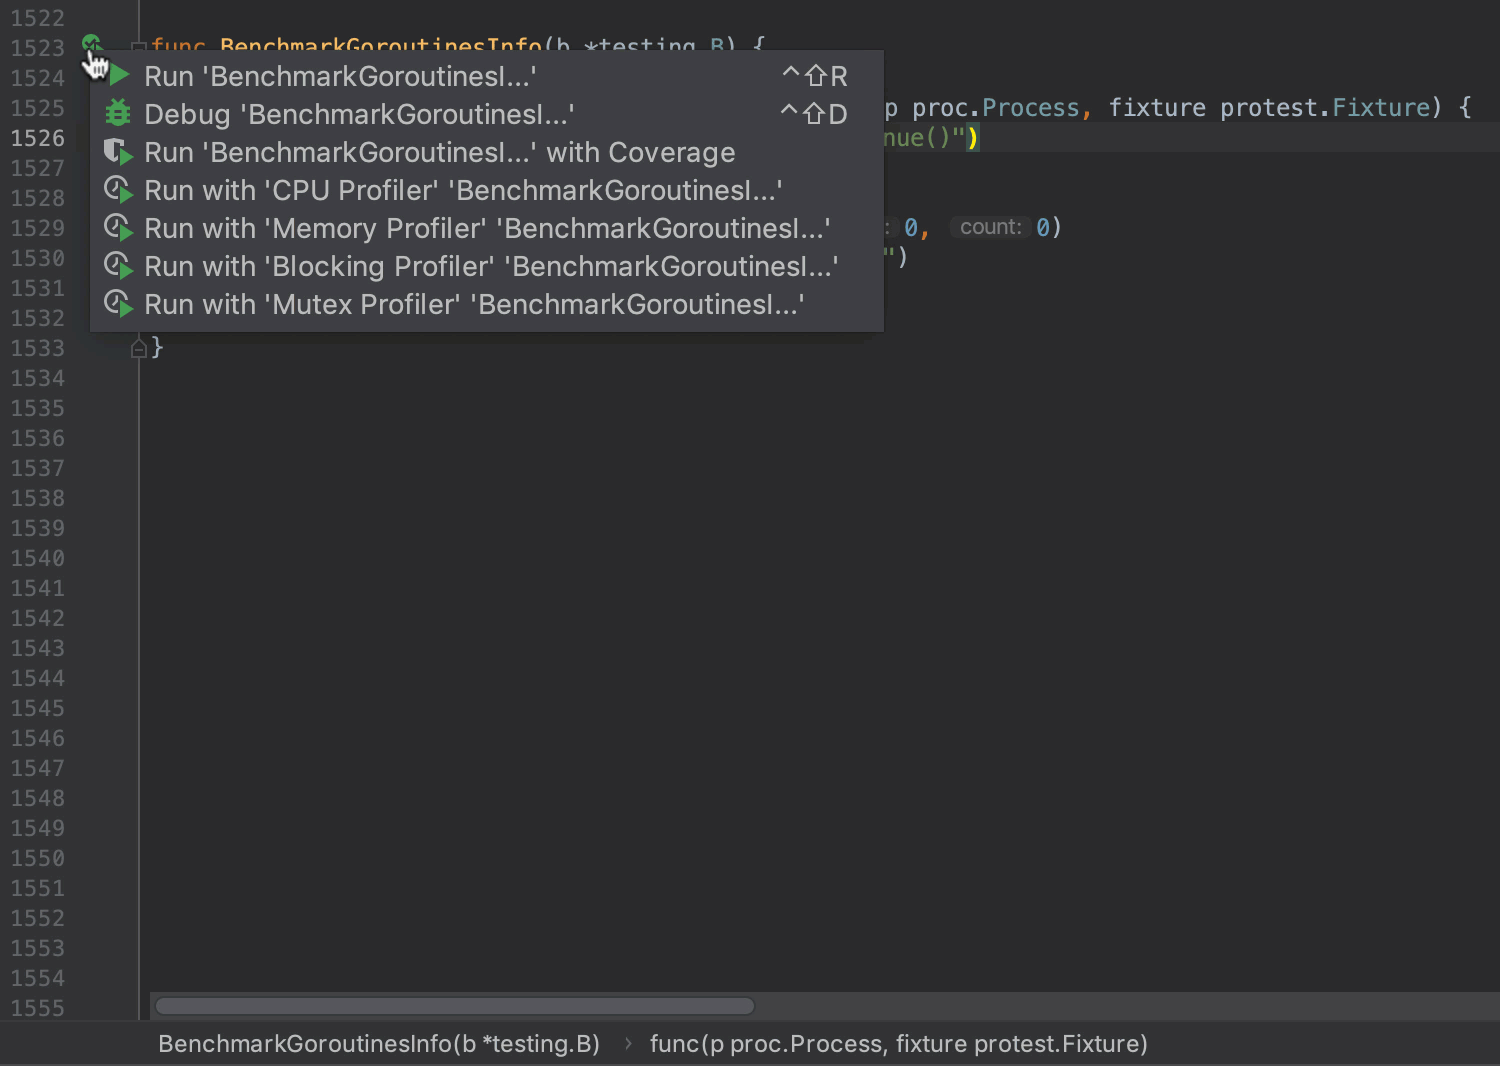
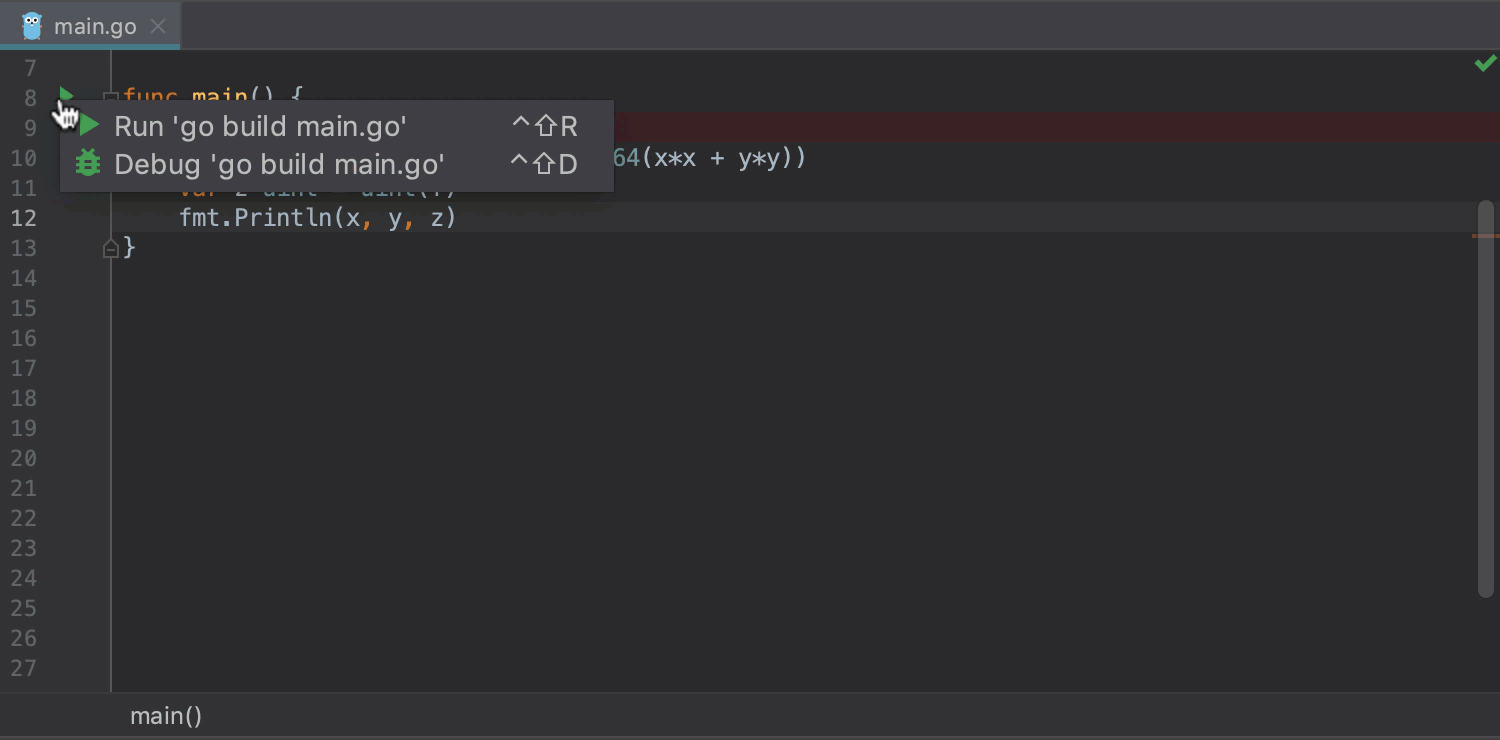
We added integration with Memory, CPU, Mutex and Block profilers! Now you can run any of them with a single click and analyze the results of profiling without leaving the IDE.
This new action is available in the Run menu, in the navigation pane, and in the context menu of test launch icons. For the results of code profiling, see the Profiler window ( View | Tool Windows | Profiler ).
To get a clearer picture of performance problems, use the Flame Chart , Call Tree and Method List tabs . In addition , for each type of profiler, we added metrics corresponding to its type. For example, the Memory Profiler allows you to sort and examine results by the metrics of Allocated objects , Allocated space , In-use objects, and In-use space .
In addition, from the Profiler window you can go to the source code in one action by pressing the F4 key.
Read more about profiling applications and tests in GoLand read here (in English).
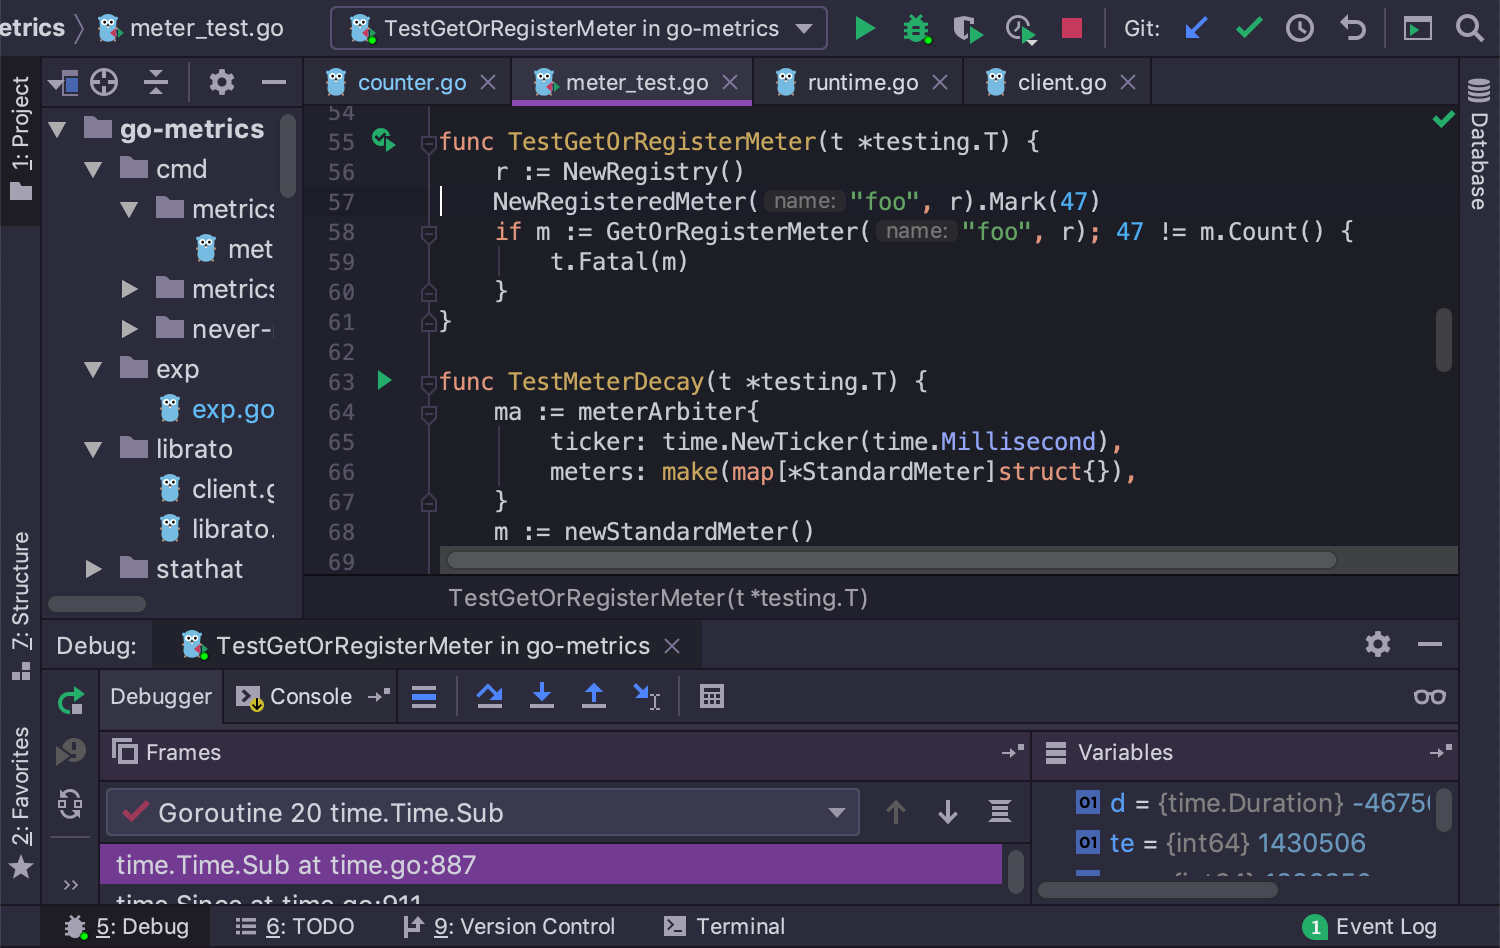
Debugging
This version has a lot of different functionality for the debugger.
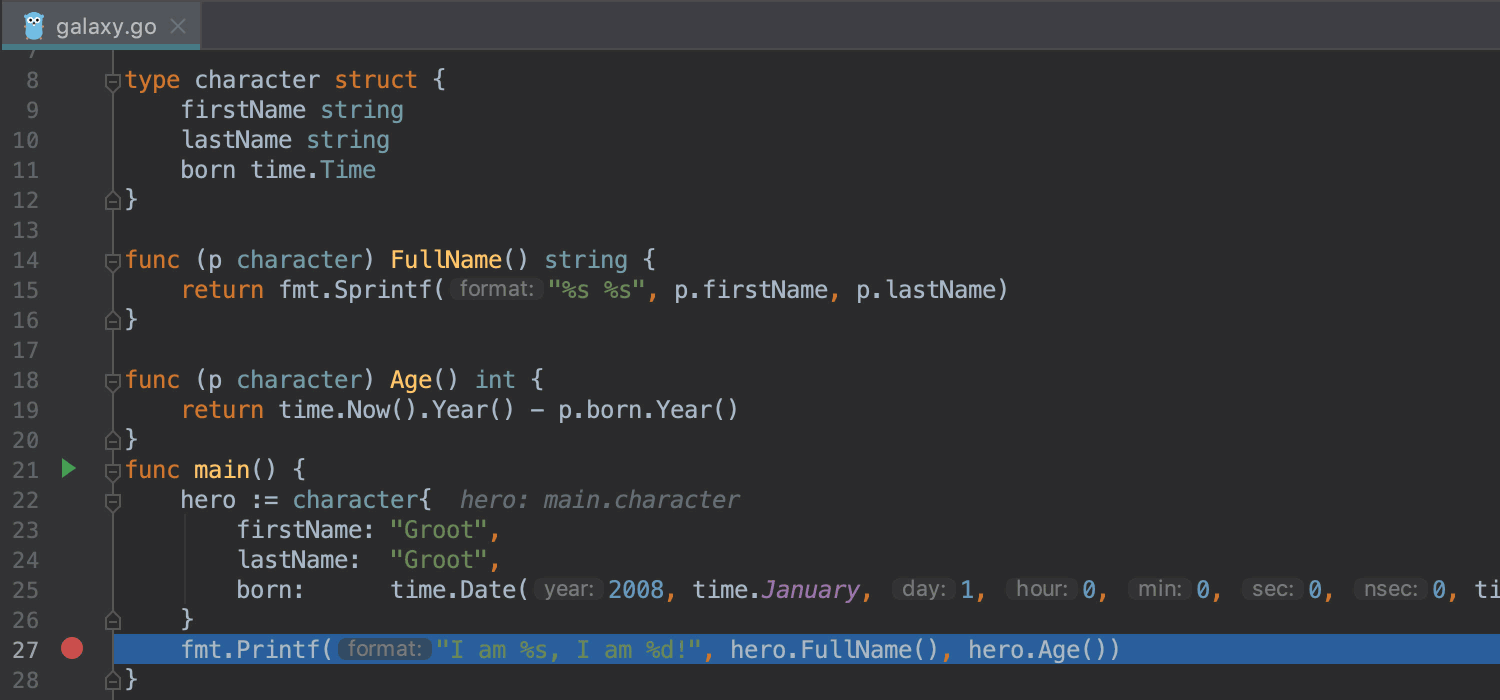
The new Smart Step Into action makes it easy to debug a chain of calls and nested method calls. It performs the necessary call in the expression, automatically stepping over methods that do not interest you.
For example, when debugging the fmt.Printf code (“My name is% s, I am% d!”, Me.FullName (), me.Age ()), you can go directly to the Age () call.
To trigger this action, press Shift + F7 or select Smart Step Into from the Run menu.
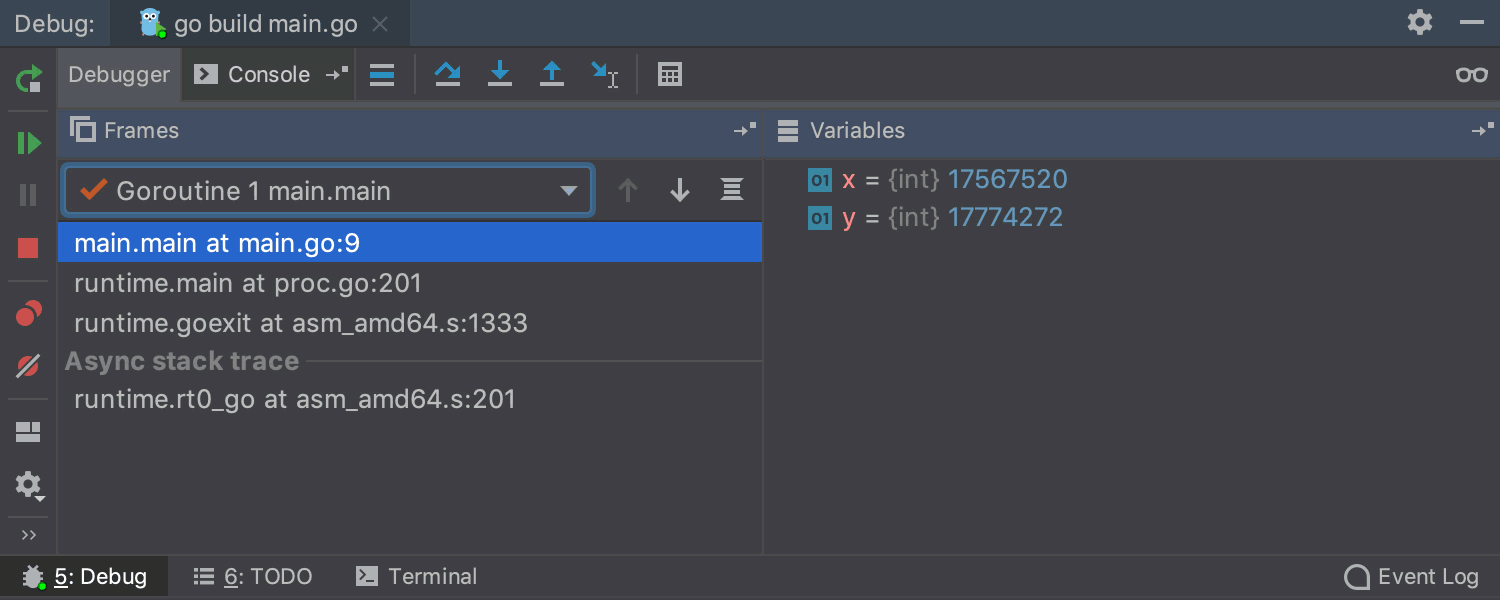
The debugger now shows gorutins by default instead of streams. However, you can quickly switch between them if necessary.
Use the Copy Stack action on the right mouse button on the gorutin to copy the entire stack to the clipboard.
')
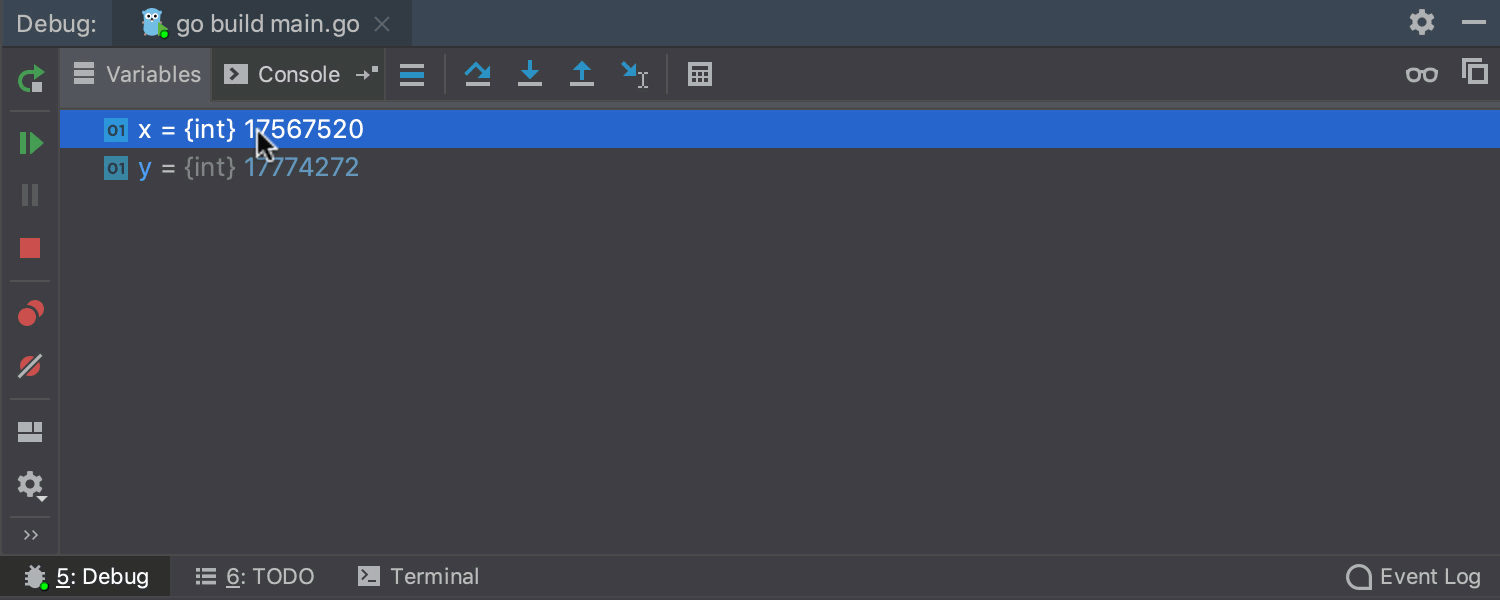
Right clicking on an int variable will translate its value into binary, decimal, or hexadecimal.
Run to cursor is now activated by clicking on the line number during debugging. Hover over a line to select it, and click its number to start Run to cursor .
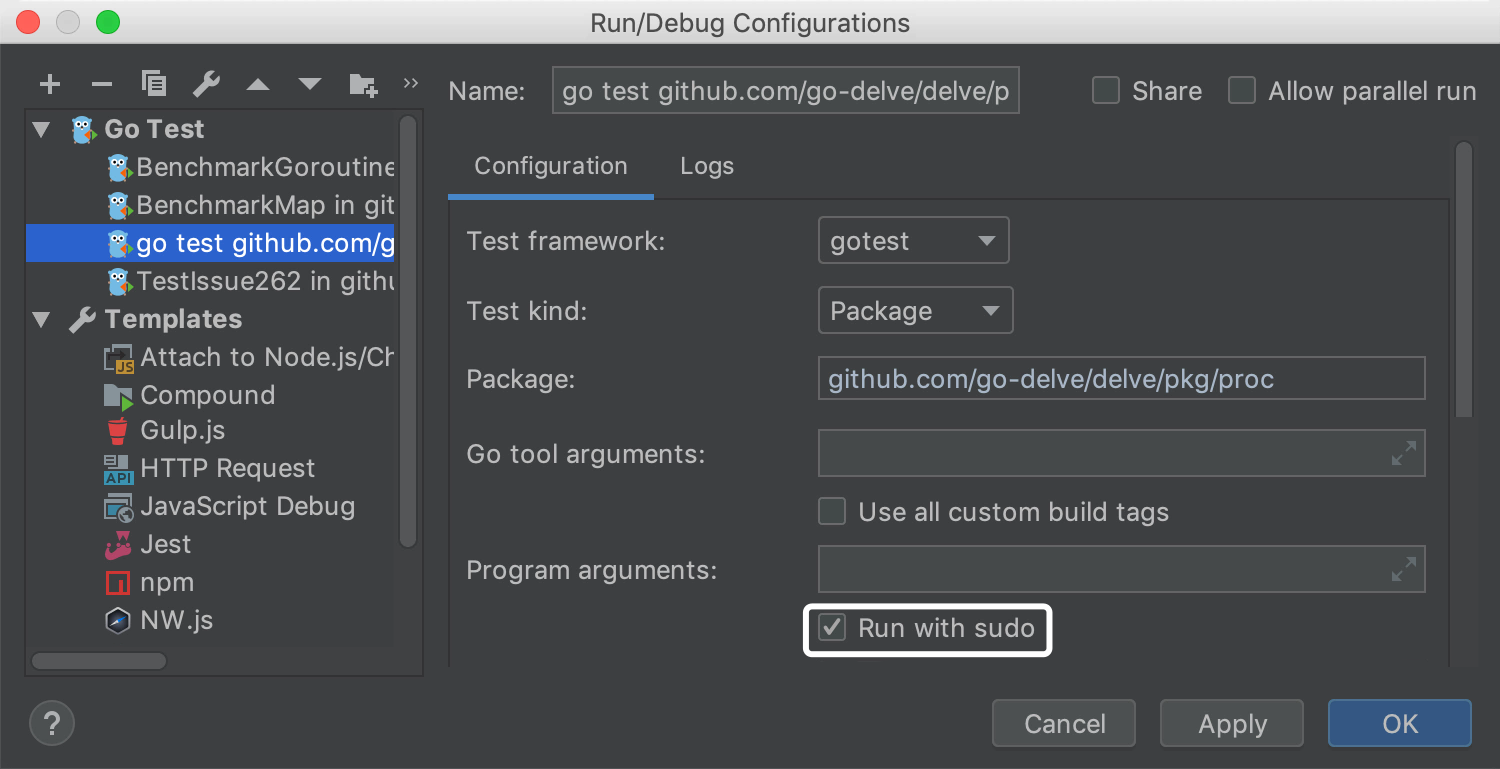
Run / Debug Configurations can now be run from sudo. This allows you to debug applications that require privileges from the user.
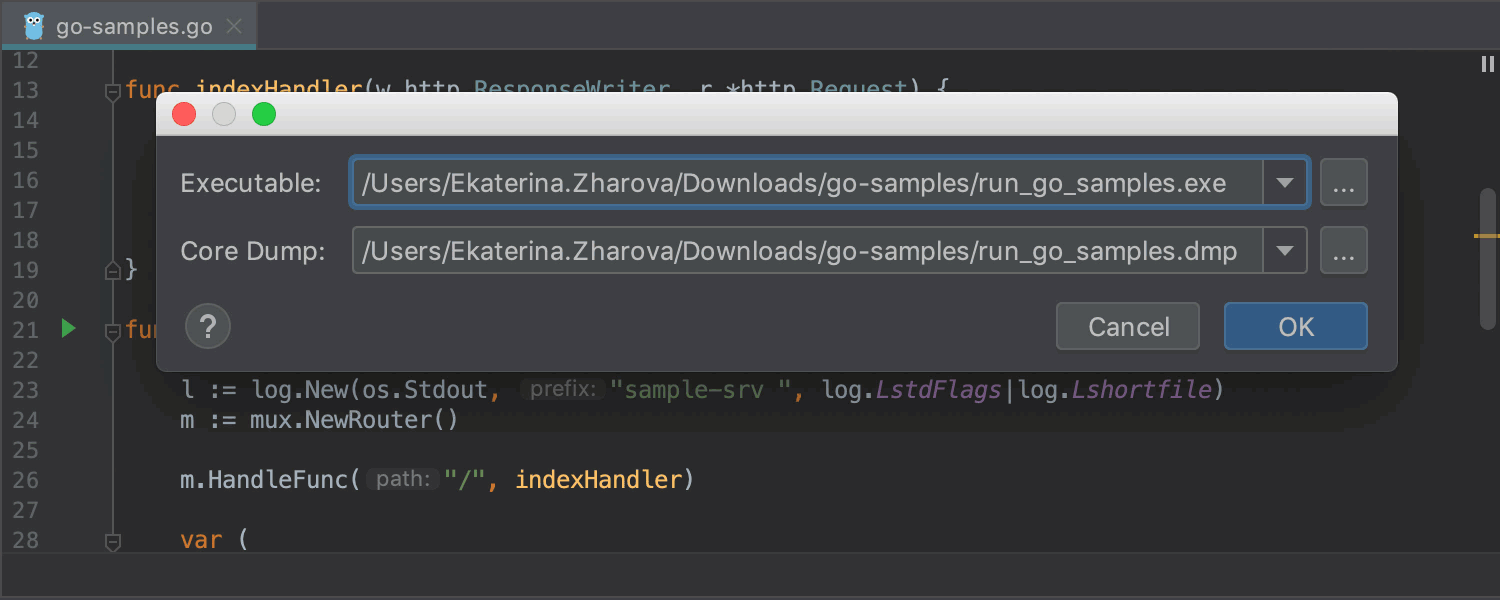
In the previous release, we added support for analyzing memory dumps. Now you can analyze small memory dumps created by Windows. To get started, select Open Core Dump in the Run menu.
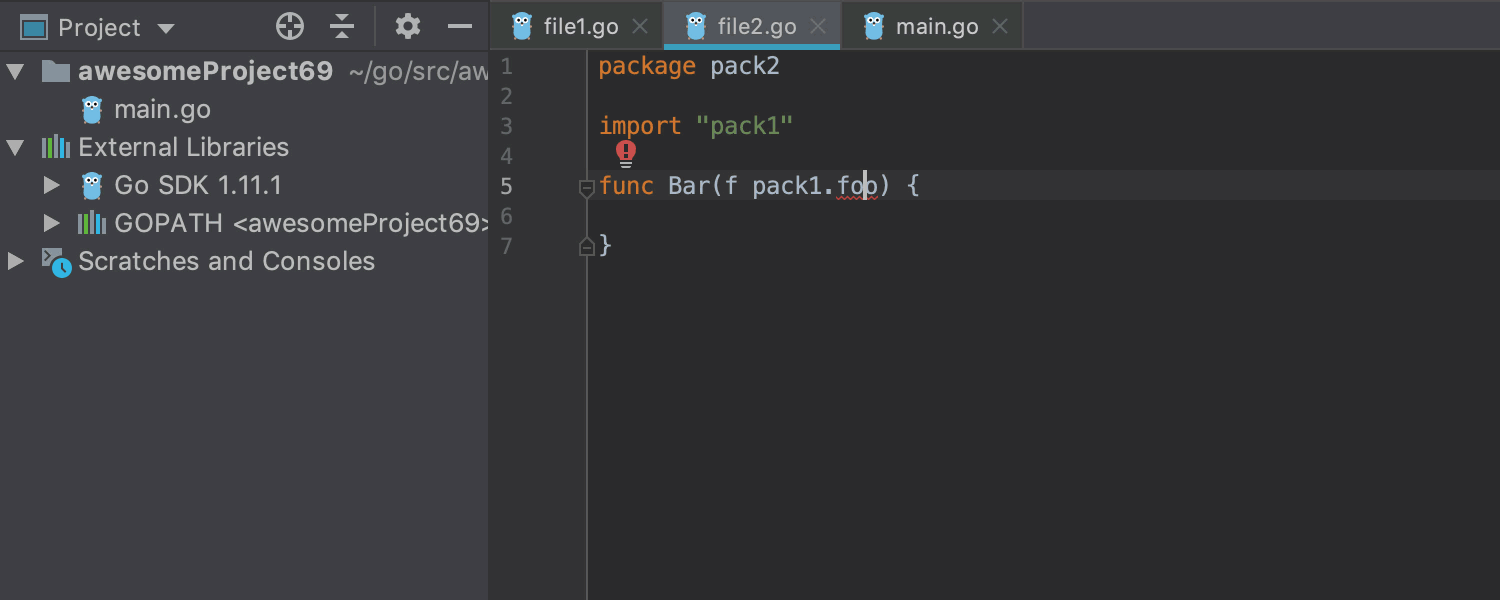
Code refactoring
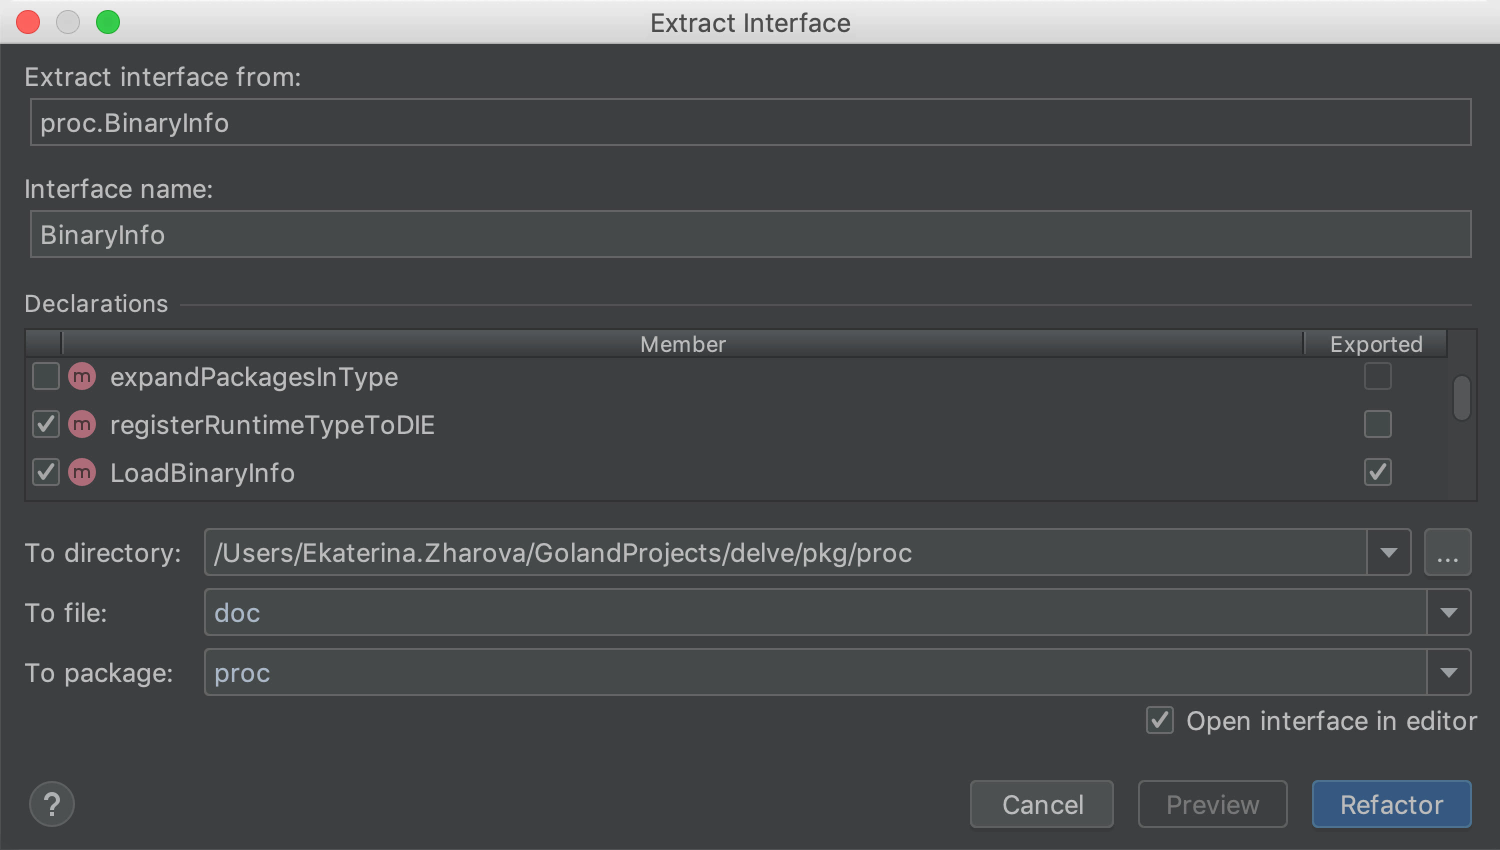
Refactoring Extract Interface helps you quickly create a new interface based on the type you select, extracting the necessary method definitions from it.
In the refactoring dialog box, you can select methods on the basis of which a new interface will be created from this type. There you can also specify its name and select the file, folder and package in which this interface will be located.
To trigger refactoring, press Ctrl + Alt + Shift + T on Windows / Linux or ^ T on macOS and select Extract Interface from the pop-up menu.
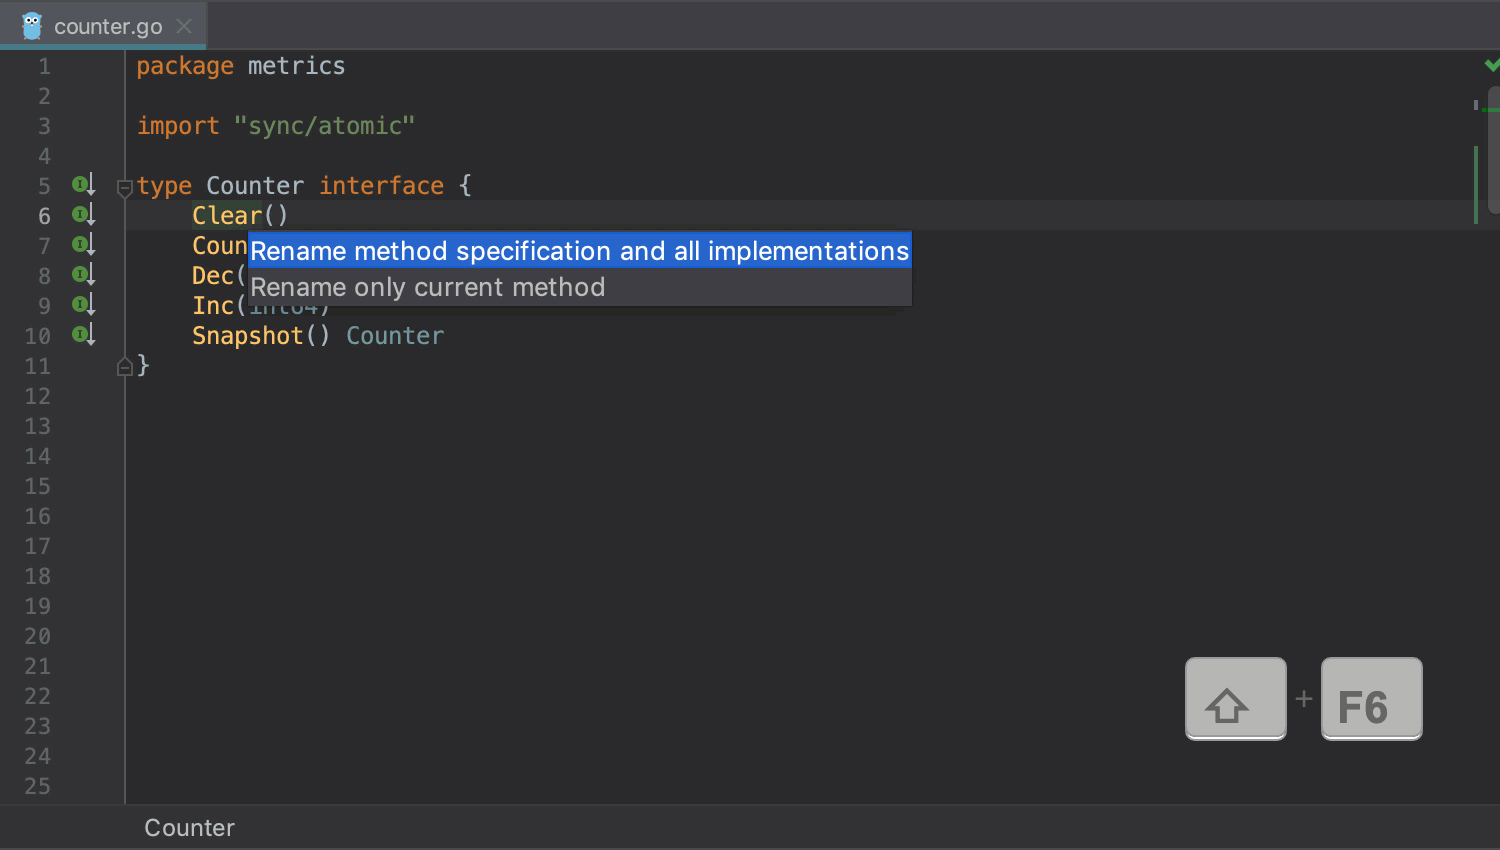
Rename can now rename methods declared in interfaces. When renaming such methods, GoLand will also suggest renaming their implementations.
Before you apply refactoring, see what happens in the preview pane.
Code check
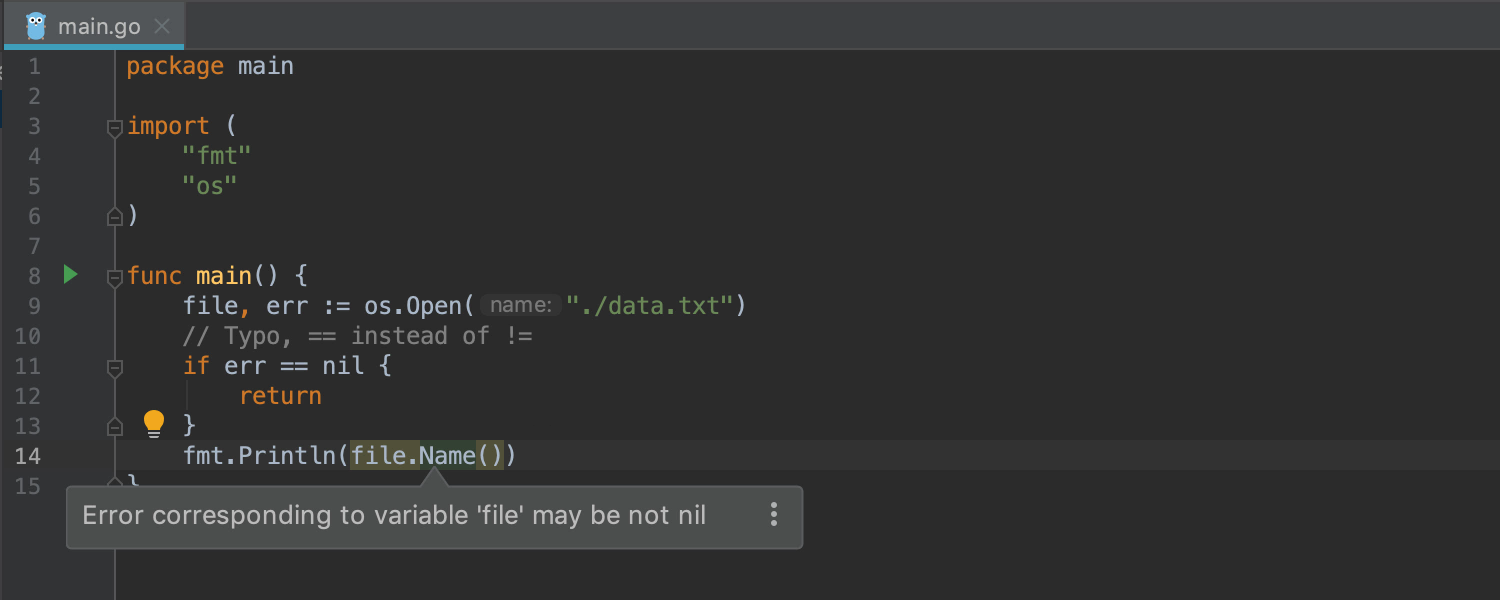
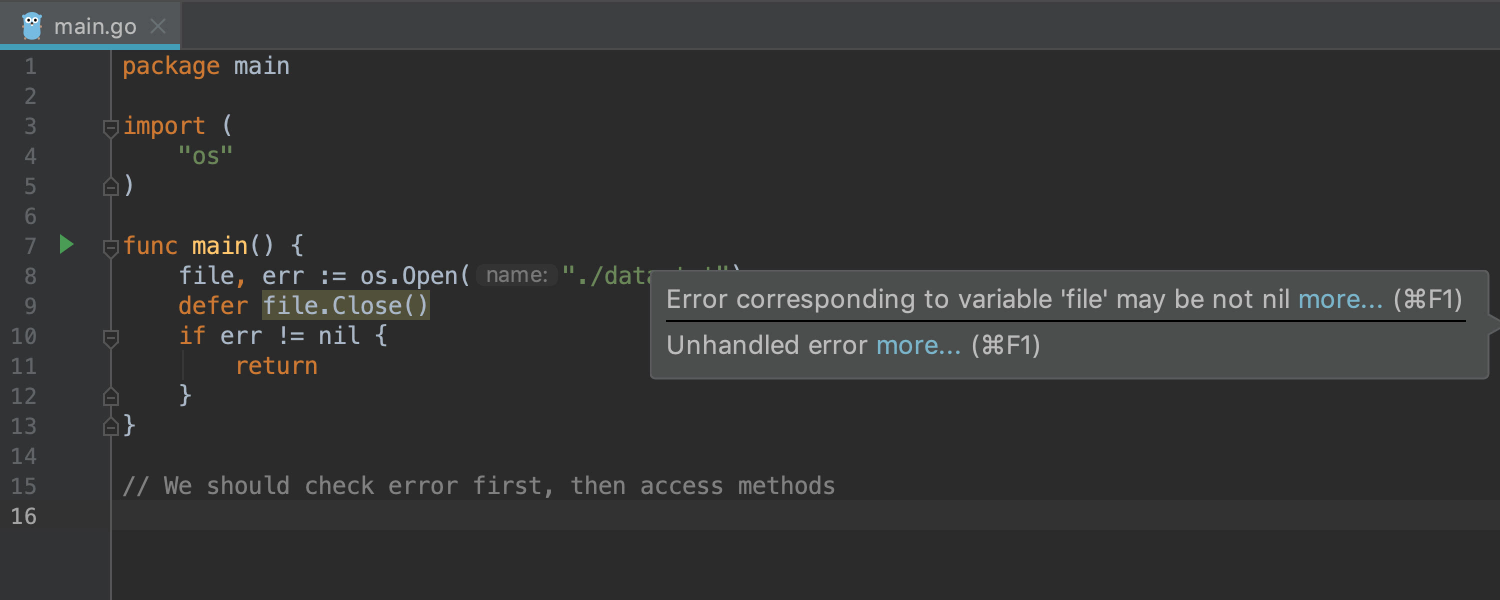
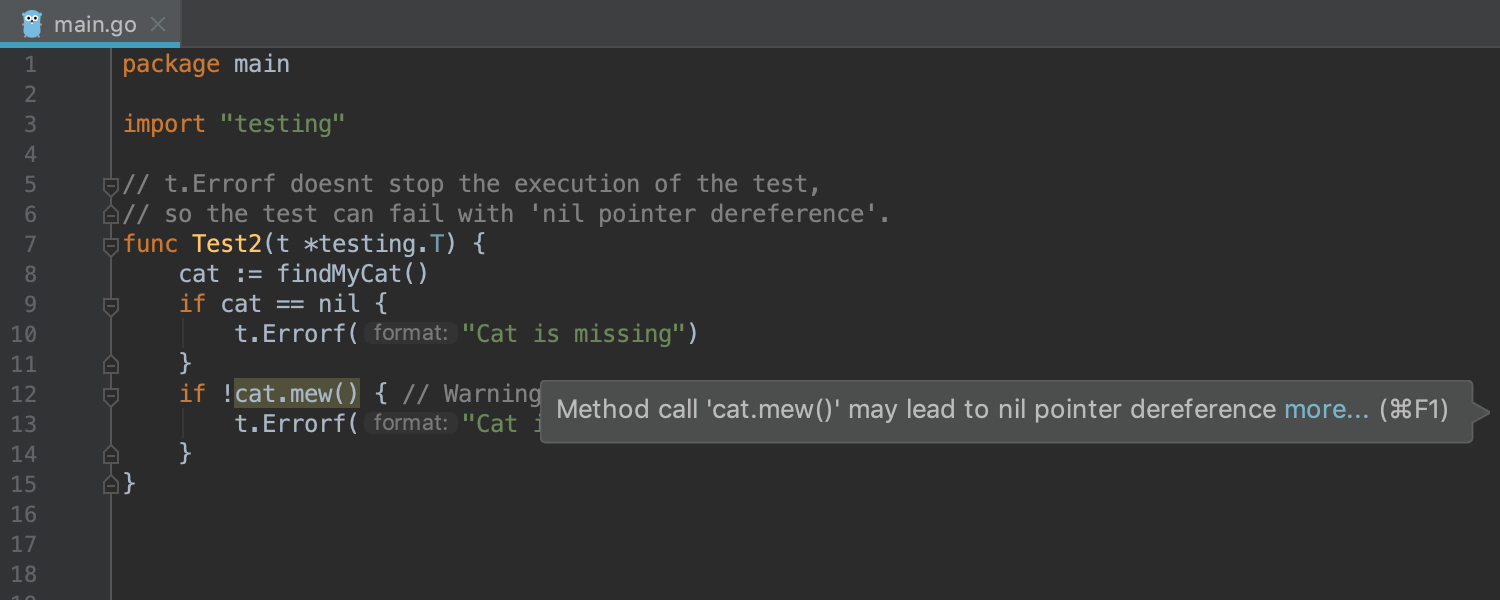
Nilness Analyzer is a set of inspections that determine whether variables can be nil or not, and warn you about potential vulnerabilities and errors in the code that can cause runtime panic. For example, using structure fields using the nil pointer, calling methods on the nil interface, accessing nil slices, and so on.
Go modules
GoLand offers code completion options for all modules that are in the cache. In other words, if the module has never been imported and used in this project, but you have used it ever before in another, GoLand remembers and tells you about it.
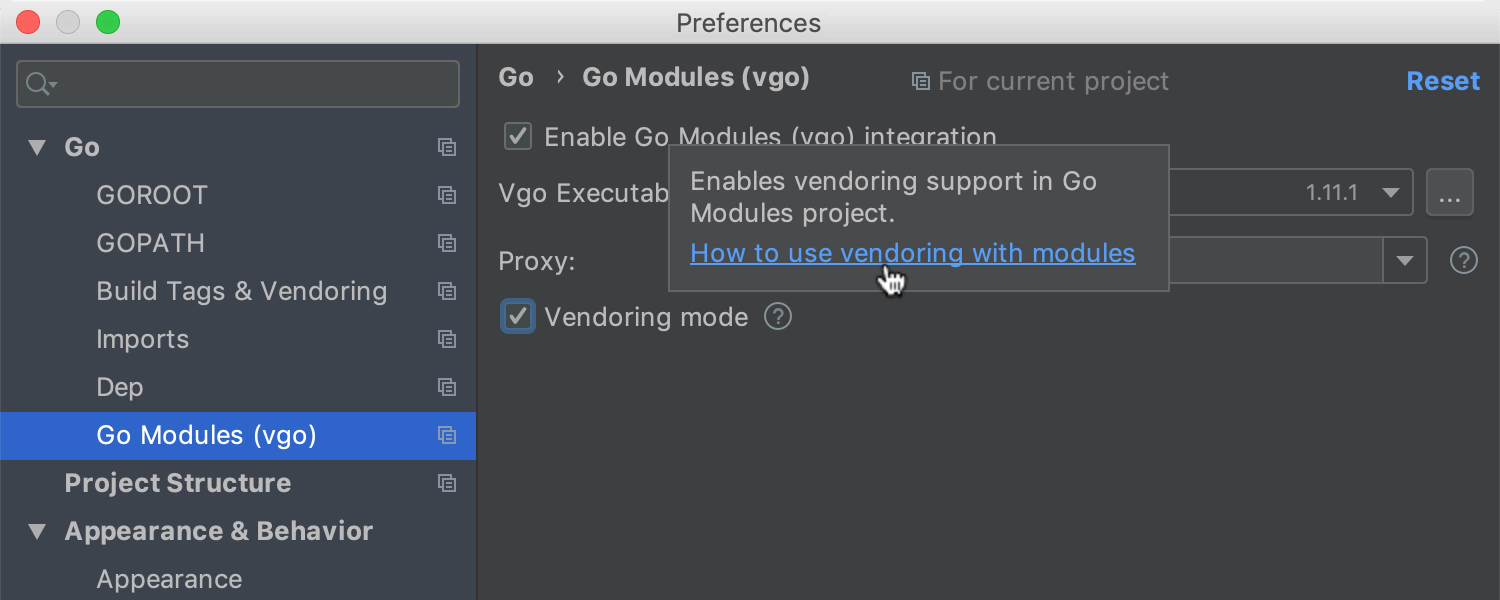
When creating a Go Module project, you can now select Vendoring mode . This mode allows you to use libraries from the vendor folder without any external dependencies or Internet connection. This option is also in the settings: Preferences | Go | Go Modules (vgo) .
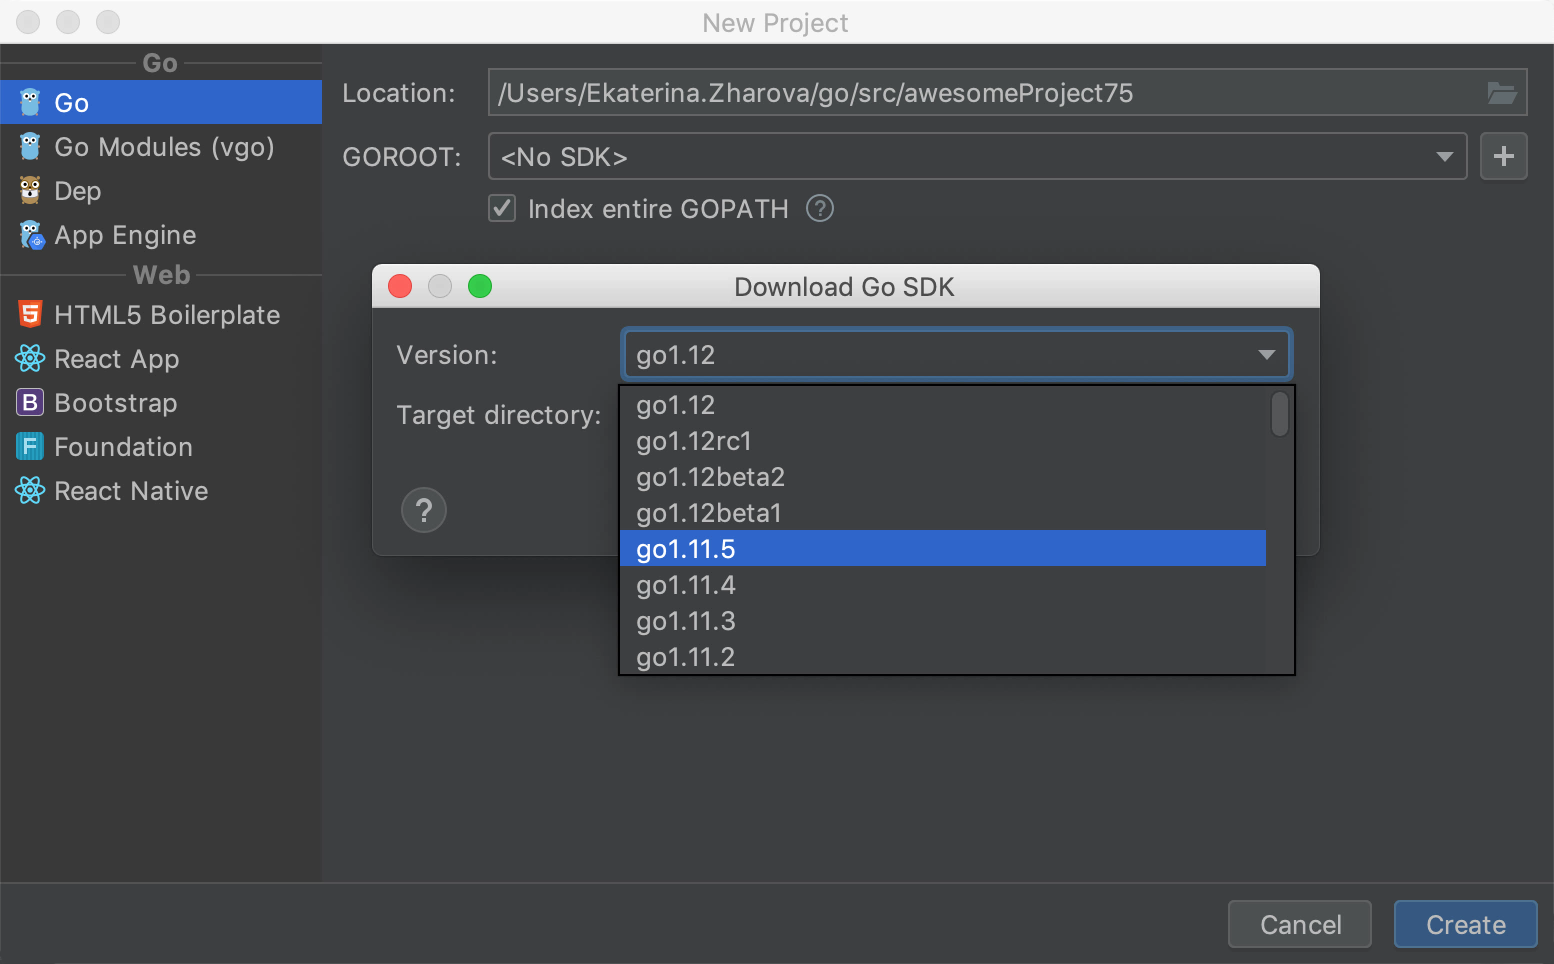
Install any version of the GO SDK directly from GoLand
When creating a new project in GoLand, you can download and install any version of the SDK, including the Beta and RC versions, without leaving the IDE.
As soon as the selected SDK version is installed, GoLand will report this in the Event Log window.
Work with code
We added a set of actions to simplify working with variable, constant, and type declarations. You can add parentheses to ads or remove them from there, combine ads, divide ads into two groups, separate them with commas and much more.
For a complete list of actions, see the settings: Settings / Preferences | Editor | Intentions .
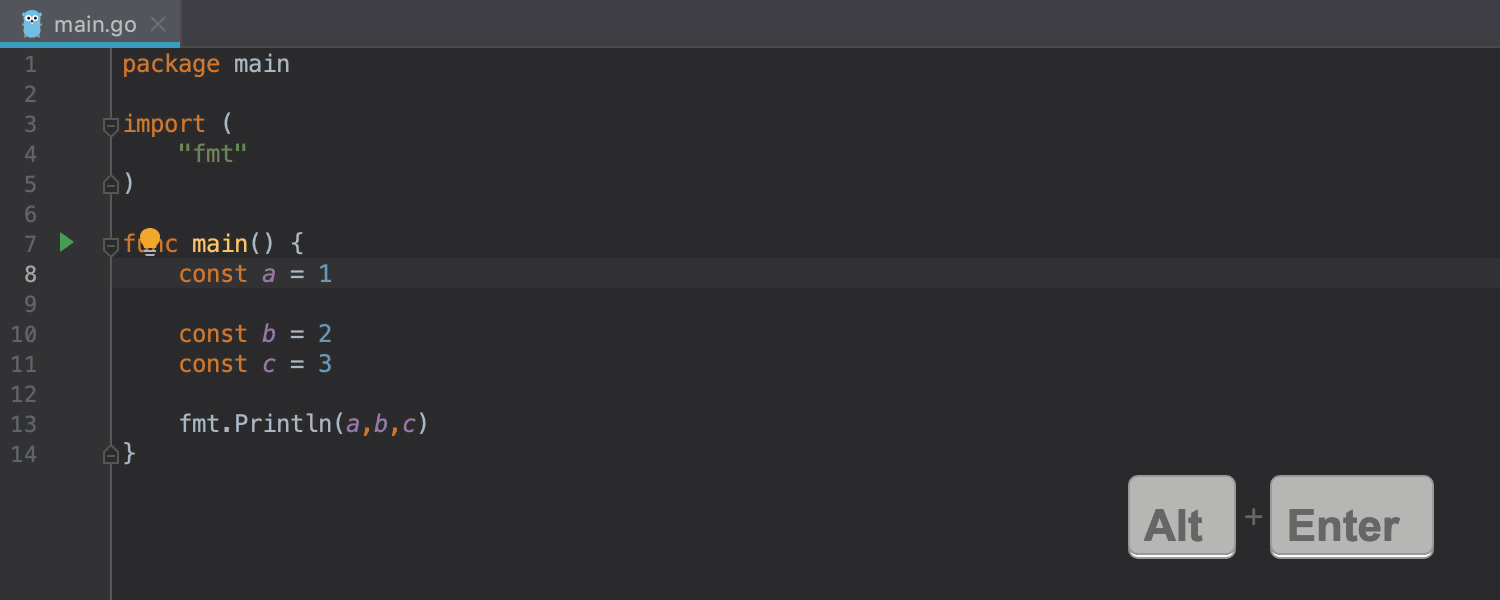
The new Export action exports a function, type, variable, or constant from another package right at the point of use, without having to go to the declaration.
Custom themes
Starting with version 2019.1, you can create any color schemes for all our IDEs based on IntelliJ IDEA. The new scheme is used as a plugin, so they are also easy to share with others. We could not resist and made several of our options: Dark Purple , Cyan Light and Gray .
Read how to make your own threads here:
General changes
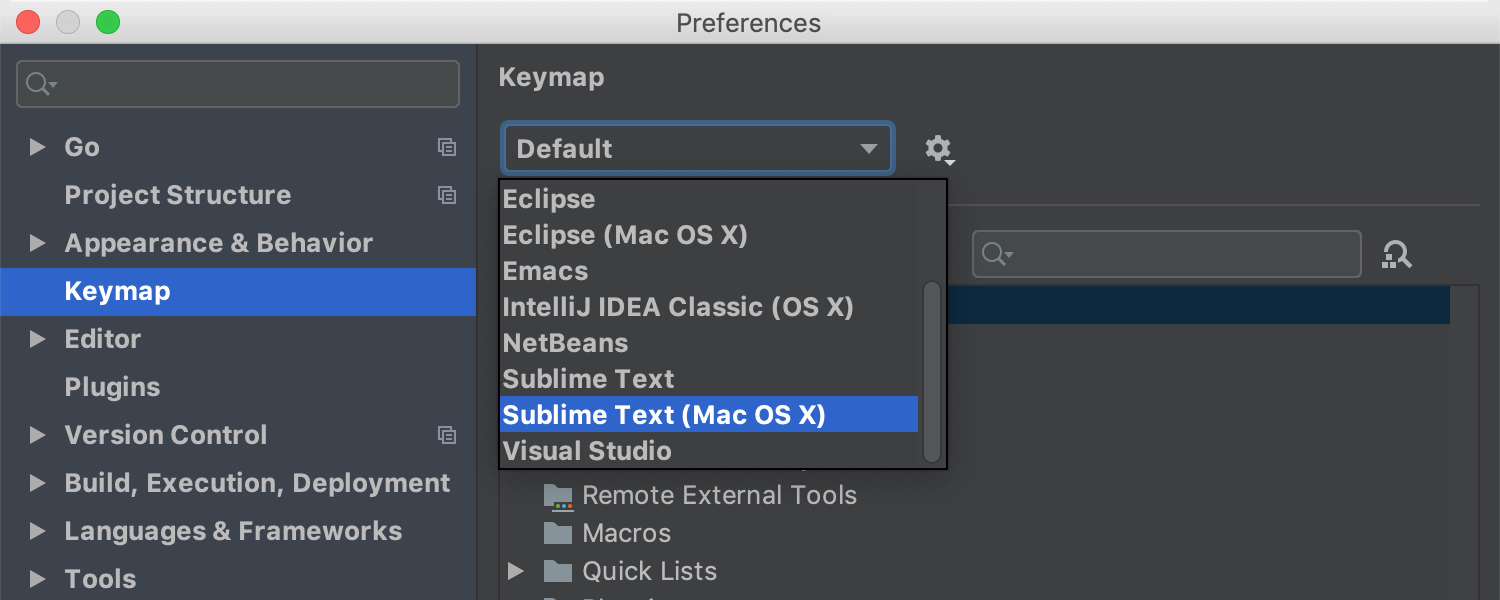
Added keyboard layout to settings Sublime Text: Preferences / Settings | Keymap The layout for VS Code can be used with this plugin .
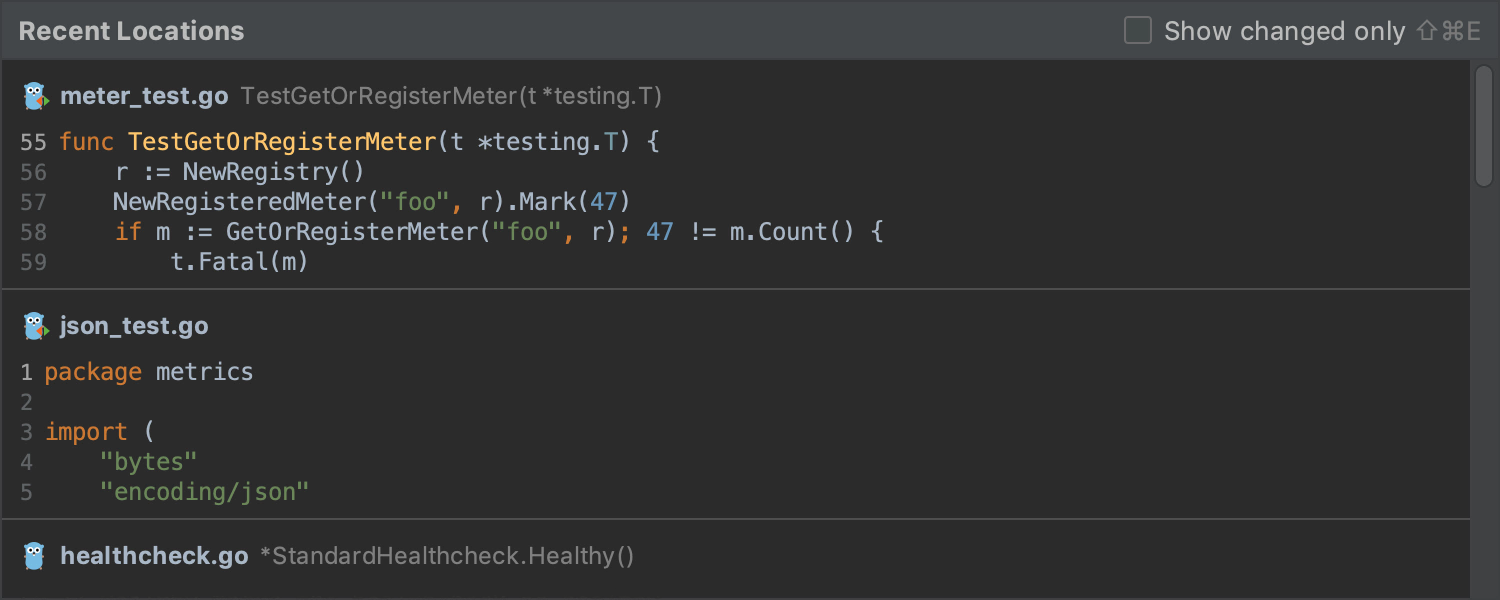
Recent Location popup - new search center. It shows a list of all the places in the project code where you made some changes or just read the code. The default shortcut: Shift + Ctrl + E on Win / Lin, ⇧⌘E on macOS.
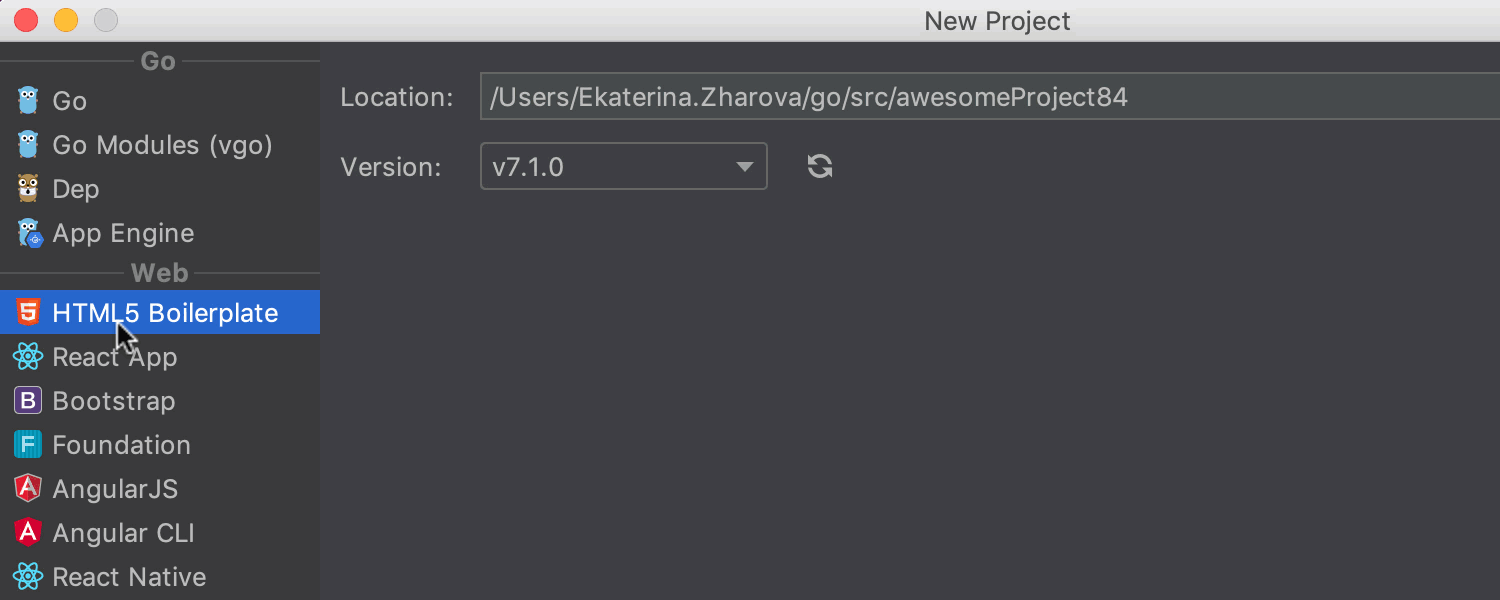
On the initial screen, we added project development templates for web development, such as React App, React Native, HTML5 Boilerplate, and Foundation.
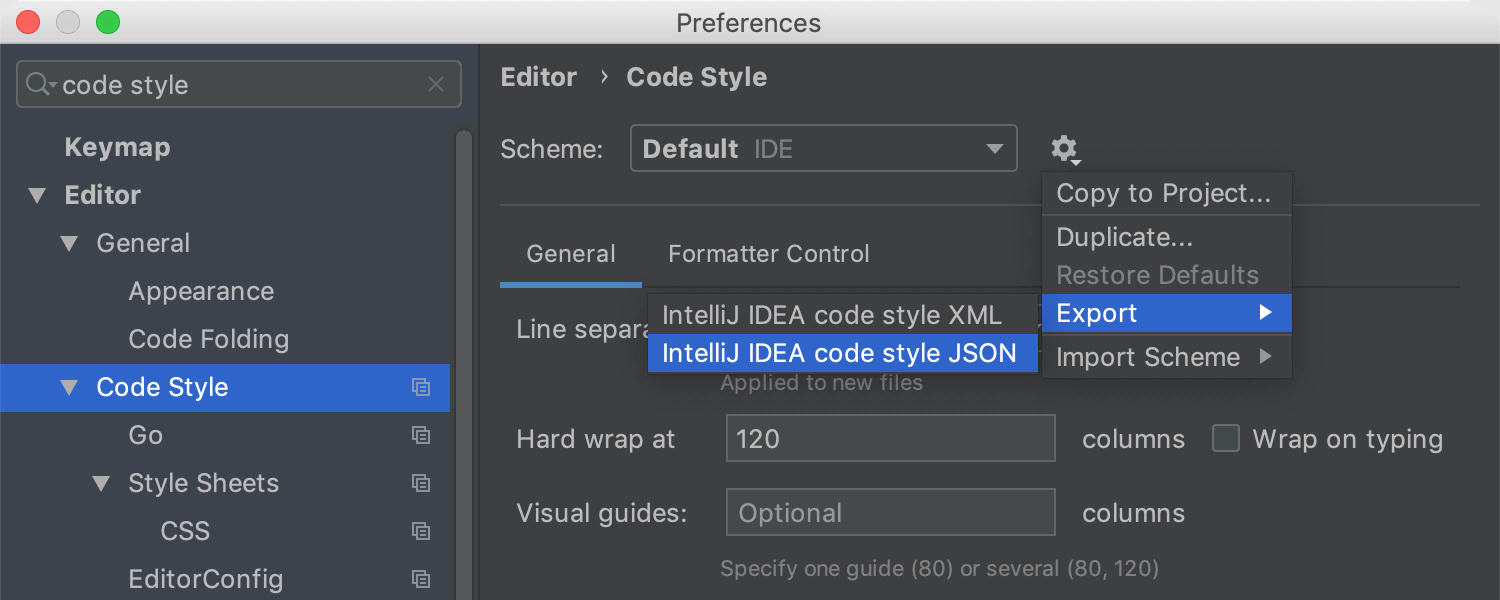
Now you can export the code style settings to JSON format. This is an addition to the existing XML export option: Preferences / Settings | Editor | Code Style .
That's all! Read about the changes of this release in more detail or see a short demo (in English):
By the way, ideas for improvements, we often take from your feedback and suggestions. Email us here in the comments, in our bug tracker or Twitter .
And just in case, I remind you that if you already use IntelliJ IDEA Ultimate, then all the features of GoLand are available right there, you just need to install this plugin .
Thanks for attention!
Source: https://habr.com/ru/post/447570/
All Articles