The book "Unity and C #. Gamedev from idea to implementation. 2nd ed »
 Hi, Habrozhiteli!
Jeremy Gibson Bond, conceiving this book, set himself a simple goal: to acquaint you with all the tools and transfer the basic knowledge necessary to achieve success in the development of games and prototypes. The author tried to squeeze the maximum amount of knowledge into this book. Unlike many other books, this one combines both disciplines — game design and digital development (that is, computer programming) —and wraps them with the practice of iterative prototyping. The emergence of advanced and relatively easy-to-use game engines, such as Unity, made it even easier to create prototypes that express game design concepts, and increased your chances of becoming a qualified (and sought-after) game designer.
The book is divided into four parts.
Part I. Designing the game and prototyping on paper
The first part of the book begins with a study of various game design theories and the analytical foundations of game design, proposed in some earlier books. This part describes a layered tetrad (Layered Tetrad) - a way to combine and expand the best features of these earlier theories. Much attention has been paid to the study of multi-level tetrads, because it concerns many decisions that you will have to make as an interactive interaction designer. This part also contains information about the interesting problems of various disciplines of game design; describes the process of prototyping on paper, testing and performing iterations; specific information is given that can help you become one of the best designers; It presents effective project and time management strategies that help to ensure adherence to the project development schedule.
Part II. Digital prototyping
The second part of the book teaches programming. This part is based on my many years of experience in teaching non-technical students in the techniques of expressing ideas for designing games in digital code. If you have no experience in development or programming, this part is for you. But even those who have some experience can view this part in order to get acquainted with new techniques or to refresh some approaches in their memory. The second part covers C #, our programming language, from the very basics to the inheritance of classes and object-oriented programming techniques.
')
Part III. Game Prototypes and Examples
The third part of the book includes several examples, each of which demonstrates the process of developing a prototype game of a particular genre. This part has two objectives: it reveals some advanced techniques for rapid prototyping of games on the example of my own approach to prototyping and helps to form the foundation, based on which you can create your games. Many books telling about Unity (our environment for game development) use a similar approach, but lead the reader through a single monolithic example over several hundred pages. In contrast, this book provides several much shorter examples. The end results of these examples are inevitably less reliable than those found in other books, but I am convinced that diversity will help you better prepare for creating your own projects in the future.
Part IV. Applications
There are several important applications in this book that are worth mentioning here. In order not to repeat the same information and not force you to search for it in different chapters, all the information that is repeatedly mentioned in the book or to which, it seems to me, you want to refer later (when you finish reading the book for the first time) is placed in applications. Appendix A contains a brief step-by-step introduction to the process of creating a project for a game in Unity. The longest application is Appendix B, Useful Ideas. Despite the unassuming title, I am sure you will most often refer to this application after reading the book for the first time. “Useful Ideas” is a collection of advanced techniques and strategies that I use all the time when performing prototyping games, and I think that here you will find many interesting things for yourself. The third and final application is a list of links to resources on the Internet, where you will find answers to questions not covered in this book. It is often difficult to determine the right place for seeking help; This appendix contains links that I use most often.
Excerpt Using Google Sheets to Balance Weapons
Another use of mathematics and software, such as Google Sheets, in designing games is to balance different types of weapons and capabilities. In this section, you will see the process of balancing weapons for a game similar to Sega's Valkyria Chronicles. In this game, each weapon has three important characteristics:
- The number of shots made simultaneously.
- The degree of damage done by each shot.
- The probability of hitting the target of each fired bullet at a given distance.
When balancing different types of weapons, the goal is usually to make them approximately equal in power, but at the same time impart distinctive features. For example, such distinctive features may be in some types of weapons:
- Pistol: main weapon; allows you to cope with most situations, but not the best.
- Rifle: A good choice for hitting targets at medium and long distances.
- Shotgun: killer weapons at short distances, but its power drops rapidly with increasing distance; has a low rate of fire, so accuracy is important.
- Sniper rifle: an extremely unfortunate choice for close combat, but a fantastic weapon for long range shooting.
- Machine gun: it has a high rate of fire, therefore, even with not very high accuracy, it has a high lethal force, thanks to which it seems to be the most reliable weapon, although not the most powerful.
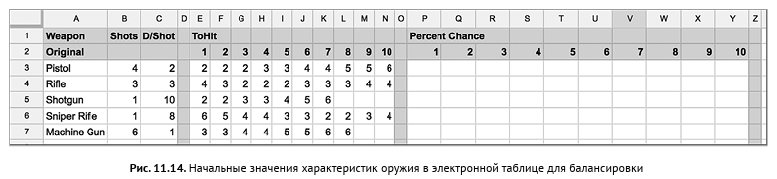
In fig. 11.14 shows the values of the characteristics of the weapon, which seemed to me successful at first glance. The ToHit value (To Hit) is the minimum number of points that fell on a six-sided die, which means hitting the target at a given distance. For example, for a pistol in cell K3, corresponding to a distance of 7 units, the number 4 is indicated, that is, if a player makes a shot at a distance of 7 units, it will be considered that he hit the target if the number of the die is 4 or more. This gives a 50% chance to hit (because a hit is counted if 4, 5, or 6 points fall out).
Determining the probability of hitting for each bullet
In the cells under the heading Percent Chance, we need to calculate the probability of hitting the target of each bullet fired from this weapon at a given distance. To do this, follow these steps.
1. Create a new document in Google Sheets and enter all the data, as shown in Figure. 11.14. To change the background color of cells, use the Cell Color button in the cell formatting tools (Figure 11.2).
Judging by the value in cell E3, a shot from a pistol at a distance of 1 unit achieves a goal if 2 points or more drops on a die roll. This means that a miss occurs only when 1 point falls, and when 2, 3, 4, 5 or 6 points fall, the shot reaches the target. Hence, the share of hits is 5/6 (or ≈ 83%), and now we need a formula for calculating it. According to probability determination rule 7, this corresponds to a miss probability of 1/6 (that is, the number in ToHit minus 1 and divided by 6).
2. Select cell P3 and enter the formula = (E3-1) / 6. As a result, the P3 cell displays the probability of a pistol miss at a distance of 1 unit. Arithmetic operations in Sheets are performed in accordance with the rules of mathematics, so the division will be performed before subtraction, if you do not enclose the expression E3-1 in parentheses.
3. Again, we use rule 7. According to it, 1 is the probability of a miss = probability of defeat, therefore, replace the formula in cell P3 by = 1 - (((E3-1) / 6). Now the number 0.8333333 should appear in it.
4. To convert the decimal fraction in cell P3 to percents, select cell P3 and click on the button with the% symbol in the number formatting tools area, as shown in Figure. 11.2. You can also click a button to the right of the button with the% symbol (with the inscription .0 and the arrow to the left) a couple of times. It will remove decimal places, and only the number 83% will be displayed in the cell instead of the more accurate but confusing% 83.33. In this case, only the displayed value will change - the actual number will remain the same - and the cell will maintain accuracy for further calculations.
5. Copy the formula from cell P3 and paste it into all cells P3: Y7. You will see that all calculations were performed safely, with the exception of empty cells in the ToHit section, for which the percentage of hits is 117%! Change the formula to ignore empty cells.
Select cell P3 again and replace the formula in it with = IF (E3 = "", "", 1 - (((E3-1) / 6)). The IF function in Sheets has three arguments, separated by commas.
- E3 = "": argument 1 - condition: is the contents of cell E3 equal to the empty value ""? (i.e., is E3 an empty cell?)
- "": argument 2 - what to put in the cell, if the condition in the first argument is true. That is, if E3 is an empty cell, clear cell P3.
- 1 - ((E3-1) / 6): argument 3 - what to put in the cell if the condition in the first argument is false. That is, if E3 is not an empty cell, use this formula.
7. Copy the new formula from cell P3 and paste it into cells P3: Y7. Now the empty cells in the ToHit section will correspond to empty cells in the Percent Chance section. (For example, L5: N5 are empty cells, so the corresponding W5: Y5 cells will also be empty.)
8. Next, add some color to this diagram. Select cells P3: Y7. From the Sheets menu, select Format> Conditional formatting. A new Conditional format rules panel will appear on the right side of the window. Conditional formatting allows you to determine the display format of cells depending on their content.
9. Click the Color scale tab at the top of the Conditional format rules panel.
10. In the Preview section of the Color scale tab, you will see the word Default on the green gradient image. Click on the word Default (Default) and select the option below in the center: Green to yellow to red (From green to red through yellow).
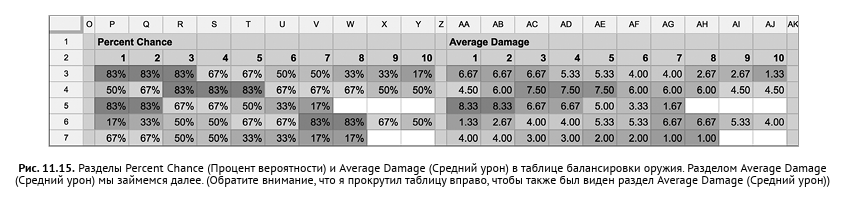
11. Click the Done button, and the Percent Chance section takes the form shown in fig. 11.15.
Average damage calculation
The next step in the balancing process is to determine the average damage inflicted by each weapon at a certain distance. Since some types of weapons make several shots at once and each shot causes a certain damage, the average damage will be equal to the product of the number of shots and the damage of one shot and the probability of each bullet:
1. Select the O: Z columns and copy them (press the Command-C or Ctrl + C combination on the PC or select the menu item Edit> Copy).
2. Select cell Z1 and perform an insert (Command-V, Ctrl + V on the PC, or select the menu item Edit> Paste). As a result, additional AA: AK columns will be added to the table and filled with data from the newly copied columns.
3. Enter the text Average Damage in cell AA1.
4. Select cell AA3 and enter the formula = IF in it (P3 = "", "", $ B3 * $ C3 * P3). Just as in the formula for cell P3, the IF function ensures that calculations will be performed only for non-empty cells. The formula includes absolute references to the $ B and $ C columns, because column B stores the number of shots, and column C - damage inflicted by one shot, regardless of the distance from the enemy. In this case, only row numbers, but not columns, should be shifted during copying (therefore, only columns are described by absolute references).
5. Select cell AA3 and click on the right-most button in the toolbar.
by the formatting numbers (with 123 ). Select item Number
(Number) in the menu that opens.
6. Copy cell AA3 and paste it into cells AA3: AJ7. Now they will display exact values, but conditional formatting is still tied to the Percent Chance section, which causes numbers above 1 to force percentages in the range from 0 to 100% in the Percent Chance section to appear on the green background.
7. Select cells AA3: AJ7. If the Conditional format rules panel
formatting) is no longer displayed, select Format> Conditional formatting from the main menu to re-open it.
8. With the selected cells AA3: AJ7, you should see in the Conditional format rules panel a rule with the name Color scale (Gradient) and with links to cells P3: Y7, AA3: AJ7 below it. Click on this rule.
9. In the opened settings, in the Apply to range section, leave only P3: Y7 and click the Done button. As a result, the previous design of the Percent Chance section will be restored.
10. Select cells AA3: AJ7 again. In the Conditional format rules panel, click the Add new rule button.
11. Select in the Preview field on the Color scale tab the option Green to yellow to red, as before. Then click on the Done button.
As a result, different formatting rules will be applied to the Percent Chance and Average Damage sections. Separating the rules for different areas guarantees their separate application, which is important because the ranges of numbers in different sections are too different from each other. Now the Average Damage section should look like the one shown in Figure. 11.15.
Graphing the average damage
The next important step is to display the graphs of the average damage. Even though a careful study of the numbers already allows you to draw some conclusions, the graphs supported in Sheets will simplify this work and help you visually assess what is happening. To do this, follow these steps.
1. Select cells A2: A7.
2. Scroll the sheet so that you can see the Average Damage section. With the A2: A7 cells still highlighted, press and hold the Command key (or Ctrl on the PC), left-click on cell AA2 and, while holding down the key and mouse button, move the pointer to cell AJ7 to select AA2: AJ7. You should now have two areas: A2: A7 and AA2: AJ7.
3. Click on the diagram button (see fig. 11.2) to open the diagram editor.
4. Click on the Chart type drop-down list (Chart type, which now displays the text “Column chart”, see fig. 11.6A) and select the left-most type in the Line section - this is the top left pictogram with images of blue and red broken lines.
5. At the bottom of the DATA tab, select the Switch rows / columns check box.
6. Select the Use column A as headers check box (Headers - column A values). Also make sure that the Use row 2 as labels check box is selected.
7. Click on the close button of the Chart editor panel to complete the creation of graphs.
As a result, you get a diagram like in fig. 11.16. As you can see, not everything goes smoothly with weapons. Some species, such as the sniper rifle (Sniper Rifle) and the shotgun (Shotgun), have pronounced distinctive features, as we had hoped (the shotgun has great destructive power at close distances, and the sniper
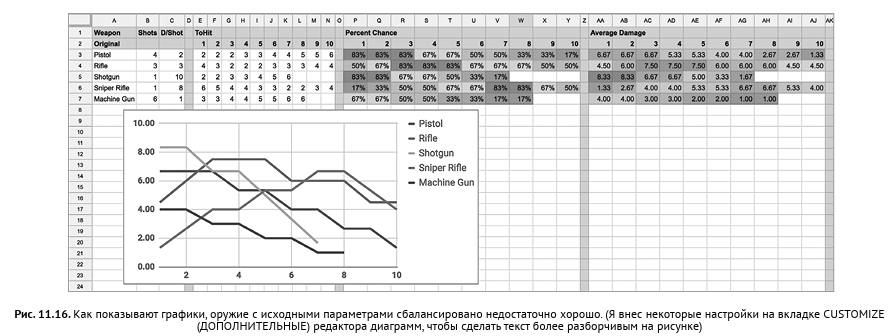
the rifle is better suited for hitting targets at long distances), but among others there are clearly some problems:
- The machine gun turned out to be ridiculously weak.
- The gun (Pistol) turned out, perhaps, excessively powerful.
- The rifle (Rifle) also turned out too powerful compared to other types of weapons.
Simply put, different types of weapons are poorly balanced between themselves.
Duplication of weapon parameters
In the process of balancing a weapon, it is convenient to have before your eyes information before and after balancing:
1. First, move the chart down below line 16.
2. Double-click within the chart, and the Chart editor panel will open. Select the CUSTOMIZE tab (ADDITIONAL) at the top of the panel (Fig. 11.6D). Open the Chart axis & titles section (Titles of Charts and Axes, Fig. 11.6E) and enter Original in the Title field (Source Balance, Fig. 11.6F).
3. Now you need to copy the already added data and formulas. Select cells A1: AK8 and copy them.
4. Click on cell A9 and paste. As a result, new cells should appear A9: AK16 - a complete copy of all previously created data.
5. Replace the text in cell A10 with Rebalanced (After Balancing). In this set we will make changes and try new values.
6. To create a diagram based on the new data that is identical to the one that displays the original data, select cell ranges A10: A15, AA10: AJ15, exactly as you selected cells A2: A7, AA2: AJ7 in steps 1 and 2 in the “ Displays graphs of average damage. Follow the further instructions in that section and create a second chart displaying the balancing values.
7. Position the new chart to the right of the previous one so that you can see both charts and data above them.
8. Replace the name of the new diagram with Rebalanced.
Total damage display
Add another statistic, which is also useful to see - the total damage. This is the sum of the average damage done by the weapon in all ranges, which will allow you to get an idea of the total power of the weapon. To do this, you can use a trick that I often use to create simple histograms inside cells in a spreadsheet (that is, not in the form of individual diagrams). The result is shown in Fig. 11.17.
1. Right-click on the heading of the AK column and in the menu that opens, select Insert 1 right (Insert Right: 1).
2. Right-click on the heading of column B and select Copy. As a result, the entire column B will be copied to the clipboard.
3. Right-click on the AL column heading and select Paste. As a result, the contents of column B will be inserted into the AL column, including the background and font design.
4. Right-click on the heading of the AL column and select Insert 1 right.
5. Enter the Total Damage text in cells AL1 and AL9.
6. Select cell AL3 and enter the formula = SUM (AA3: AJ3). It calculates the average damage inflicted by the gun in all ranges (it should be equal to 45.33).
7. To perform a histogram trick, you need to convert this real number to an integer, that is, the result of the SUM function is required to be rounded. Replace the formula in AL3 with: = ROUND (SUM (AA3: AJ3)). Now the cell should display the number 45.00. To remove the extra zeros, select the AL3 cell and click on the delete decimal point button, as you have done before (the third button in the number formatting tools).
8. Select the AM3 cell and enter the formula = REPT ("|", AL3). The REPT function repeats the text in the first argument a specified number of times in the second argument. The text in this case is the vertical bar symbol (to enter it, you must press the Shift key and, holding it, press the backslash key (\), which is above the Return / Enter key on most keyboards), and it will be repeated 45 times, because cell AL3 contains a value of 45. A small column appears in cell AM3, extending to the right. Double-click on the right border in the AM column header to expand it to the required width.
9. Select cells AL3: AM3 and copy them. Paste the clipboard into cells AL3: AM7 and AL11: AM15. Now you will have a text histogram in front of your eyes, showing the total damage of all types of weapons, original and after balancing. Finally, adjust the width of the AM column again to see all the vertical bar symbols.
Weapon balancing
Now we have two data sets and two charts, and we can try to balance the weapon. How to increase the power of the machine gun? What should be increased - the number of shots, the probability of hitting the target or the stopping power of a single shot? When balancing should take into account some additional rules of the game.
- In this example of the game, the characters have only 6 units of health, so they lose consciousness when they are dealt damage equal to 6 units.
- In Valkyria Chronicles, if the enemy was not killed by the attacking soldier, he automatically goes to the counterattack. Therefore, damage of 6 units is preferable to damage of 5 units, as this also protects the attacker from a counterattack.
- A weapon with a large number of shots (for example, a machine gun) gives a higher probability of inflicting average damage per turn, while a weapon with a single shot (for example, a shotgun and a sniper rifle) seems less reliable. In fig. 11.7 shows how the probability distribution is increasingly shifting to the average with an increase in the number of dice thrown in order to determine the probability of hitting a target with several shots.
- Even with all the information available, this diagram does not reflect some aspects of the weapon’s balance, including the observation of a higher likelihood of the average damage done above for weapons with multiple shots, as well as the advantage of a sniper rifle for hitting enemies too far for effective counterattack.
Try to balance these weapon parameters yourself by changing only the values in cells B11: N15. Do not touch the original parameters and do not change anything in the Percent Chance and Average Damage sections; both of them, as well as the Rebalanced diagram (After balancing), will be updated automatically and reflect the changes you made in the cells Shots, D / Shot (Damage / Shot) and ToHit (For hitting). After playing with the numbers, continue reading.
One example of balanced values
In fig. 11.17 you can see the parameters of the weapon, which I picked up for the designed prototype. Of course, this is not the only way to balance weapons, and not even the best one, but it allows you to achieve many design goals.
- Each weapon has its own distinctive characteristics, and none of them is redundant or not powerful enough.
- Even though the shotgun (Shotgun) may seem very similar to the Machine gun in this diagram, these two types of weapons are significantly different in two factors: 1) getting hit with a 6-point damage from the shotgun immediately disables the enemy; and 2) the machine gun fires a lot of bullets, so it will inflict the average damage much more often.
- The gun has decent performance for close range and is more versatile than a shotgun or machine gun due to its ability to hit enemies at longer distances.

- The rifle (Rifle) truly shines at medium ranges.
- Sniper rifle (Sniper rifle) is no good at close range, but is the best weapon at long range. A sniper rifle hit inflicts 6 points of damage like a shotgun, meaning it can also destroy an enemy with a single shot.
Despite the fact that such balancing with the use of a spreadsheet does not cover all possible effects of weapon design, it still remains an important tool in the designer’s arsenal, because it helps to quickly analyze large amounts of data. Some free game designers spend most of their time adjusting data in spreadsheets, trying to make their games a bit more balanced, so if you are going to work in the field of game design, possession of spreadsheets and design based on data (which we just did) you very useful.
Positive and negative feedback
One of the last key elements of supporting the balance of the game, which we will discuss, is the notion of positive and negative feedback. In a game with positive feedback, a player who has taken the lead from the very beginning receives an additional advantage and is likely to win. In a game with negative feedback, losing players have an advantage.
Poker is a great example of a game with positive feedback. If a player wins a big pot and has more money than other players, individual bets mean less to him and he has more freedom to take such steps as bluffing (because he can afford to lose something). On the contrary, the player who lost money at the beginning of the game has less freedom of action and there is no opportunity to take risks. There is a strong positive feedback in the game Monopoly, where the player with the best objects constantly receives more money and is able to force other players to sell their objects if they are unable to pay the rent when they get to their sites. For most games, positive feedback is an undesirable phenomenon, but it is well suited for cases where it is required that the game be completed quickly (although in Monopoly this advantage is not used because the designer of this game wanted to show the misfortunes of the poor in capitalist society). In single player games, there are also often positive feedback mechanisms, the purpose of which is to make the player feel all-powerful in the game.
Mario Kart is a great example of a game with negative feedback in the form of random items awarded to a player when he hits boxes. Usually a player gets a banana (in fact, a weapon of defense), a bunch of three bananas or a green shell (one of the weakest weapons). The player in the last position often receives more powerful items, such as lightning, which slows down all other players participating in the race. Negative feedback makes the games more fair to players who have not managed to make it to the leaders, and longer ones, and also gives all players the opportunity to feel that they still have a chance to win, even if they are far behind.
Results
In this chapter there was a lot of mathematics, but, I hope, you made sure that knowledge of it will be very useful to you as a game designer. Most of the topics covered in this chapter deserve a separate book, so I encourage you to continue studying them if you are interested.
»More information about the book can be found on the publisher's website.
» Table of Contents
» Excerpt
For Habrozhiteley a 20% discount on the coupon - Unity
Upon payment of the paper version of the book, an electronic version of the book is sent to the e-mail.
Source: https://habr.com/ru/post/447382/
All Articles