SNA Hackathon 2019
In February-March 2019, a competition was held to rank the tape of the social network SNA Hackathon 2019 , in which our team won first place. In the article I will tell you about the organization of the competition, the methods we tried, and the catboost settings for training on big data.
Sna hackathon
Hackathon under this name is held for the third time. It is organized by the ok.ru social network, respectively, the task and the data are directly related to this social network.
SNA (social network analysis) in this case is more correctly understood not as an analysis of a social graph, but rather as an analysis of a social network.
- In 2014, the task was to predict the number of likes that the post will collect.
- In 2016, the VVZ task (perhaps you are familiar), more close to the analysis of the social graph.
- In 2019 - ranking of the user's tape by the likelihood that the user will like the post.
I can’t say about 2014, but in 2016 and 2019, besides my ability to analyze data, I also needed skills in working with big data. I think that it was precisely the combination of machine learning and big data processing tasks that attracted me to these contests, and the experience in these areas helped me to win.
mlbootcamp
In 2019, the competition was organized on the platform https://mlbootcamp.ru .
The competition began online on February 7 and consisted of 3 tasks. Anyone could register on the site, download the baseline and load their car for several hours. At the end of the online stage on March 15, the top 15 of each showdown was invited to the Mail.ru office for an offline stage, which ran from March 30 to April 1.
Task
In the source data, user identifiers (userId) and post identifiers (objectId) are provided. If the user was shown a post, then there is a line in the data containing the userId, objectId, the user's reaction to this post (feedback) and a set of various signs or links to pictures and texts.
| userId | objectId | ownerId | feedback | images |
|---|---|---|---|---|
| 3555 | 22 | 5677 | [liked, clicked] | [hash1] |
| 12842 | 55 | 32144 | [disliked] | [hash2, hash3] |
| 13145 | 35 | 5677 | [clicked, reshared] | [hash2] |
The test dataset contains a similar structure, but there is no feedback field. The goal is to predict the presence of an 'liked' reaction in the feedback field.
The submission file has the following structure:
| userId | SortedList [objectId] |
|---|---|
| 123 | 78,13,54,22 |
| 128 | 35,61,55 |
| 131 | 35,68,129,11 |
Metric - average ROC AUC by users.
A more detailed description of the data can be found on the website of the commission . Also there you can download data, including tests and pictures.
Online stage
At the online stage the task was divided into 3 parts.
- Collaborative system - includes all signs, except images and texts;
- Images - includes only information about images;
- Texts - includes information about texts only.
Offline stage
At the offline stage, the data included all signs, while the texts and images were sparse. There are a lot of lines in dataset, which were already many, 1.5 times more.
The solution of the problem
Since I work on cv at work, I began my journey in this competition with the task of "Images". The data that was provided is the userId, objectId, ownerId (the group in which the post was published), the timestamps of creating and displaying the post and, of course, the image for this post.
After generating a few timestamp-based features, the next idea was to take the penultimate layer of the imagenet-trained neurons and send these embeddings to boosting.
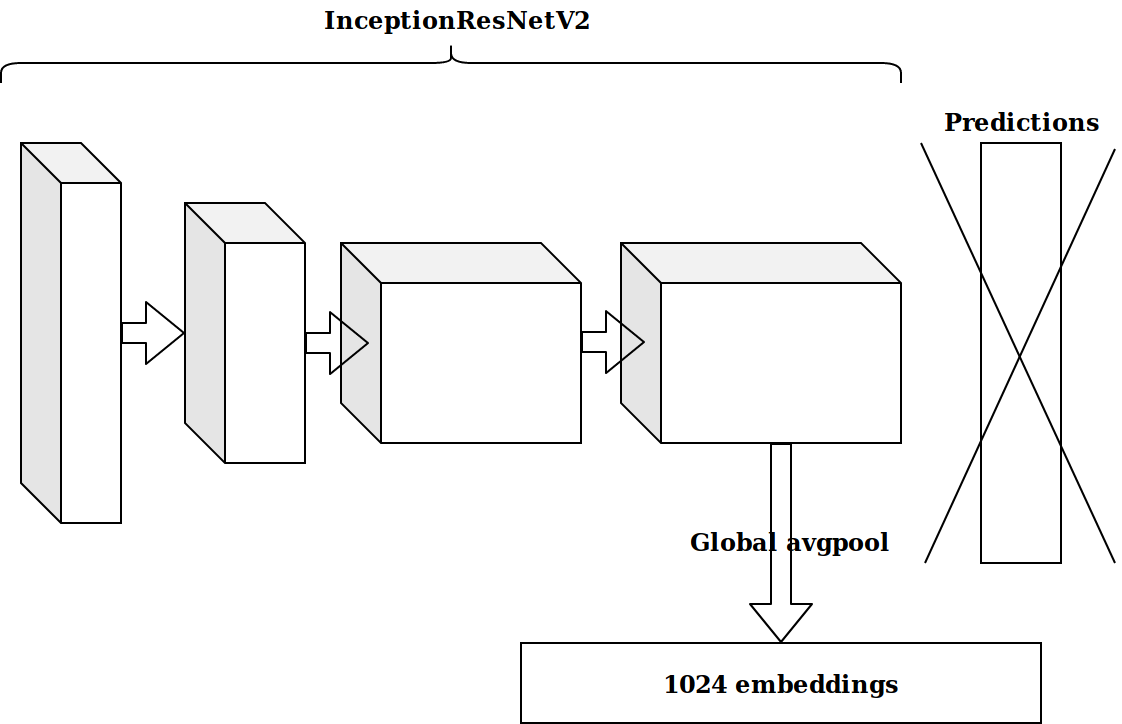
The results were not impressive. Embeddings from imagenet neurons are irrelevant, I thought, you need to wash down your autoencoder.
It took a lot of time and the result did not improve.
Feature generation
Working with images takes a lot of time, and I decided to do something more simple.
As you can see at once, there are several categorical signs in dataset, and in order not to bother much, I just took catboost. The solution was excellent, without any settings, I immediately got to the first line of the leaderboard.
There is a lot of data and they are laid out in parquet format, so I, without thinking twice, took scala and started writing everything in spark.
The simplest features that gave more growth than image embeddings:
- how many times objectId, userId and ownerId met in the data (must correlate with popularity);
- how many posts userId saw from ownerId (should correlate with user interest in the group);
- how many unique userId watched posts at ownerId (reflects the size of the group's audience).
From the timestamps it was possible to get the time of day at which the user watched the tape (morning / afternoon / evening / night). By combining these categories, you can continue to generate features:
- how many times userId came in the evening;
- what time more often this post is shown (objectId) and so on.
All this gradually improved the metric. But the size of the training dataset is about 20M records, so adding features greatly slowed down the training.
I revised the approach to using data. Although the data are time-dependent, I did not see any clear information leaks “in the future”, nevertheless I broke it just in case:
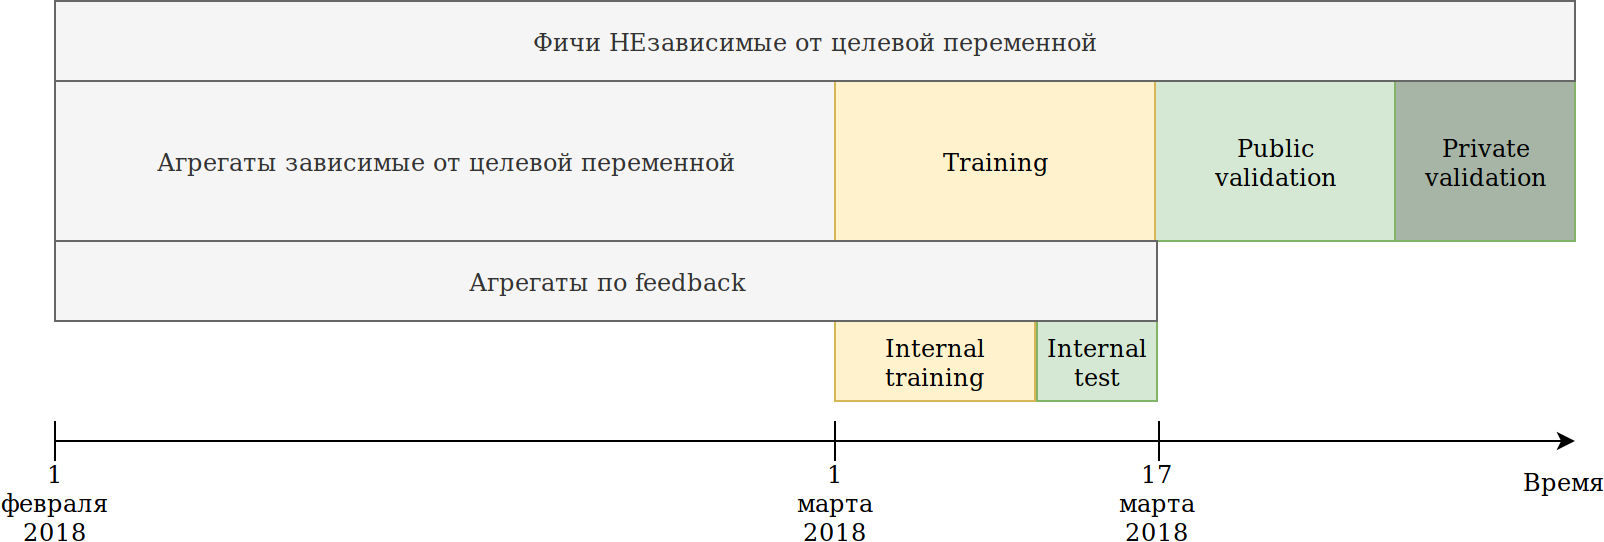
The training set provided to us (February and 2 weeks of March) was divided into 2 parts.
On the data of the last N days I trained the model. The aggregations that I described above built on all the data, including the test. At the same time, data appeared on which to build various encodings of the target variable. The simplest approach is to reuse the code that is already creating new features, and simply provide it with data that will not be trained and target = 1.
Thus, similar features turned out:
- How many times has userId seen a post in the ownerId group;
- How many times userId liked a post to the ownerId group;
- Percentage of posts that userId liked by ownerId.
That is, the mean target encoding is obtained on the part of dataset for various combinations of categorical features. In principle, catboost also builds target encoding, and from this point of view there is no benefit, but, for example, it became possible to count the number of unique users who liked posts in this group. At the same time, the main goal has been achieved - my dataset has decreased several times, and it was possible to continue generating features.
While catboost can only encode by the liked reaction, there are other reactions in feedback: reshared, disliked, unliked, clicked, ignored, which can be hand-made encoders. I recalculated all sorts of units and sifted out features with low importance so as not to inflate datasets.
By the time I was in the first place by a wide margin. The only embarrassment was that image embeddings almost did not increase. The idea came to give everything at the mercy of catboost. Cluster Kmeans images and get a new categorical feature imageCat.
Here are some classes after manual filtering and merging of clusters obtained from KMeans.

Based on imageCat we generate:
- New categorical features:
- Which imageCat was most often viewed by userId;
- Which imageCat is most often shown by ownerId;
- What imageCat most often liked by userId;
- Various counters:
- How many unique imageCat userId watched;
- About 15 similar features plus target encoding as described above.
Texts
The results in the competition of images suited me and I decided to try myself in the texts. Previously, I did not work a lot with the texts and, foolishly, killed the day on tf-idf and svd. Then I saw the baseline with doc2vec, which does exactly what I need. By adjusting the parameters of doc2vec a little, I received text embeddings.
And then I simply reused the code for the images, in which I replaced the embeddings of images with text embeddings. As a result, got on 2nd place in the contest of texts.
Collaborative system
There was only one contest left in which I hadn’t “poked it with a stick”, and judging by the AUC on the leaderboard, the results of this particular contest should have the most impact on the offline stage.
I took all the signs that were in the original data, chose categorical and calculated the same aggregates as for the images, except the features of the images themselves. Just sticking it into catboost, I got 2nd place.
The first steps to optimize catboost
One first and two second places pleased me, but there was an understanding that I did not do anything special, which means we can expect a loss of positions.
The task of the competition is the ranking of posts within the user, and all this time I was solving the classification problem, that is, I optimized the wrong metric.
I will give a simple example:
| userId | objectId | prediction | ground truth |
|---|---|---|---|
| one | ten | 0.9 | one |
| one | eleven | 0.8 | one |
| one | 12 | 0.7 | one |
| one | 13 | 0.6 | one |
| one | 14 | 0.5 | 0 |
| 2 | 15 | 0.4 | 0 |
| 2 | sixteen | 0.3 | one |
We make a small permutation
| userId | objectId | prediction | ground truth |
|---|---|---|---|
| one | ten | 0.9 | one |
| one | eleven | 0.8 | one |
| one | 12 | 0.7 | one |
| one | 13 | 0.6 | 0 |
| 2 | sixteen | 0.5 | one |
| 2 | 15 | 0.4 | 0 |
| one | 14 | 0.3 | one |
We get the following results:
| Model | AUC | User1 AUC | User2 AUC | mean AUC |
|---|---|---|---|---|
| Option 1 | 0.8 | 1.0 | 0.0 | 0.5 |
| Option 2 | 0.7 | 0.75 | 1.0 | 0.875 |
As can be seen, an improvement in the total AUC metric does not mean an improvement in the average AUC metric within the user.
Catboost can optimize ranking metrics out of the box. I read about the ranking metrics, success stories when using catboost and set YetiRankPairwise to study at night. The result was not impressive. Deciding that I had not been trained, I changed the error function to QueryRMSE, which, judging by the catboost documentation, converges faster. As a result, I received the same results as in the training for classification, but the ensembles of these two models gave a good increase, which brought me to the first places in all three competitions.
5 minutes before the closing of the online stage in the competition "Collaborative Systems" Sergei Shalnov pushed me to second place. Further path we passed together.
Preparing for the offline stage
The victory in the online stage was guaranteed by the RTX 2080 TI video card, but the main prize of 300,000 rubles and, most likely, the final first place made us work these 2 weeks.
As it turned out, Sergey also used catboost. We exchanged ideas and features, and I found out about the report of Anna Veronika Dorozh in which there were answers to many of my questions, and even to those that I had not yet had by that time.
Viewing the report led me to the idea that it is necessary to return all the parameters to the default value, and to tune the settings very carefully and only after fixing the set of features. Now one training took about 15 hours, but one model managed to get faster sooner than it did in the ensemble with ranking.
Feature generation
In the competition "Collaborative Systems" a large number of features are evaluated as important for the model. For example, auditweights_spark_svd is the most important feature, and there is no information about what it means. I thought that it was worth counting the various units, based on important signs. For example, the average auditweights_spark_svd by user, by group, by object. The same can be calculated from the data on which training is not performed and target = 1, that is, the average auditweights_spark_svd for the user for the objects that he liked. There were several important signs besides auditweights_spark_svd . Here are some of them:
- auditweightsCtrGender
- auditweightsCtrHigh
- userOwnerCounterCreateLikes
For example, the average auditweightsCtrGender by userId turned out to be an important feature, as well as the average userOwnerCounterCreateLikes by userId + ownerId. This should have made you think about the need to understand the meaning of the fields.
Also important features were auditweightsLikesCount and auditweightsShowsCount . Having divided one into another, it turned out to be an even more important feature.
Data leakage
Competition and production models are very different tasks. When preparing the data it is very difficult to take into account all the details and not to pass some kind of non-trivial information about the target variable on the test. If we create a production solution, then we will try to avoid using data leaks when training the model. But if we want to win the competition, then data leaks are the best features.
After examining the data, you can see that for objectId, the values of auditweightsLikesCount and auditweightsShowsCount change, which means that the ratio of the maximum values of these attributes reflects the conversion of the post much better than the ratio at the time of display.
The first leak we found was auditweightsLikesCountMax / auditweightsShowsCountMax .
And what if you look at the data more closely? Sort by date of display and get:
| objectId | userId | auditweightsShowsCount | auditweightsLikesCount | target (is liked) |
|---|---|---|---|---|
| one | one | 12 | 3 | probably not |
| one | 2 | 15 | 3 | maybe yes |
| one | 3 | sixteen | four |
It was amazing when I found the first such example and it turned out that my prediction did not come true. But, taking into account the fact that the maximum values of these attributes within the object gave an increase, we were not lazy and decided to find auditweightsShowsCountNext and auditweightsLikesCountNext , that is, the values at the next moment in time. Adding feature
(auditweightsShowsCountNext-auditweightsShowsCount) / (auditweightsLikesCount-auditweightsLikesCountNext) we made a sharp jump over early.
Similar leaks could be used if the following values were found for userOwnerCounterCreateLikes within userId + ownerId and, for example, auditweightsCtrGender within objectId + userGender. We found 6 similar fields with leaks and pulled the most information out of them.
By that time, we squeezed the maximum information from the collaborative traits, but did not return to contests of images and texts. There was a great idea to check: how many features are given directly by the images or texts in the respective contests?
There were no leaks in contests in images and texts, but by that time I had returned the default catboost parameters, brushed my code and added a few features. Total happened:
| Decision | is fast |
|---|---|
| Maximum with images | 0.6411 |
| Maximum without images | 0.6297 |
| Second place result | 0.6295 |
| Decision | is fast |
|---|---|
| Maximum with lyrics | 0.666 |
| Maximum without texts | 0.660 |
| Second place result | 0.656 |
| Decision | is fast |
|---|---|
| Maximum in collaborative | 0.745 |
| Second place result | 0.723 |
It became obvious that it would hardly be possible to squeeze a lot out of texts and images, and we, having tried a couple of the most interesting ideas, stopped working with them.
Further generation of features in collaborative systems did not give an increase, and we started ranking. At the online stage, the ensemble of classification and ranking gave me a small increase, as it turned out, because I did not train the classification. None of the error functions, including YetiRanlPairwise, even came close to the result that LogLoss gave (0.745 versus 0.725). There was hope for QueryCrossEntropy, which could not be launched.
Offline stage
At the offline stage, the data structure remained the same, but there were minor changes:
- userId, objectId, ownerId identifiers have been re-randomized;
- several signs were removed and several renamed;
- data was about 1.5 times more.
In addition to the listed difficulties, there was one big plus: a large server with RTX 2080TI was allocated to the team. I enjoyed htop for a long time.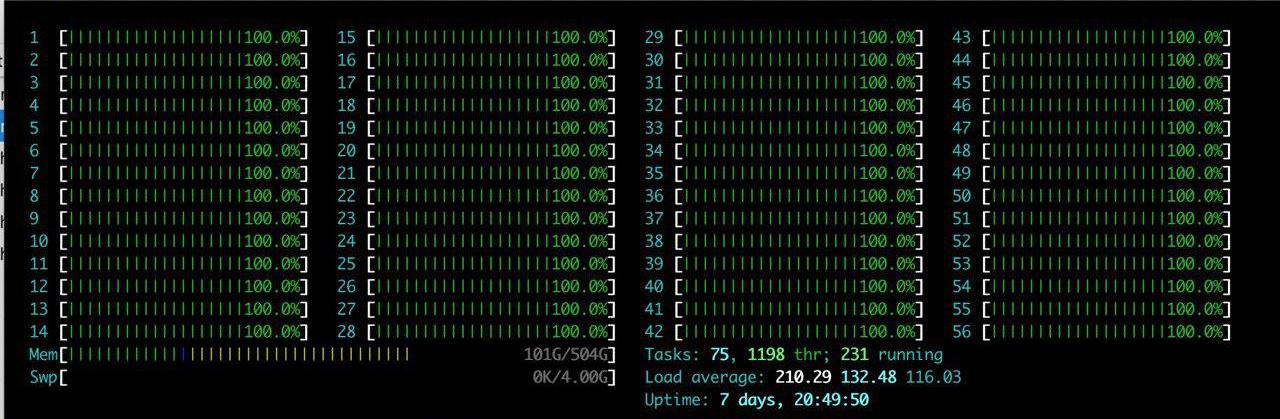
The idea was one - just to reproduce what is already there. After spending a couple of hours setting up the environment on the server, we gradually began to check that the results are reproduced. The main problem we are facing is an increase in data volume. We decided to slightly reduce the load and set the parameter catboost ctr_complexity = 1. This lowers the speed a bit, but my model began to work, the result was good - 0.733. Sergey, unlike me, did not break the data into 2 parts and studied all the data, although it gave the best result at the online stage, at the offline stage there were a lot of difficulties. If we take all the features that we wrote and try to shove in catboost, then it would not have worked on the online stage. Sergey did type optimization, for example, converting float64 to float32 types. In this article you can find information on memory optimization in pandas. As a result, Sergey studied on the CPU on all data and it turned out about 0.735.
These results were enough to win, but we hid our real soon and could not be sure that other teams are not doing the same.
Battle to the last
Tuning catboost
Our solution was completely reproduced, we added features of text data and images, so it only remained to tune the catboost parameters. Sergey learned on a CPU with a small number of iterations, and I learned on ctr_complexity = 1. There was only one day left, and if you just add iterations or increase ctr_complexity, you could get a better day by morning, and go for a walk all day.
At an offline stage, quick it was possible to hide very easily, just choosing not the best solution on the site. We expected dramatic changes in the leaderboard in the last minutes before the closure of the submits and decided not to stop.
From Anna's video, I learned that to improve the quality of the model, it is best to select the following parameters:
- learning_rate - The default value is calculated based on the size of the dataset. When learning_rate decreases, in order to preserve quality, it is necessary to increase the number of iterations.
- l2_leaf_reg - Regularization coefficient, default value 3, it is desirable to choose from 2 to 30. A decrease in the value leads to an increase in the overfit.
- bagging_temperature - adds randomization to the weights of the objects in the sample. The default value is 1, at which the weights are selected from the exponential distribution. Decreasing the value leads to an increase in overfit.
- random_strength - Affects the choice of splits at a specific iteration. The higher the random_strength, the higher the chance for a split with low importance to be selected. At each subsequent iteration, randomness decreases. Decreasing the value leads to an increase in overfit.
Other parameters have a much smaller effect on the final result, so I did not try to select them. One iteration of training on my dataset on a GPU with ctr_complexity = 1 took 20 minutes, and the selected parameters on a smaller dataset were slightly different from the optimal ones on a full dataset. As a result, I did about 30 iterations on 10% of the data, and then about 10 more iterations on all the data. It turned out about the following:
- I increased learning_rate by 40% from default;
- l2_leaf_reg left unchanged ;
- bagging_temperature and random_strength reduced to 0.8.
It can be concluded that the model is under-trained with default parameters.
I was very surprised when I saw the result on the leaderboard:
| Model | model 1 | model 2 | model 3 | ensemble |
|---|---|---|---|---|
| Without tuning | 0.7403 | 0.7404 | 0.7404 | 0.7407 |
| With tuning | 0.7406 | 0.7405 | 0.7406 | 0.7408 |
I made a conclusion for myself that if you do not need a quick application of the model, then it is better to replace the selection of parameters with an ensemble of several models with non-optimized parameters.
Sergey was engaged in the optimization of the size of the dataset to run it on the GPU. The easiest option is to cut off part of the data, but this can be done in several ways:
- gradually remove the oldest data (beginning of February) until it starts to fit into memory;
- remove features with the lowest importance;
- remove userId for which there is only one entry;
- leave only userId, which is in the test.
And in the end - to make an ensemble of all the options.
Last ensemble
By the late evening of the last day we laid out the ensemble of our models, which gave 0.742. At night, I launched my model with ctr_complexity = 2 and instead of 30 minutes, she studied for 5 hours. Only at 4 in the morning she was counted, and I did the last ensemble, which gave 0.7433 on a public leaderboard.
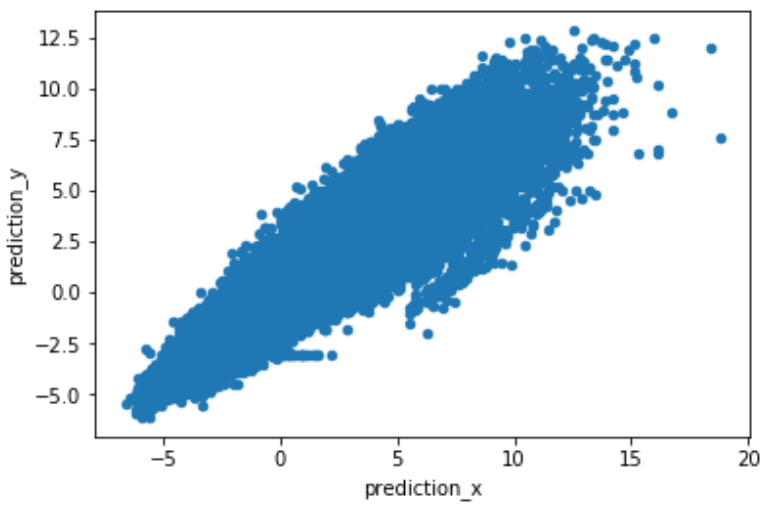
Due to the different approaches to solving the problem, our predictions did not correlate strongly, which gave a good increase in the ensemble. To get a good ensemble, it is better to use the raw predictions of the predict model (prediction_type = 'RawFormulaVal') and set scale_pos_weight = neg_count / pos_count.
On the site you can see the final results on a private leaderboard .
Other solutions
Many teams followed the canons of recommender algorithms. I, being not an expert in this field, cannot assess them, but I remember 2 interesting solutions.
- The decision of Nikolai Anokhin . Nikolay, being an employee of Mail.ru, did not claim for prizes, therefore he set himself the goal of not getting the maximum possible rate, but getting an easily scalable solution.
- The decision of the team that won the jury prize, based on this article from facebook , made it possible to cluster images very well without manual work.
Conclusion
What is most deposited in the memory:
- If there are categorical features in the data, and you know how to do target encoding correctly, it's still best to try catboost.
- If you participate in the competition, you should not spend time on the selection of parameters, except for learning_rate and iterations. A quicker solution is to make an ensemble of several models.
- Boosting know how to study on the GPU. Catboost can learn very quickly on the GPU, but eats a lot of memory.
- During development and validation of ideas, it is better to set a small rsm ~ = 0.2 (CPU only) and ctr_complexity = 1.
- Unlike other teams, the ensemble of our models gave a big boost. We only exchanged ideas and wrote in different languages. We had a different approach to data partitioning and, I think, everyone had their own bugs.
- It is not clear why ranking optimization yielded a result worse than classification optimization.
- I got a little experience with texts and understanding how recommender systems are made.

Thanks to the organizers for the received emotions, knowledge and prizes.
')
Source: https://habr.com/ru/post/447376/
All Articles