The study of the connectivity of world currencies through the correlation of absolute rates
Introduction
about the project
The project “Absolute exchange rate” is engaged in the analysis of paired exchange rates, the selection of absolute exchange rates from them and their analysis. Within the framework of the project, a method of converting from pair rates to absolute exchange rates was obtained. Absolute currency ABS is defined for this. Rates of all available currencies are expressed in relation to ABS.
A detailed description of the technology is given in the article “From currency pairs to absolute exchange rates” .
About the problem
This article deals with the problem of qualitative analysis of currency exchange rates.
The need to study the relationship between currencies due to the requirements for the selection of financial instruments in the investment portfolio and the ability to predict the behavior of currencies based on data on other currencies related to them.
')
It is desirable to include instruments with highly multidirectional relatedness in the investment portfolio. This reduces the overall risk of the portfolio.
And, if you find tools with a high degree of connectedness, then on the basis of the behavior of some, you can predict the behavior of others.
About the experiment
Method selection
As the initial data for the experiment, there are data series with absolute exchange rates (see the source file. “Absolute rates” sheet ).

To study the connectedness of series of numerical data, it is best to use the Pearson correlation (see Correlation — Wikipedia ).
The correlation coefficient has a range from “-1” to “+1”. Large negative values indicate a strong multidirectional relationship. Large positive values indicate strong unidirectional connectivity. The proximity of the coefficient to “0” indicates a lack of communication.

What do we want to get?
The purpose of the experiment is to obtain groups of currencies with a high degree of connectedness. Moreover, the sign of communication is also of interest.
Location
All calculations will be carried out in the Wolfram Mathematica system (see Wolfram Mathematica - Wikipedia ). And we use the free cloud resources Wolfram.Cloud .
This resource allows you to create online notebooks with calculations and allows you to provide access for general viewing. Notebook of this experiment is located by reference .

Plan
Calculations will be carried out according to the following plan.
First, we calculate the correlation matrix. The columns and rows of the matrix will correspond to individual currencies. At the intersection of the column and row will be the coefficient of pair correlation.
Next, select the currency pairs with the strongest bonds. The selected pairs will be placed on the graph (see Graph (Mathematics) - Wikipedia ).
The nodes of the graph will be currency. The edges of the graph will indicate the relationship between currencies. The color of the edge will indicate the link mark. Green is a positive link, and red is a negative link.
We will perform the indicated sequence of calculations both for absolute rates and for their changes. Analyzing the links between absolute courses allows you to explore slow processes (more than one day). An analysis of the relationship of changes in absolute rates will allow you to explore fast connections between currencies (one day).
results
Sampling depth
The source file contains data for the last 150 days. According to them, the calculation will be made.
Currency cloud
The experiment involved 45 currencies.

A complete list of currencies can be seen on the “Currency Summary” sheet of the source file .
Absolute Course Correlation
Above (see Plan), the calculation of the correlation matrix for absolute rates was planned. The result is shown in the picture below.

Here red corresponds to a positive connection, and blue to a negative one. To understand the scale of the gradation is given. Tickers of currencies (short names) are listed below and to the left.
Absolute Course Dependency Graph
The correlation matrix allowed us to distinguish two groups of currencies with a high degree of connectedness. For this, we identified pairs with a correlation higher than 0.9 and transferred them to the graph.

In the first group gathered currencies with a high degree of dependence on the US dollar. Here are the currencies of the four Arab countries trading in oil, the Hong Kong dollar and the US dollar itself. All dependencies are positive (unidirectional).
In the second group gathered European currencies. In the center is the Euro itself and around it are the currencies of Poland, Romania and Denmark. All dependencies are positive (unidirectional).
Relative change in absolute rates
For further research, the series of relative changes in absolute rates were calculated. The formula for the calculations is as follows.

The difference between consecutive values will be correlated to the earliest of the two. Thus we will receive a relative change in the absolute course.
Correlation of relative changes in absolute rates
As with absolute rates, we obtain a correlation matrix for relative measurements of absolute rates. Here is a graphical display of the matrix.
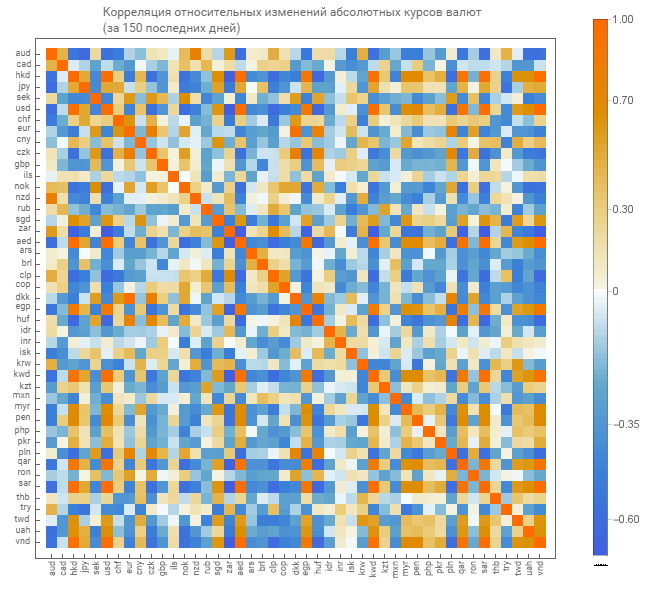
Here is a matrix of brighter tones. Which indicates a lesser degree of connectedness.
Dependence graph of relative changes in absolute rates
From the correlation matrix of relative changes we select currency pairs with a high degree of connectedness. Only the selection level here is already 0.6 (here and above, this coefficient was chosen from the consideration of a small number of pairs for output per graph).

In the case of relative changes, 3 groups of currencies were received. In the upper group the currencies of Australia and New Zealand are united. In the lower group gathered European currencies. In the middle group around the Hong Kong dollar, the currencies of the United States, Vietnam, five Arab countries - exporters of oil, South Africa and Peru united.
And there is an interesting feature in the high negative dependence on the South African rand.
findings
As a result of the experiment, it was possible to obtain the following.
Putting the correlation matrix data onto a mathematical graph is a good visualization practice for the correlation matrix. Further application of this method will simplify the understanding of relationships in the group of numerical series.
Found a formal method of clustering currency markets. It was possible to formally distinguish the markets of Europe, America with Asia and Oceania. This method can significantly shorten the path for disclosing mutual influences between the markets of different countries and become a good tool for a financial analyst.
The inclusion of the South African rand in the investment portfolio in conjunction with the US dollar will reduce the risks of such a portfolio.
catalogue of articles
Source: https://habr.com/ru/post/447348/
All Articles