Monitor Kubernetes cluster resources
I created Kube Eagle, an exporter of Prometheus. It turned out to be a cool thing that helps to better understand the resources of small and medium clusters. In the end, I saved more than one hundred dollars because I selected the right types of machines and set up application resource limits for workloads.
I will talk about the benefits of Kube Eagle , but first I will explain what caused the fuss and what was needed for quality monitoring.
I managed several clusters of 4–50 nodes. In each cluster - up to 200 microservices and applications. To make better use of the available hardware, most of the deployments were configured with burstable memory and CPU resources. So pods can take available resources, if necessary, and at the same time do not interfere with other applications on this node. Well, isn't it great?
And although the cluster consumed relatively little CPU (8%) and RAM (40%), we constantly had problems with crowding out when they tried to allocate more memory than is available on the node. Then we had only one panel for monitoring Kubernetes resources. Here it is:
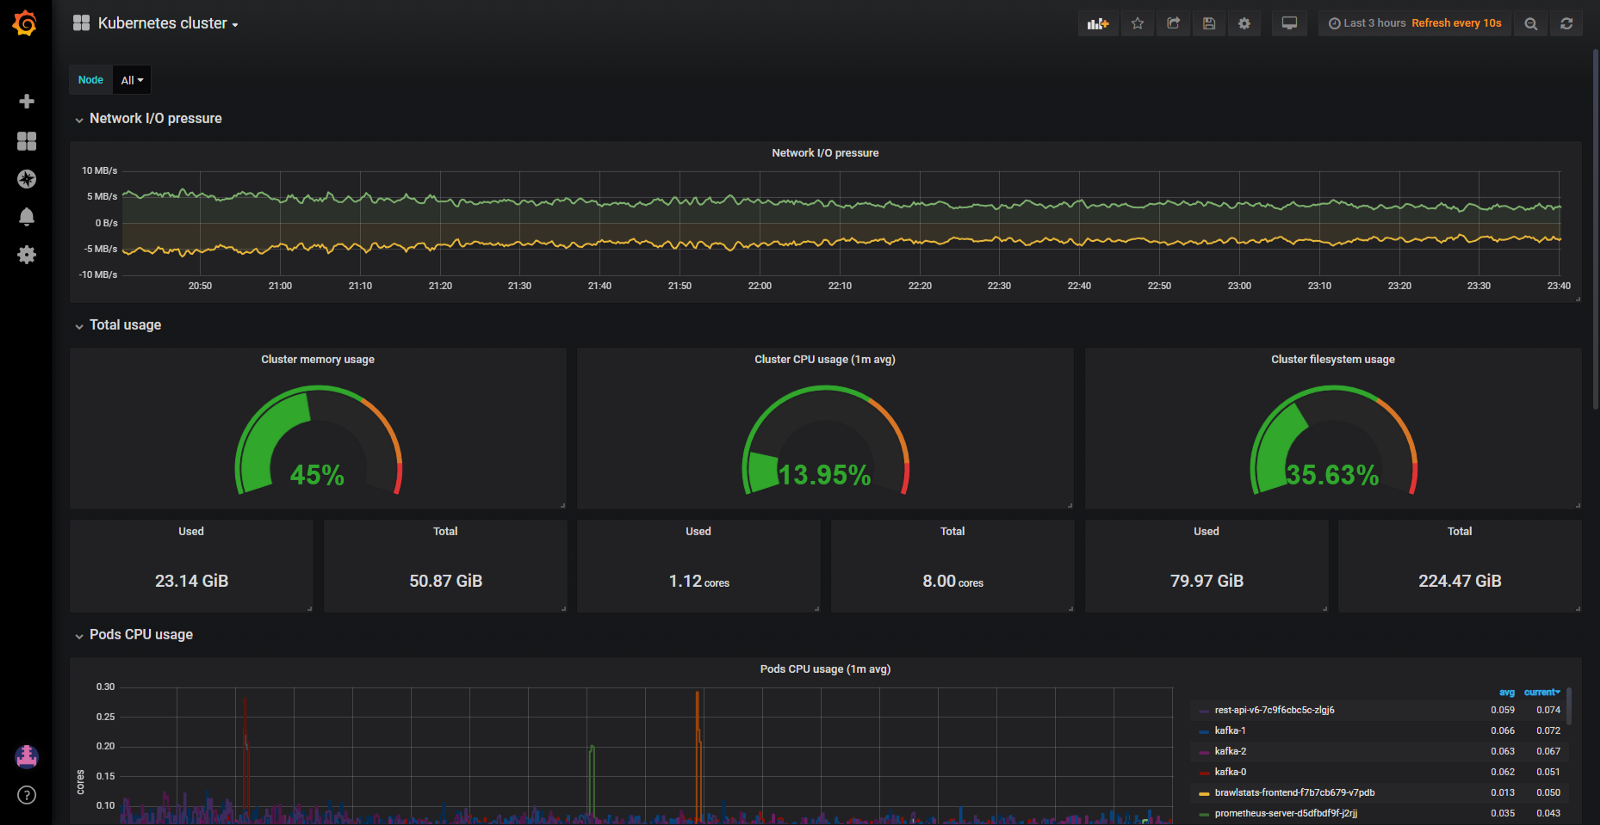
Grafana panel with cAdvisor metrics only
With such a panel, nodes that eat a lot of memory and CPU are not a problem to see. The problem is to figure out the reason. To keep the pods in place, you could, of course, set up guaranteed resources on all pods (the requested resources are equal to the limit). But this is not the smartest use of iron. There were several hundred gigabytes of memory on the cluster, while some nodes were starving, while others had 4-10 GB left.
It turns out that the Kubernetes scheduler distributed workloads across available resources unevenly. The Kubernetes scheduler takes into account different configurations: affinity, taints and tolerations rules, node selectors, which can limit the available nodes. But in my case, there was nothing of the kind, and the plans were planned depending on the requested resources at each node.
To serve, a node was selected that has the most free resources and that satisfies the conditions of the request. It turned out that the requested resources on the nodes do not coincide with the actual use, and here Kube Eagle and its ability to monitor resources came to the rescue.
I have almost all Kubernetes clusters tracked only with Node exporter and Kube State Metrics . Node Exporter provides statistics on I / O and disk usage, CPU and RAM, and Kube State Metrics shows Kubernetes object metrics, such as queries and limits on CPU resources and memory.
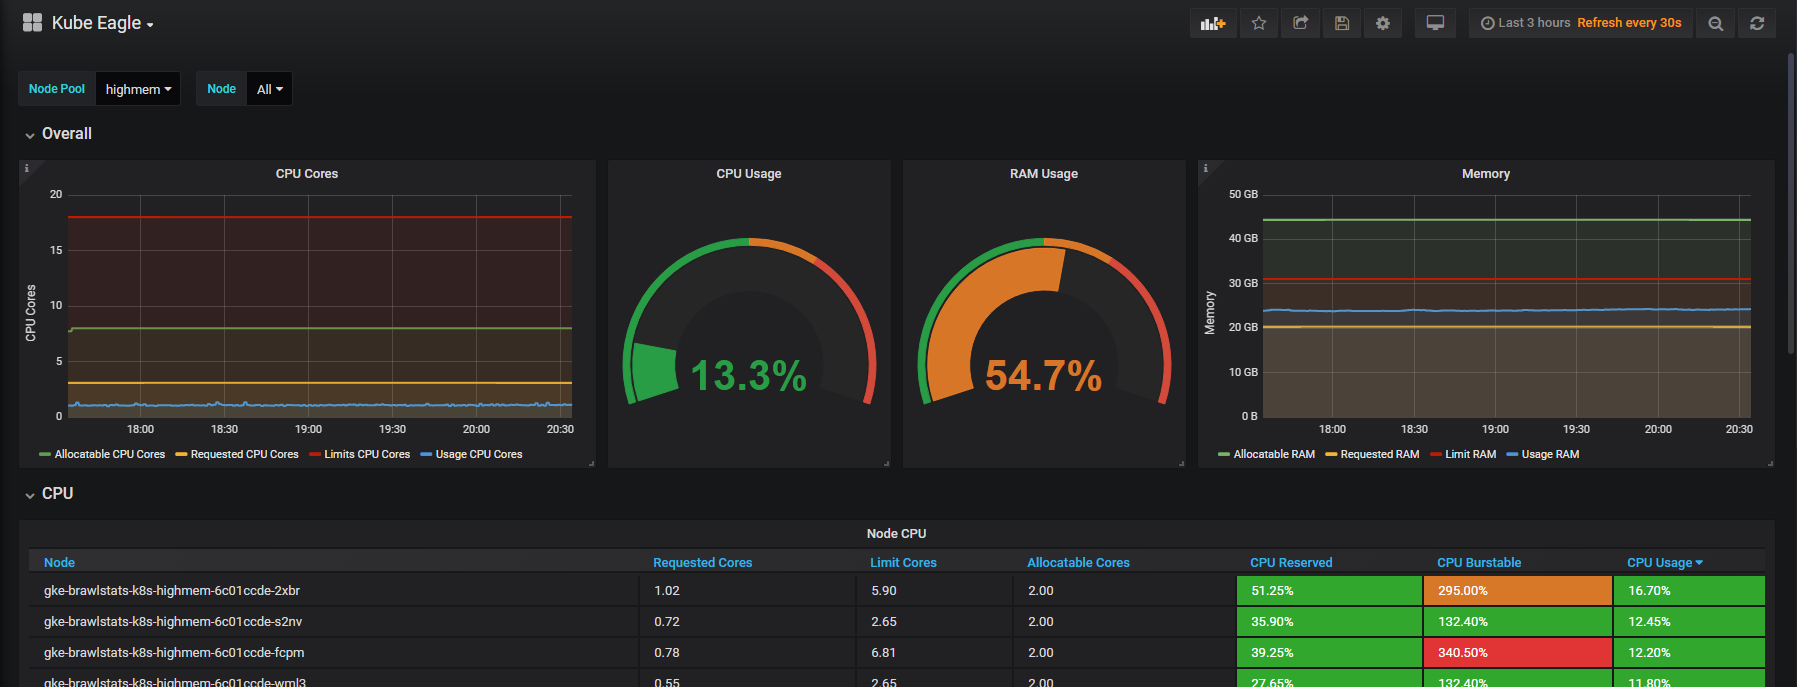
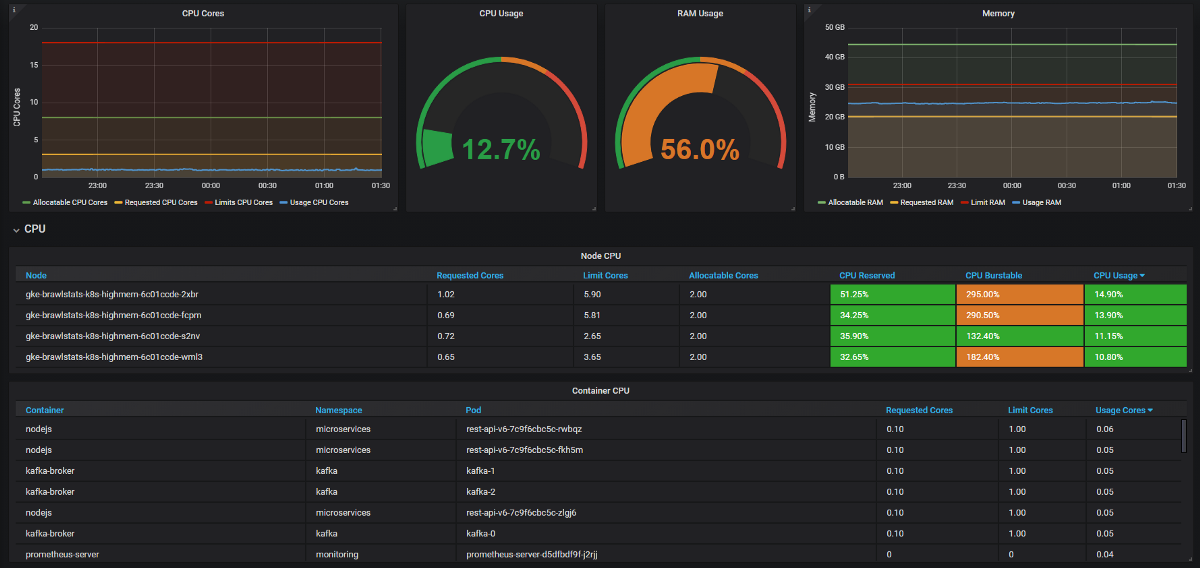
We need to combine usage metrics with query and limit metrics in Grafana, and then we get all the information about the problem. It sounds simple, but in fact in these two tools labels are called differently, and some metrics do not have metadata labels. Kube Eagle does everything himself and the panel looks like this:
We managed to solve many problems with resources and save equipment:
- Some developers did not know how many resources microservices needed (or simply did not bother). We had nothing to find the wrong requests for resources - for this you need to know consumption plus requests and limits. Now they see Prometheus metrics, monitor actual usage and adjust requests and limits.
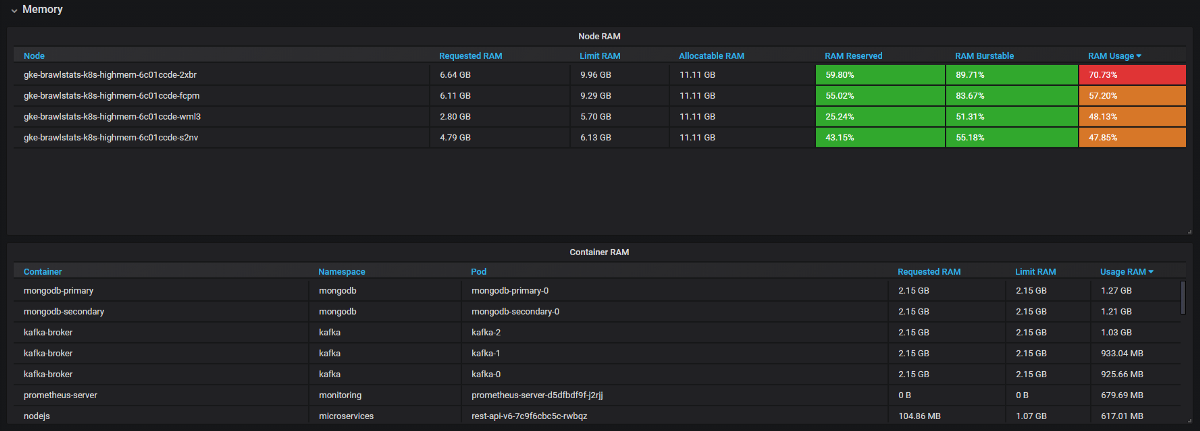
- JVM applications take as much RAM as they take. The garbage collector frees memory only if more than 75% is involved. And since most services have burstable memory, it has always been occupied by the JVM. Therefore, all these Java-services ate much more RAM than expected.
- Some applications requested too much memory, and the Kubernetes scheduler did not give these nodes to other applications, although in fact they were freer than other nodes. One developer accidentally added an extra digit in the request and captured a large piece of RAM: 20 GB instead of 2. No one noticed. The application had 3 replicas, so as many as 3 nodes suffered.
- We imposed resource limits, rescheduled pods with the right requests, and got the perfect balance of iron usage across all nodes. A couple of nodes in general could be closed. And then we saw that we had the wrong machines (focused on the CPU, and not on memory). We changed the type and removed a few more nodes.
Results
With burstable resources in a cluster, you use the available hardware more efficiently, but the scheduler Kubernetes plans to submit requests for resources, which is fraught. To kill two birds with one stone: avoid problems, and use resources to the fullest - good monitoring is needed. This is where Kube Eagle comes in (Prometheus exporter and Grafana dashboard).
')
Source: https://habr.com/ru/post/447336/
All Articles