Cisco HyperFlex vs. competitors: test performance
We continue to introduce you to the Cisco HyperFlex hyperconvergent system.
In April 2019, Cisco once again holds a series of demonstrations of the new Cisco HyperFlex hyper-convergent solution in the Russian regions and in Kazakhstan. You can sign up for a demonstration via the feedback form by clicking on the link. Join now!
Earlier we published an article about load tests performed by an independent laboratory ESG Lab in 2017. In 2018, the characteristics of the Cisco HyperFlex solution (version HX 3.0) improved significantly. In addition, competitive solutions also continue to improve. That is why we are publishing a new, more recent version of the comparative load tests from ESG.
')
In the summer of 2018, the ESG lab re-compared Cisco HyperFlex with its competitors. Given the current trend of using software-defined solutions, manufacturers of such platforms were also added to the benchmarking analysis.
As part of testing, HyperFlex was compared with two fully software hyperconvergent systems that are installed on standard x86 servers, as well as with a single software and hardware solution. Testing was carried out using standard software for hyperconvergent systems - HCIBench, which uses the Oracle Vdbench tool and automates the testing process. In particular, HCIBench automatically creates virtual machines, coordinates the workload between them, and generates convenient and understandable reports.
140 virtual machines per cluster were created (35 per cluster node). Each virtual machine used 4 vCPU, 4 GB RAM. The local VM disk was 16 GB and an additional 40 GB disk.
The following cluster configurations participated in the testing:
The processors and RAM of all solutions were identical.
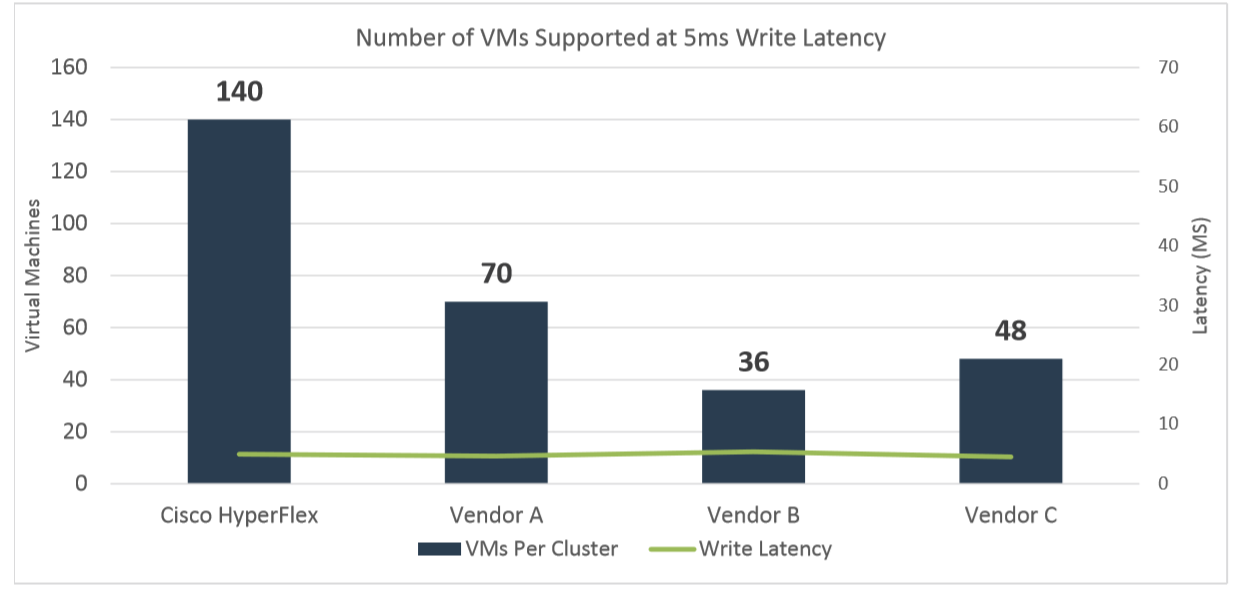
Testing began with a workload designed to emulate a standard OLTP test: read / write (RW) 70% / 30%, 100% FullRandom with a target value of 800 IOPS per virtual machine (VM). The test was conducted on 140 VMs in each cluster for three to four hours. The purpose of the test is to keep the recording latency at the maximum number of VMs at 5 milliseconds or below.
As a result of the test (see chart below), HyperFlex turned out to be the only platform that completed this test with the initial 140 VM and with delays below 5 ms (4.95 ms). For each of the other clusters, the test was restarted in order to experimentally adjust the number of VMs to a target delay of 5 ms in several iterations.
Vendor A successfully coped with 70 VMs with an average response time of 4.65 ms.
Vendor B provided the required latency of 5.37 ms. only with 36 VM.
Vendor C was able to withstand 48 virtual machines with a response time of 5.02 ms
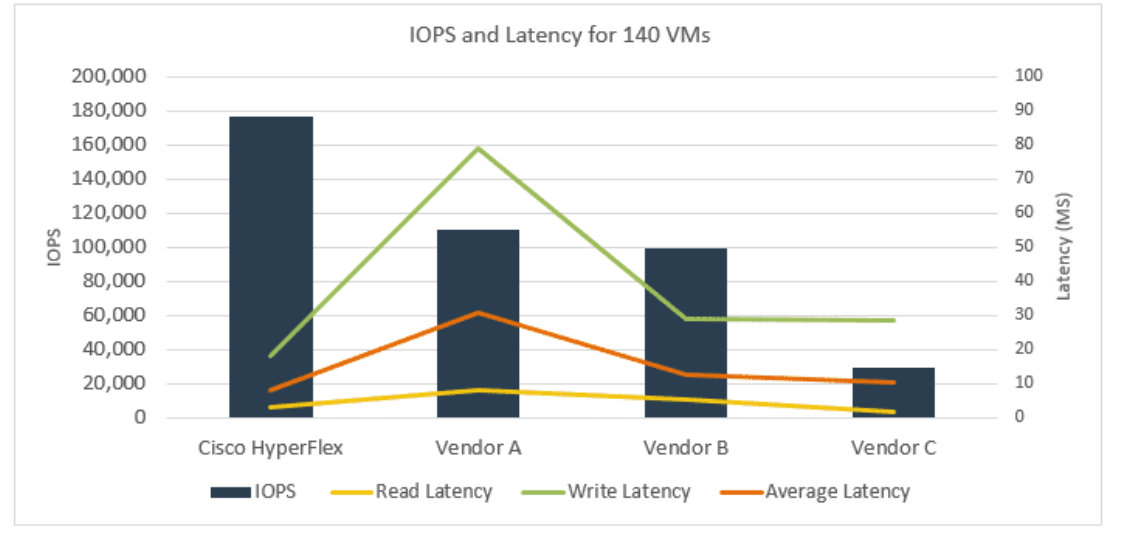
Next, ESG Lab emulated the load on SQL Server. The test used different block sizes and read / write ratios. The test was also launched on 140 virtual machines.
As shown in the figure below, Cisco HyperFlex cluster is almost twice as large as IOPS vendors A and B, and vendor C more than five times. The average Cisco HyperFlex response time was 8.2 ms. For comparison, the average response time of vendor A was 30.6 ms, vendor B - 12.8 ms, and vendor C - 10.33 ms.
An interesting observation was made during all the tests. Vendor B showed a significant variation in average performance in IOPS-ah on different VMs. That is, the load was distributed very unevenly, some VMs worked with an average value of 1000 IOPS +, and some - with a value of 64 IOPS. Cisco HyperFlex in this case looked much more stable, all 140 VMs received an average of 600 IOPS from the storage subsystem, that is, the load between virtual machines was distributed very evenly.
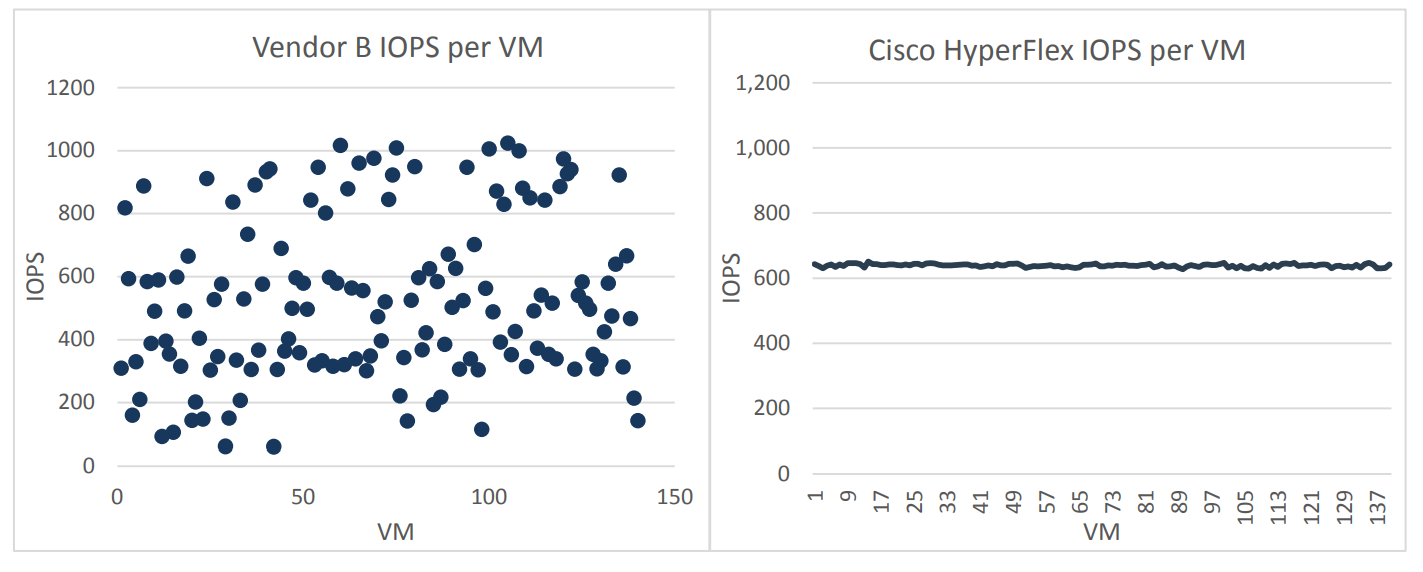
It is important to note that such an uneven distribution of IOPS across virtual machines from vendor B was observed in each iteration of testing.
In real production, this system behavior can be a big problem for administrators, in fact, individual virtual machines randomly start to “hang” and there is practically no way to control this process. The only, not very successful way of load balancing, when using a solution from vendor B, is to use one or another implementation of QoS or balancing.
Let's think about what is 140 virtual machines in Cisco Hyperflex on 1 physical node versus 70 or less in other solutions? For business, this means that maintaining the same number of applications on Hyperflex requires 2 times less nodes than competing solutions, i.e. the final system will be much cheaper. If we add here the level of automation of all network maintenance operations, servers and storage platform of the HX Data Platform, it becomes clear why Cisco Hyperflex solutions are so rapidly gaining popularity in the market.
In general, the ESG Lab confirmed that Hybrid Cisco HyperFlex versions HX 3.0 provide better and more stable performance than other similar solutions.
At the same time, HyperFlex hybrid clusters were also ahead of the competitors in terms of IOPS and Latency. Equally important, HyperFlex performance was achieved with a very well distributed load across the entire storage.
Recall that you can see the Cisco Hyperflex solution and see its capabilities right now. The system is available for demonstration to everyone:
In April 2019, Cisco once again holds a series of demonstrations of the new Cisco HyperFlex hyper-convergent solution in the Russian regions and in Kazakhstan. You can sign up for a demonstration via the feedback form by clicking on the link. Join now!
Earlier we published an article about load tests performed by an independent laboratory ESG Lab in 2017. In 2018, the characteristics of the Cisco HyperFlex solution (version HX 3.0) improved significantly. In addition, competitive solutions also continue to improve. That is why we are publishing a new, more recent version of the comparative load tests from ESG.
')
In the summer of 2018, the ESG lab re-compared Cisco HyperFlex with its competitors. Given the current trend of using software-defined solutions, manufacturers of such platforms were also added to the benchmarking analysis.
Test configurations
As part of testing, HyperFlex was compared with two fully software hyperconvergent systems that are installed on standard x86 servers, as well as with a single software and hardware solution. Testing was carried out using standard software for hyperconvergent systems - HCIBench, which uses the Oracle Vdbench tool and automates the testing process. In particular, HCIBench automatically creates virtual machines, coordinates the workload between them, and generates convenient and understandable reports.
140 virtual machines per cluster were created (35 per cluster node). Each virtual machine used 4 vCPU, 4 GB RAM. The local VM disk was 16 GB and an additional 40 GB disk.
The following cluster configurations participated in the testing:
- a cluster of four Cisco HyperFlex 220C nodes with 1 x 400 GB SSD for cache and 6 x 1.2 TB SAS HDD for data;
- Vendor A rival cluster of four nodes 2 x 400 GB SSD for cache and 4 x 1 TB SATA HDD for data;
- Vendor B rival cluster of four nodes 2 x 400 GB SSD for cache and 12 x 1.2 TB SAS HDD for data;
- Vendor C rival cluster of four nodes 4 x 480 GB SSD for cache and 12 x 900 GB SAS HDD for data.
The processors and RAM of all solutions were identical.
Test the number of virtual machines
Testing began with a workload designed to emulate a standard OLTP test: read / write (RW) 70% / 30%, 100% FullRandom with a target value of 800 IOPS per virtual machine (VM). The test was conducted on 140 VMs in each cluster for three to four hours. The purpose of the test is to keep the recording latency at the maximum number of VMs at 5 milliseconds or below.
As a result of the test (see chart below), HyperFlex turned out to be the only platform that completed this test with the initial 140 VM and with delays below 5 ms (4.95 ms). For each of the other clusters, the test was restarted in order to experimentally adjust the number of VMs to a target delay of 5 ms in several iterations.
Vendor A successfully coped with 70 VMs with an average response time of 4.65 ms.
Vendor B provided the required latency of 5.37 ms. only with 36 VM.
Vendor C was able to withstand 48 virtual machines with a response time of 5.02 ms
SQL Server load emulation
Next, ESG Lab emulated the load on SQL Server. The test used different block sizes and read / write ratios. The test was also launched on 140 virtual machines.
As shown in the figure below, Cisco HyperFlex cluster is almost twice as large as IOPS vendors A and B, and vendor C more than five times. The average Cisco HyperFlex response time was 8.2 ms. For comparison, the average response time of vendor A was 30.6 ms, vendor B - 12.8 ms, and vendor C - 10.33 ms.
An interesting observation was made during all the tests. Vendor B showed a significant variation in average performance in IOPS-ah on different VMs. That is, the load was distributed very unevenly, some VMs worked with an average value of 1000 IOPS +, and some - with a value of 64 IOPS. Cisco HyperFlex in this case looked much more stable, all 140 VMs received an average of 600 IOPS from the storage subsystem, that is, the load between virtual machines was distributed very evenly.
It is important to note that such an uneven distribution of IOPS across virtual machines from vendor B was observed in each iteration of testing.
In real production, this system behavior can be a big problem for administrators, in fact, individual virtual machines randomly start to “hang” and there is practically no way to control this process. The only, not very successful way of load balancing, when using a solution from vendor B, is to use one or another implementation of QoS or balancing.
Conclusion
Let's think about what is 140 virtual machines in Cisco Hyperflex on 1 physical node versus 70 or less in other solutions? For business, this means that maintaining the same number of applications on Hyperflex requires 2 times less nodes than competing solutions, i.e. the final system will be much cheaper. If we add here the level of automation of all network maintenance operations, servers and storage platform of the HX Data Platform, it becomes clear why Cisco Hyperflex solutions are so rapidly gaining popularity in the market.
In general, the ESG Lab confirmed that Hybrid Cisco HyperFlex versions HX 3.0 provide better and more stable performance than other similar solutions.
At the same time, HyperFlex hybrid clusters were also ahead of the competitors in terms of IOPS and Latency. Equally important, HyperFlex performance was achieved with a very well distributed load across the entire storage.
Recall that you can see the Cisco Hyperflex solution and see its capabilities right now. The system is available for demonstration to everyone:
Source: https://habr.com/ru/post/446638/
All Articles