The Impact of Transparent Huge Pages on System Performance
The article is published on behalf of Akhaltsev John, Jiga
Tinkoff.ru today is not just a bank, it is an IT company. It provides not only banking services, but also builds an ecosystem around them.
At Tinkoff.ru we are partnering with various services to improve the quality of customer service, and we help them to become better. For example, we conducted load testing and performance analysis of one of these services that helped find bottlenecks in the system — included Transparent Huge Pages in the OS configs.
If you want to know how to analyze the performance of the system and what came out of it, then welcome under cat.
Description of the problem
Currently, the service architecture is:
- Nginx web server to handle http connections
- Php-fpm to manage php processes
- Redis for caching
- PostgreSQL storage
- Monolithic shopping solution
The main problem that we found during the next sale under high load was the high utilization of cpu, while the processor time in the kernel mode (system time) grew and was longer than the user mode time.
- User Time is the time that the processor spends on the user's tasks. This is the main thing you pay for when buying a processor.
- System time (system time) - the amount of time that the system spends on paging, changing context, launching tasks on a schedule and other system tasks.
Determination of the primary characteristics of the system
To begin with, we collected a load circuit with resources close to productive, and made up the load profile corresponding to the normal load on a typical day.
Gatling version 3 was chosen as a tool for shelling, and the shelling itself was carried out on the local network via gitlab-runner. The location of agents and targets in the same local network is due to the reduction of network costs, so we focus on checking the execution of the code itself, and not on the speed of the infrastructure where the system is deployed.
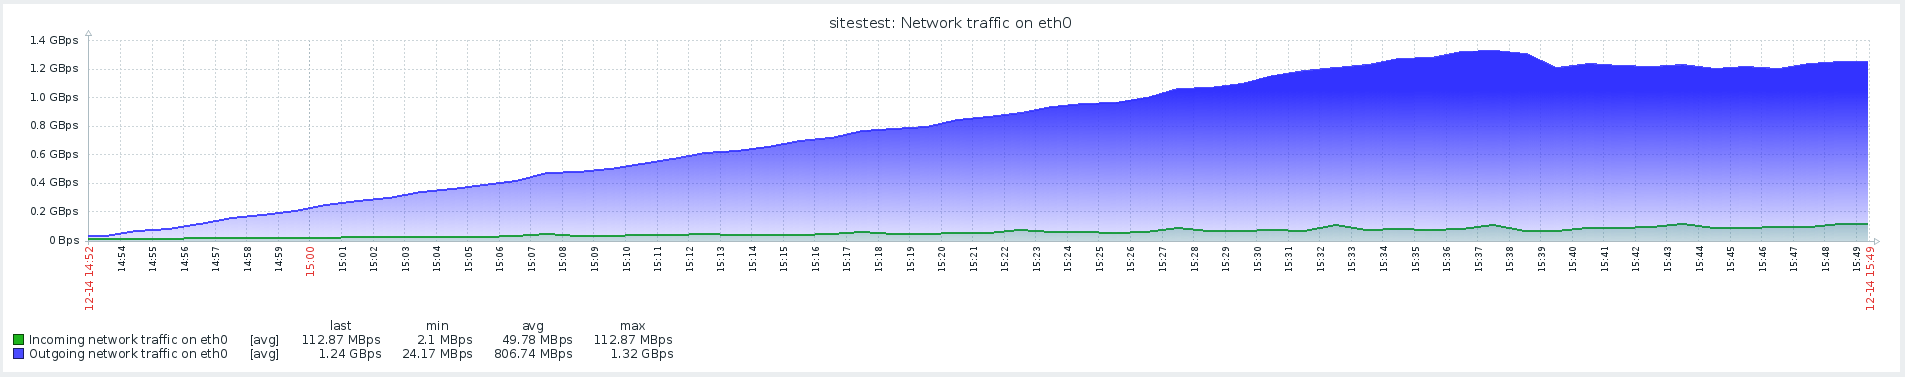
When determining the primary characteristics of the system, a scenario with a linearly increasing load with the http configuration is suitable:
val httpConfig: HttpProtocolBuilder = http .baseUrl("https://test.host.ru") .inferHtmlResources() // .disableCaching // , "" . .disableFollowRedirect // /// MULTIPLIER JAVA_OPTS setUp( Scenario.inject( rampUsers(100 * MULTIPLIER) during (200 * MULTIPLIER seconds)) ).protocols(httpConfig) .maxDuration(1 hour) At this stage, implemented the script to open the main page and download all the resources

The results of this test showed a maximum performance of 1500 rps, a further increase in the intensity of the load led to the degradation of the system associated with increasing softirq time.

Softirq is a pending interrupt mechanism and is described in the kernel / softirq.c file. At the same time, they clog up the queue of instructions to the processor, not allowing to make useful calculations in user mode. Interrupt handlers can also delay additional work with network packets in OS threads (system time). Briefly about the work of the network stack and optimizations can be found in a separate article .
The suspicion of the main problem was not confirmed, because there was a much longer system time on the sale with less network activity.
Custom Scripts
The next step was to develop custom scripts and add something more than just opening the picture page. The profile includes heavy operations, which fully utilized the site code and database, and not a web server giving static resources.
The test with a stable load was launched at a lower intensity from the maximum one, a transition to redirects was added to the configuration:
val httpConfig: HttpProtocolBuilder = http .baseUrl("https://test.host.ru") .inferHtmlResources() // .disableCaching // , "" . /// MULTIPLIER JAVA_OPTS setUp( MainScenario .inject(rampUsers(50 * MULTIPLIER) during (200 * MULTIPLIER seconds)), SideScenario .inject(rampUsers(100 * MULTIPLIER) during (200 * MULTIPLIER seconds)) ).protocols(httpConfig) .maxDuration(2 hours) 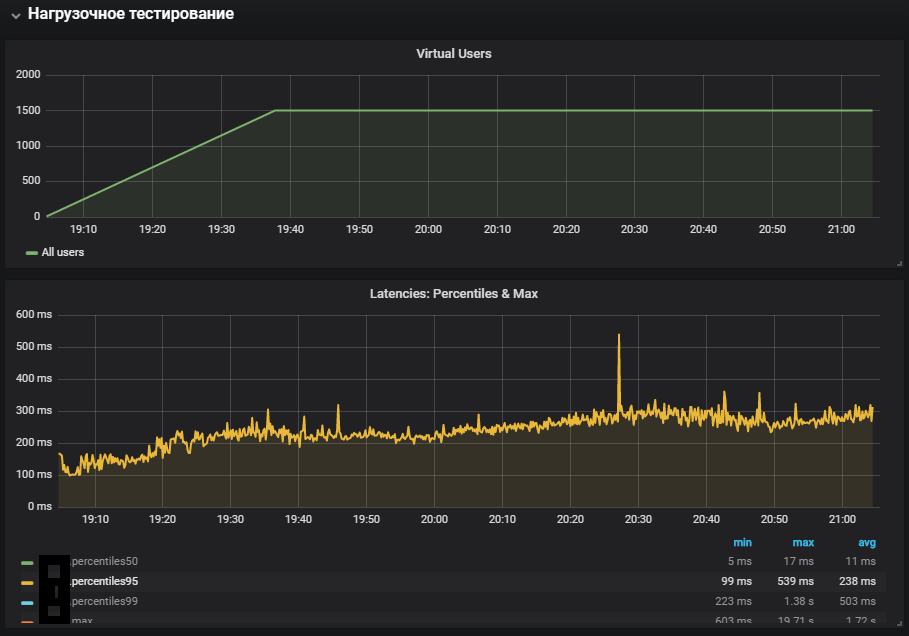

The most complete use of the systems showed an increase in the system time metric, as well as its growth during the stability test. The problem with the production environment has been replicated
Networking with Redis
When analyzing problems, it is very important to have monitoring of all system components in order to understand how it works and what effect it has on the applied load.
When the monitoring of Redis appeared, it became possible to look not at the general metrics of the system, but at its specific components. The scenario for stress testing was also changed, which, together with additional monitoring, helped to get closer to the localization of the problem.

In monitoring, Redis saw a similar picture with the utilization of cpu, or rather system time, significantly more than the user time, while the main utilization of cpu fell on the SET operation, that is, the allocation of RAM to store values.

To eliminate the influence of network interaction with Redis, it was decided to test the hypothesis and switch Redis to a UNIX socket instead of a tcp socket. This was done right in the framework through which php-fpm connects to the database. In the /yioftoft / yii/framework/caching/CRedisCache.php file, we replaced the line with host: port with a hardcode redis.sock. More information about the performance of sockets can be found in the article .
/** * Establishes a connection to the redis server. * It does nothing if the connection has already been established. * @throws CException if connecting fails */ protected function connect() { $this->_socket=@stream_socket_client( // $this->hostname.':'.$this->port, "unix:///var/run/redis/redis.sock", $errorNumber, $errorDescription, $this->timeout ? $this->timeout : ini_get("default_socket_timeout"), $this->options ); if ($this->_socket) { if($this->password!==null) $this->executeCommand('AUTH',array($this->password)); $this->executeCommand('SELECT',array($this->database)); } else { $this->_socket = null; throw new CException('Failed to connect to redis: '.$errorDescription,(int)$errorNumber); } } Unfortunately, this did not have much effect. Utilization of the CPU has stabilized a bit, but it didn’t solve our problem - most of the utilization of the CPU came from computing in kernel mode.
Benchmark using stress and troubleshooting THP
The stress utility, a simple workload generator for POSIX systems that can load individual components of the system, for example, CPU, Memory, IO, helped locate the problem.
Testing is supposed on the hardware and OS version:
Ubuntu 04.04.1 LTS
12 Intel® Xeon® CPUs
Installation of the utility is performed using the command:
sudo apt-get install stress We look at how the CPU is utilized under load, run a test that creates workers for calculating square roots with a duration of 300 seconds:
-c, --cpu N spawn N workers spinning on sqrt() > stress --cpu 12 --timeout 300s stress: info: [39881] dispatching hogs: 12 cpu, 0 io, 0 vm, 0 hdd 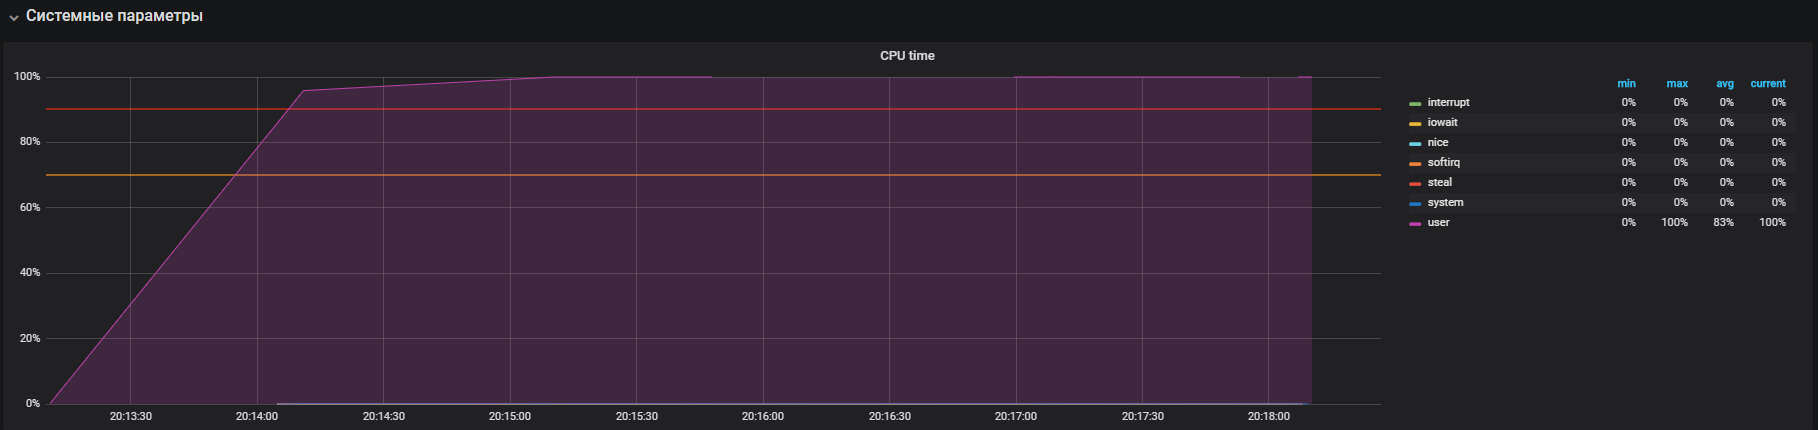
The graph shows the full utilization in user mode - this means that all the processor cores are loaded and useful calculations are performed, and not system servicing calls.
The next step is to consider the use of resources during intensive work with io. We run the test for 300 seconds with the creation of 12 workers who perform sync (). The sync command writes data buffered in memory to disk. The kernel stores data in memory to avoid frequent (usually slow) disk read and write operations. The sync () command ensures that everything that is stored in memory will be written to disk.
-i, --io N spawn N workers spinning on sync() > stress --io 12 --timeout 300s stress: info: [39907] dispatching hogs: 0 cpu, 0 io, 0 vm, 12 hdd 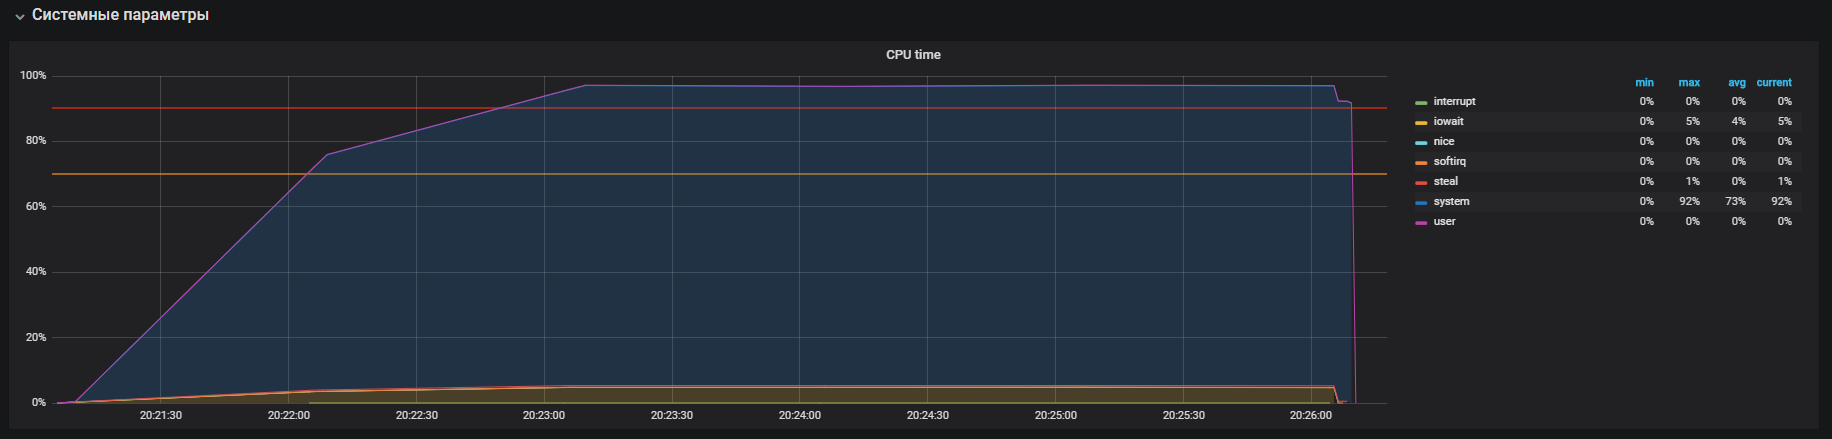

We see that the processor is mainly engaged in processing calls in the kernel mode and a bit in iowait, you can also see> 35k ops disk writes. This behavior is similar to the problem with high system time, the reasons for which we are analyzing. But here there are several differences: it is iowait and iops larger than on the productive contour, respectively, this does not fit our case.
It is time to check the memory. We launch 20 workers who will allocate and free memory for 300 seconds with the help of the command:
-m, --vm N spawn N workers spinning on malloc()/free() > stress -m 20 --timeout 300s stress: info: [39954] dispatching hogs: 0 cpu, 0 io, 20 vm, 0 hdd 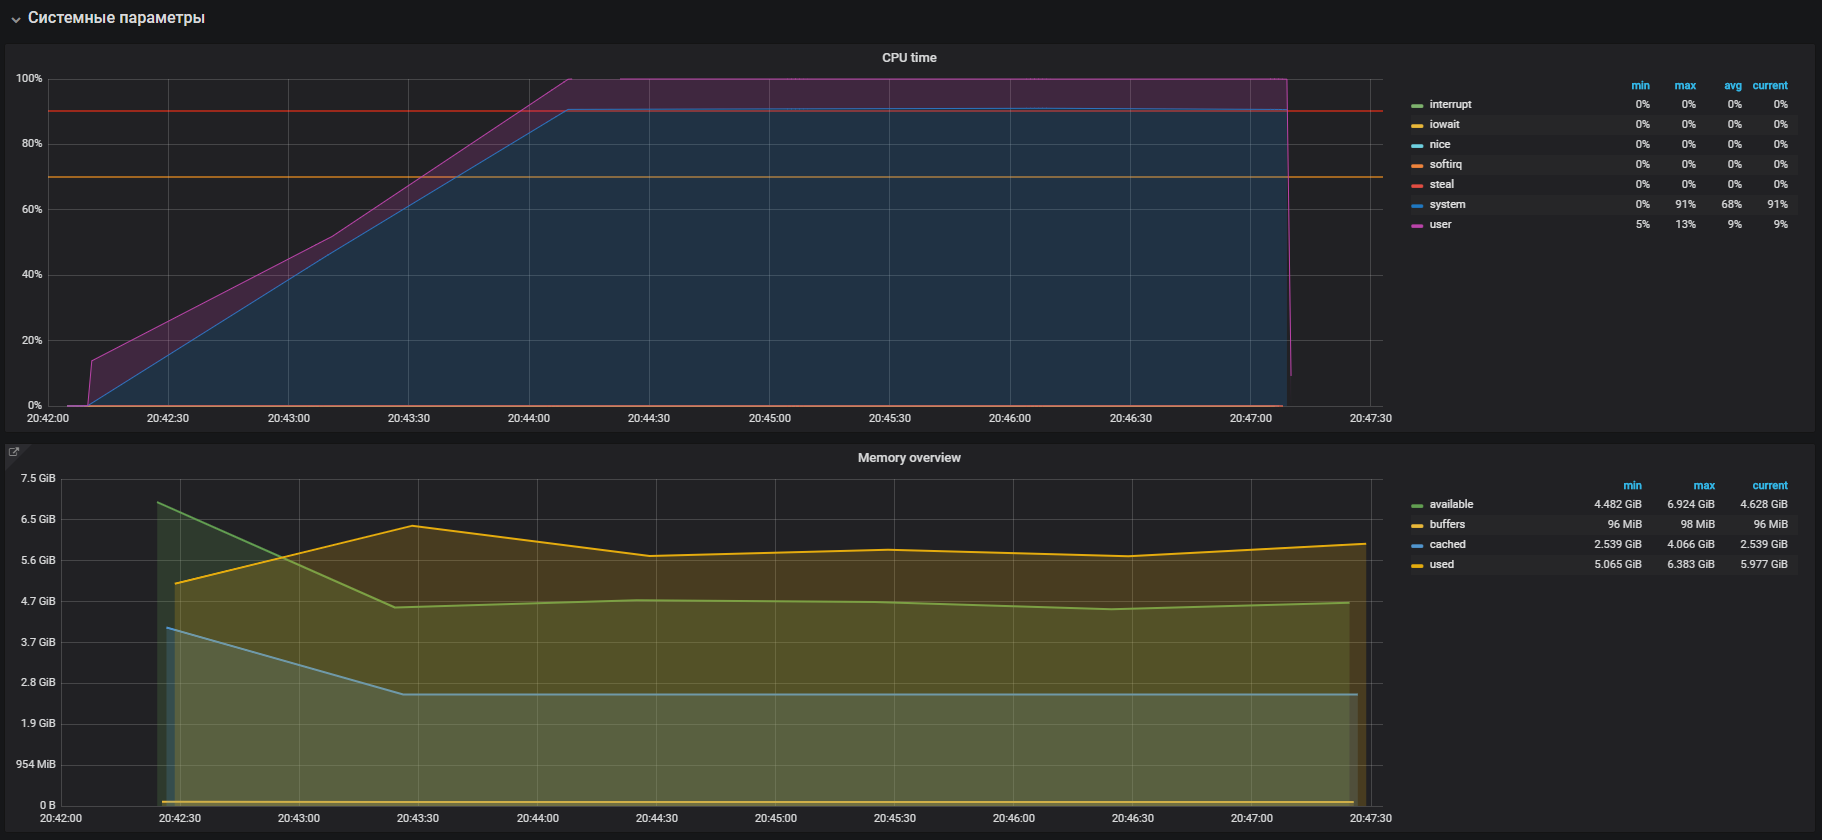
We immediately see the high utilization of the CPU in the system mode and a bit in the user mode, as well as the use of RAM more than 2 GB.
This case is very similar to the problem with the prod, which is confirmed by the large memory usage on the load tests. Therefore, the problem must be sought in the work of memory. The allocation and release of memory occurs through calls to malloc and free, respectively, which will eventually be processed by the system calls of the kernel, which means it will be displayed in the CPU utilization as system time.
In most modern operating systems, virtual memory is organized using page addressing, with this approach, the entire memory area is divided into pages of fixed length, for example 4096 bytes (default for many platforms), and when allocating, for example, 2 GB of memory, the memory manager will have to operate more than 500,000 pages. In this approach, there are large management overheads and to reduce them, Huge pages and Transparent Huge Pages technologies were invented, they can be used to increase the page size, for example, to 2MB, which will significantly reduce the number of pages in the heap of memory. The difference in technology lies only in the fact that for Huge pages we must explicitly set up the environment and teach the program to work with them, while Transparent Huge Pages works “transparently” for programs.
THP and problem solving
If you google information about Transparent Huge Pages, you can see in the search results many pages with questions "How to turn off THP."
As it turned out, this “cool” feature was introduced into the Linux kernel by the Red Hat corporation, the essence of the features, in that applications can work transparently with memory, as if they work with real Huge Page. According to the benchmarks, THP speeds up the abstract application by 10%, you can see more in the presentation, but in reality everything is different. In some cases, THP causes an unwarranted increase in CPU consumption in systems. More details can be found with the recommendations from Oracle.
Go and check our parameter. As it turned out, THP is enabled by default - turn off using the command:
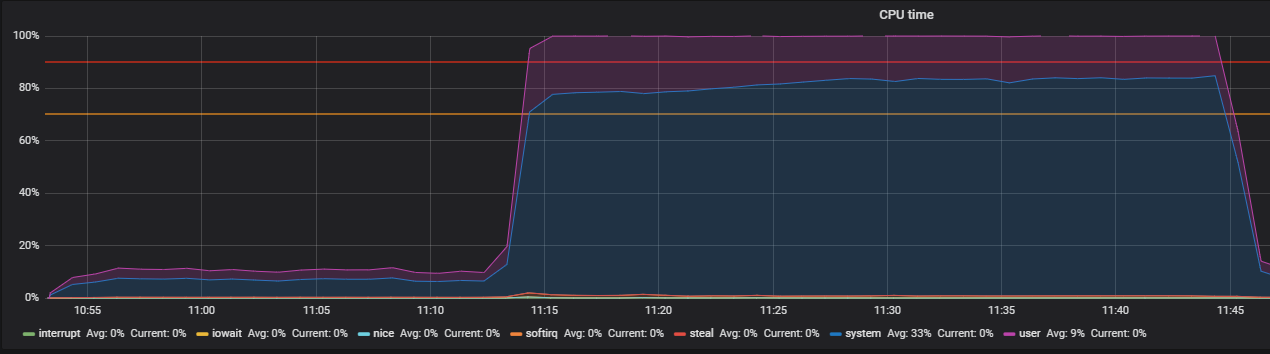
echo never > /sys/kernel/mm/transparent_hugepage/enabled We confirm using the test before turning off the THP and after, on the load profile:
setUp( MainScenario.inject( rampUsers(150) during (200 seconds)), Peak.inject( nothingFor(20 minutes), rampUsers(5000) during (30 minutes)) ).protocols(httpConfig) 
Such a picture we observed before turning off the THP

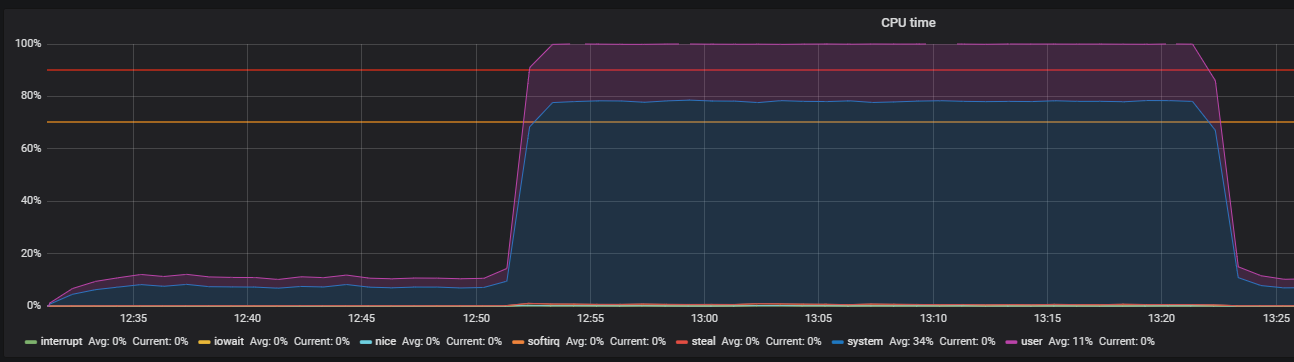
After turning off the THP, we can observe already reduced utilization of resources.
The main problem was localized. The reason was enabled by default in the OS.
transparent large pages mechanism. After turning off the THP option, the cpu utilization in the system mode decreased by at least 2 times, which freed up resources for the user mode. During the analysis of the main problem, “bottlenecks” of interaction with the network stack of the OS and Redis were also found, which is the reason for a deeper study. But that's another story.
Conclusion
In conclusion, I would like to give some tips for successfully finding performance problems:
- Before researching the performance of a system, thoroughly understand its architecture and interaction components.
- Configure monitoring for all system components and track if there is a shortage of standard metrics, go deep and expand.
- Read the manuals for the systems used.
- Check the default settings in the OS configuration files and system components.
')
Source: https://habr.com/ru/post/446342/
All Articles