SVG 3D: create, rotate and animate

Just over a week ago, in the framework of the Telegram contest, I had to plunge into the "magic world" of svg, mathematical formulas, optimization and animation. The competitive task was to create a fairly simple JS chart, but some nuances of the task and an emphasis on performance made it interesting. Given the desire to create something with a claim to victory, it was necessary to dive a little deeper than the usual threshold mark for typical (and not so) projects from the world of frontend development.
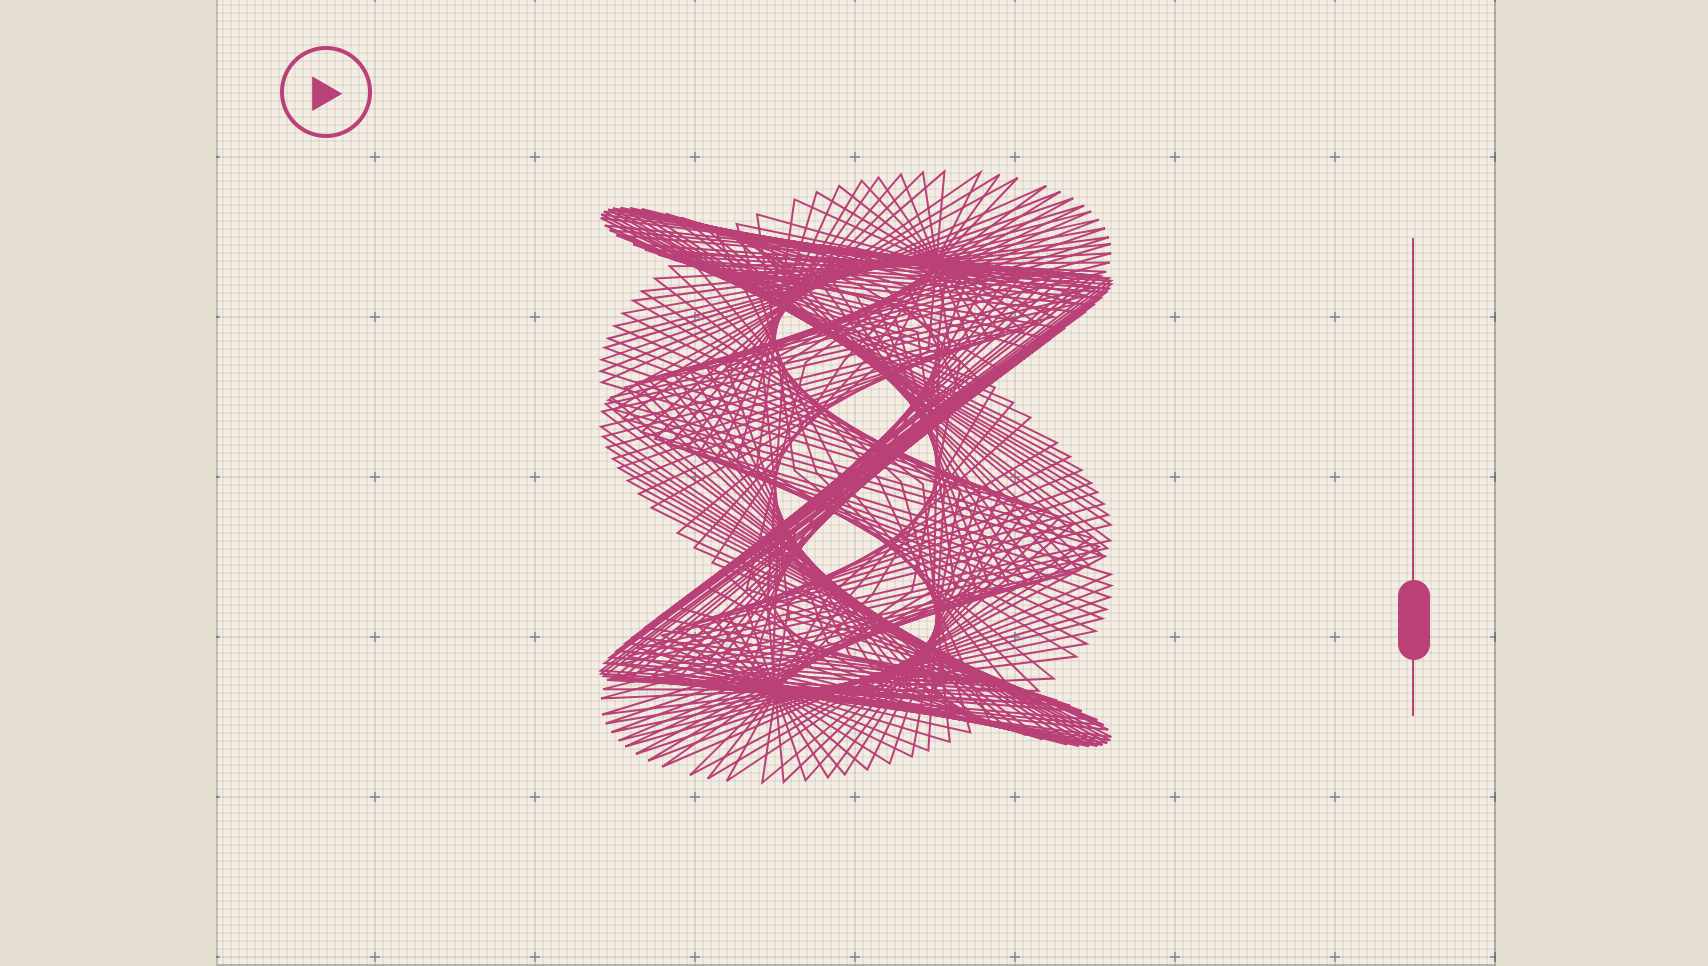
With the completion of concise work did not happen, but this time was not wasted. The main discovery was the ability to fully work with 3D graphics in SVG! Creation of models, rotation on the selected axis, animation according to the scenario and much more - all this is available already here and now.
The most important
Initializing an SVG element as 3D:
<svg xmlns="http://www.w3.org/2000/svg" viewBox="0 0 200 200" axisZ="true"> Rotation on a given axis:
polyLine.rotateX(45); polyLine.rotateY(90); Adding scenes and starting animation:
polyLine.addAnimScene('rotateX', 45); polyLine.addAnimScene('rotateZ', 60); ... polyLine.runAnimScene(delay); Demo
')
Source: https://habr.com/ru/post/446338/
All Articles