Expansion of the Universe - the greatest misconception in the history of science
Cosmological (metagalactic) redshift - observed for all distant sources (galaxies, quasars) decrease in radiation frequencies, explained as dynamic removal of these sources from each other and, in particular, from our Galaxy, that is, as non-stationarity (expansion) of the Metagalaxy.
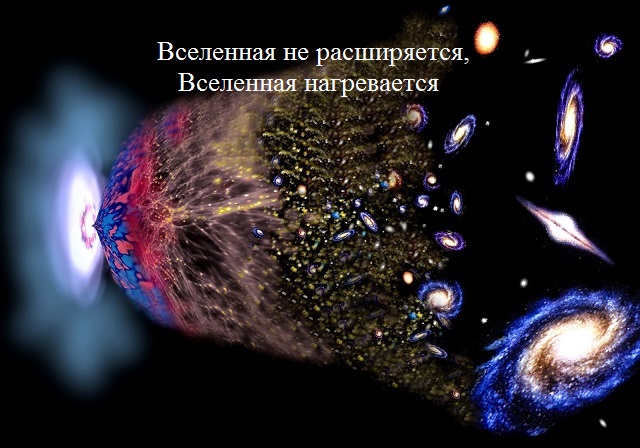
Graphically, it looks like this - Fig.1.

')
Fig.1 Graphic representation of the cosmological redshift.
The red shift for galaxies was discovered by the American astronomer Vesto Slipher in 1912-1914, and in 1929 Edwin Hubble discovered that the red shift for distant galaxies is greater than for nearby ones and increases approximately in proportion to the distance (Hubble's law).
Various explanations were proposed for the observed displacement of spectral lines, for example, the hypothesis of tired light, but ultimately associated with the effect of the expansion of intergalactic space in general relativity. This explanation of this phenomenon is generally accepted.
The redshift caused by the expansion is often confused with the more familiar redshift caused by the Doppler effect, which usually makes sound waves longer if the sound source is removed. The same is true for light waves that become longer if the light source moves away in space.
Doppler redshift and cosmological redshift are completely different things and are described by different formulas. The first follows from the particular theory of relativity, which does not take into account the expansion of space, and the second follows from the general theory of relativity. These two formulas are almost the same for nearby galaxies, but different for distant ones.
The complexity of knowing the world around us is that the conclusions from many observational and experimental data may be incorrect and then the picture of the surrounding reality is distorted. And although it is customary in science to carry out one theory or another for broad discussion, mistakes are inevitable. It all depends on how many followers supported the theory. Cosmological redshift dependency is associated with expanding space. This is a generally accepted theory.
However, another explanation of the Cosmological redshift is possible. This work is relevant in that it allows you to take a different look at this phenomenon, previously not voiced by any researcher. This, in my opinion, is a step in a new physics.
The purpose of the article is to show the dependence of the Cosmological redshift on the temperature of the medium of propagation of visible radiation. To solve this problem we will use the experimental and research data of modern science. Planck's experiments showed that the frequency of radiation of an absolutely black body increases with increasing temperature. The higher the temperature, the higher the radiation frequency. This relationship extends to simple bodies. Thus, the higher the temperature, the higher the frequency of radiation (and absorption) of the substance, and hydrogen, including.
Consider the types of spectra.
1. The continuous spectrum - Fig.2.
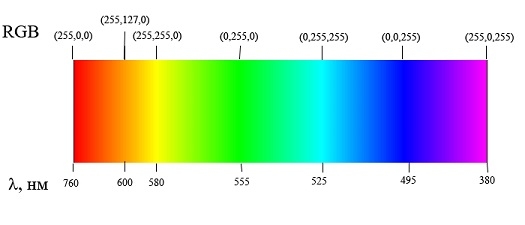
Fig.2 The continuous spectrum of visible radiation
The spectrum of visible radiation is continuous. This suggests that in this spectrum there are all, without exception, the frequency of visible radiation. A characteristic feature of radiation is that radiation of a certain frequency always falls on the same place in the spectrum. And there are no exceptions.
2. Line spectrum - Fig.3.
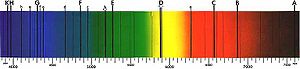
Fig.3 Line spectrum
The presence of vertical lines in the spectrum indicates that there are no emission frequencies in the spectrum and nothing more. Now, referring to Fig. 1, we can state that in the spectrum of position 1 there is no part of the radiation relating to green color, at position 2 there is no part of radiation relating to yellow, and at position 3 there is no part of radiation related to blue.
The radiation spectrum in the visible range of any galaxy is continuous. Fraunhofer hydrogen absorption lines are superimposed on this spectrum. What does this mean? This suggests that part of the waves of a certain length were absorbed by hydrogen. That is, as we approached the observer, some of the spectrum waves were lost. Needless to say, this has nothing to do with the radiation process and is related to the galaxy environment. The environment of galaxies is a hydrogen medium, which absorbs part of the waves. I emphasize that this is the environment of those galaxies that directly emit waves in the visible range. This radiation is recorded only if passed in vacuum directly to the observer, bypassing any other galaxies. If this were not the case, i.e. radiation would pass through a substance, then it would be completely absorbed. On some spectra of visible radiation of distant galaxies, Fraunhofer lines are superimposed on other frequencies of the spectrum, which means that these wavelengths are absorbed by the environment of nearby galaxies. Therefore, the imposition of Fraunhofer lines is strongly associated with the hydrogen surrounding the galaxies, which directly emit and near which the radiation passes. But all the galaxies are surrounded by hydrogen. So why are Fraunhofer lines superimposed on different parts of the spectrum of visible radiation? And the farther the galaxy, the more Fraunhofer hydrogen absorption lines are shifted to the longer wavelength zone of the visible spectrum. The answer is only one. The temperature of the hydrogen environment surrounding the galaxy is different. The lower the temperature of the absorption medium, the more Fraunhofer hydrogen absorption line shifts to the longer wavelength of the spectrum. This is proved by the spectral series of hydrogen emissions, which are located in all radiation ranges.
Spectral series of hydrogen.
Studied series:
Lyman series
Discovered by T. Lyman in 1906. All lines of the series are in the ultraviolet range. The series corresponds to the Rydberg formula with n ′ = 1 and n = 2, 3, 4, ...; line Lα = 1216 Å is the resonant line of hydrogen. The border of the series is 911.8 Å.
Balmer series
Discovered by I. Ya. Balmer in 1885. The first four lines of the series are in the visible range and were known long before Balmer, who proposed an empirical formula for their wavelengths and, on its basis, predicted the existence of other lines of this series in the ultraviolet region. The series corresponds to the Rydberg formula with n ′ = 2 and n = 3, 4, 5, ...; the Hα line is 6565 Å; the series boundary is 3647 Å.
Paschen series
Predicted by Ritz in 1908 based on the combinational principle. Discovered by F. Paschen in the same year. All lines of the series are in the infrared range. The series corresponds to the Rydberg formula with n ′ = 3 and n = 4, 5, 6, ...; the line Pα = 18 756 Å; the series boundary is 8206 Å.
Bracket Series
It was opened by F. S. Brackett in 1922. All lines of the series are in the near infrared range. The series corresponds to the Rydberg formula with n ′ = 4 and n = 5, 6, 7, ...; Bα line = 40 522 Å. The border of the series is 14 588 Å.
Pfunda series
Discovered by A. G. Pfund in 1924. The lines of the series are in the near (part of the average) infrared range. The series corresponds to the Rydberg formula with n ′ = 5 and n = 6, 7, 8, ...; Pfα line = 74 598 Å. The border of the series is 22,794 Å.
Hampfrey Series
KD Hampfrey was discovered in 1953. The series corresponds to the Rydberg formula with n ′ = 6 and n = 7, 8, 9, ...; the main line is 123 718 Å, the boundary of the series is 32 823 Å.
The location of the series depends on the radiation temperature.
An alternative explanation of the cause of the Cosmological redshift from the position of the influence of the propagation medium on the visible radiation of distant galaxies is a new word in science. Previously, none of the scientists did not express such an explanation of the Causes of the Cosmological Red shift.
The Fraunhofer absorption lines of a certain frequency by the hydrogen-propagation medium are superimposed on the continuous spectrum of visible radiation of distant galaxies. These lines are shifted to the long-wave side, which indicates a change in the properties of the propagation medium, and not the properties of the radiation itself (change in wavelength), and these changes are associated primarily with temperature. And this, in turn, suggests that the Universe in its evolutionary development is heated.
Scientists completely ignore the fact that hydrogen, depending on temperature, emits waves of different lengths. Accordingly, depending on the temperature, it absorbs waves of different lengths. Therefore, the cosmological redshift is due to the temperature in the Universe, the farther, the temperature of the medium of wave propagation, and the medium is hydrogen, was lower.
Conclusion. What do the Fraunhofer lines on the continuous spectrum of visible radiation of distant galaxies say? A continuous spectrum of visible radiation without fraunhofer lines indicates that the spectrum contains waves of all lengths (frequencies) inherent in the visible spectrum. The presence of the Fraunhofer lines indicates that there are no waves of a certain length (frequency) on the spectrum. The most common element in the space is hydrogen. He is surrounded by stars and distant galaxies. Hydrogen absorbs quanta carrying waves of these visible spectrum lengths. With this, let's say, defect, radiation of the visible spectrum comes to the observer. Waves missing in the spectrum can neither lengthen their length nor shorten them. They are simply not available, thus there is nothing to lengthen. Their absence is due to their absorption by hydrogen, depending on the temperature of the hydrogen. Just think how it can change, lengthen that which is not in the spectrum? Initially, there are no waves of a certain length in the spectrum, and their length cannot change. This means that hydrogen can alternately emit (and absorb) waves of all spectral lengths from radio to gamma, depending on temperature. The universe does not expand, the universe heats up.
This conclusion can be proved by experiment. One of the variants of such an experiment is the gradual heating of an iron rod (or tungsten) in a sealed chamber in a hydrogen medium. Iron, and even tungsten, starting from a certain temperature, emits a continuous spectrum of visible radiation. You can heat the current. Spectrum recorded by spectrometer.
Bibliographic list:
1. Bor N. Atom theory and principles of nature description / / Coll. N. Bor. From expletive scientific works. T. 2. M .: Science, 1971
2. Herods, I.E. The quantum physics. Basic laws: textbook / I.E. Herods - M .: BINOM. Laboratory of knowledge, 2010
3. Ischenko S.V., Krasilnikov S.S., Krasilnikova N.A., Smirnov A.V. Spectrum of the hydrogen atom. Isotopic shift. Laboratory work number 5.9. / Edited by Krasilnikov S.S. Tutorial -M. Publishing Department UC DO, 2005
4. LEKTSII Study of the spectrum of the hydrogen atom lektsii.org/12-58456.html
5. PANDIA Report on the laboratory work number 7 "Study of the spectrum of the hydrogen atom" pandia.ru/text/80/548/84450.php
6. POZNAUKA Spectral series of the emission of a hydrogen atom. poznayka.org/s68583t1.html
7. Saveliev, I.V. Physics course: textbook in 3 vols. V.3. Quantum optics. Atomic physics. Solid State Physics. Physics of the atomic nucleus and elementary particles, / I.V. Saveliev. - SPb .: Lan, 2007
8. Yavorsky B.M., Seleznev Yu.A. Handbook of Physics. Moscow "Science" 1989
Source: https://habr.com/ru/post/446046/
All Articles