Getting Yandex Direct advertising campaigns using the API in DataFrame (Python)
Working at once with several clients, it becomes necessary to quickly analyze a lot of information in different accounts and reports. When customers become more than 10, the marketer no longer has time to constantly monitor the statistics. But there is a way out.
In this article I will talk about how to monitor advertising accounts using API and Python.
At the output, we will receive a request to the Yandex Direct API, with which we will receive statistics on advertising campaigns and will be able to process this data.
')
For this we need:
You need to import the libraries that are used in the query, as well as the “pandas” and “DataFrame”.
All imports will look like this:
This time I can’t tell better about the Direct API API documentation, so I’ll leave a link.
( Instructions for obtaining a token )
We copy request from the API documentation
Change the query.
Token.
token = 'blaBlaBLAblaBLABLABLAblabla'
Login.
clientLogin = 'e-66666666'
From this
Do it
In SelectionCriteria, we write how we will select data. As a standard, 2 dates are written there, but in order not to constantly change them, we will replace the length of time with “Last 5 days”.
We set the filter for data . This is primarily required in order not to get empty values. The problem is that Direct shows the missing data as two minuses, because of which the data type of the entire column changes, after which you will not be able to perform mathematical operations without unnecessary gestures.
FieldNames. Register here the data that you need. I registered the fields that I use for analysis, your list may differ.
ReportType . This type of report is written in this field, for campaigns you need this particular report.
You should have something like this.
5. Import the data into the DataFrame.
(DataFrame is probably the most suitable way to work with this data.)
I was able to implement this function by writing and reading the csv file.
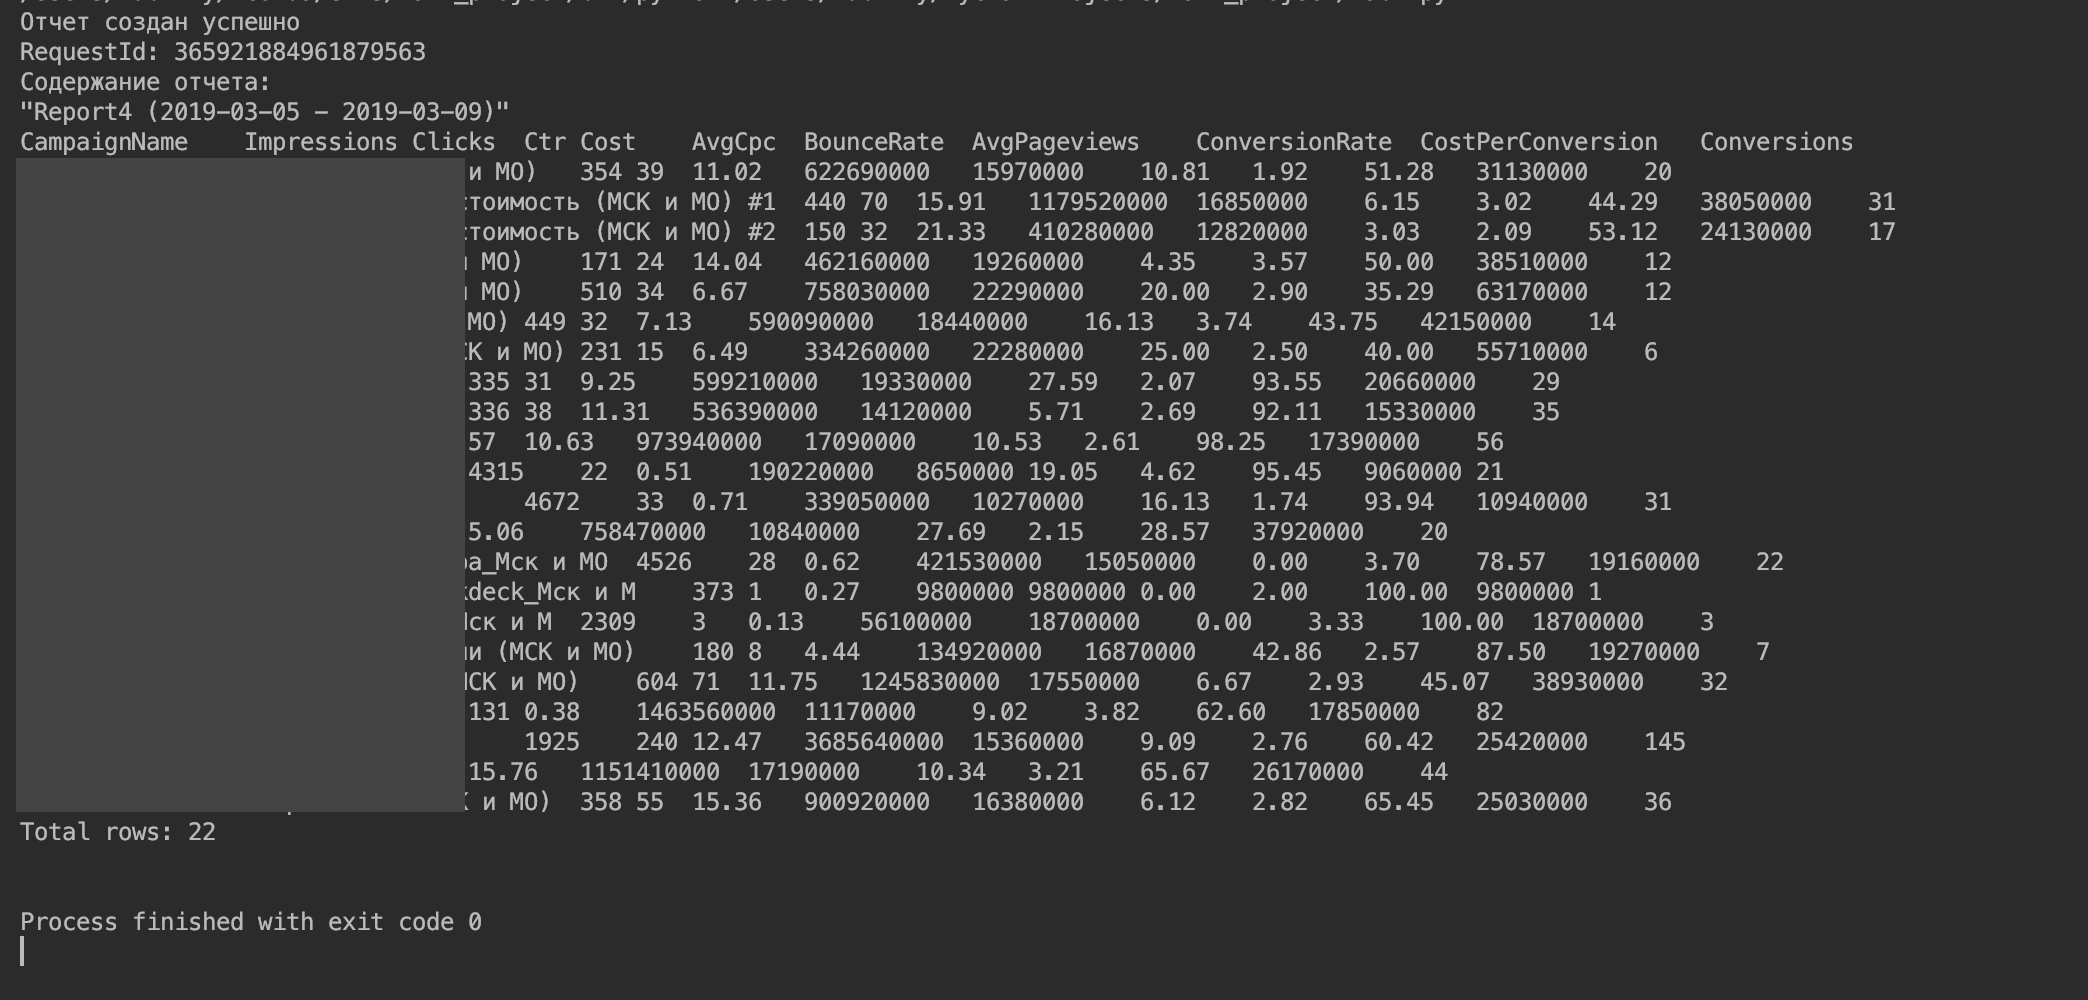
We find in the request a piece that is responsible for displaying statistics - this is “req.text”.
Remove the standard output of the program to write to the file. To do this, change all the conclusions in code 200.
On:
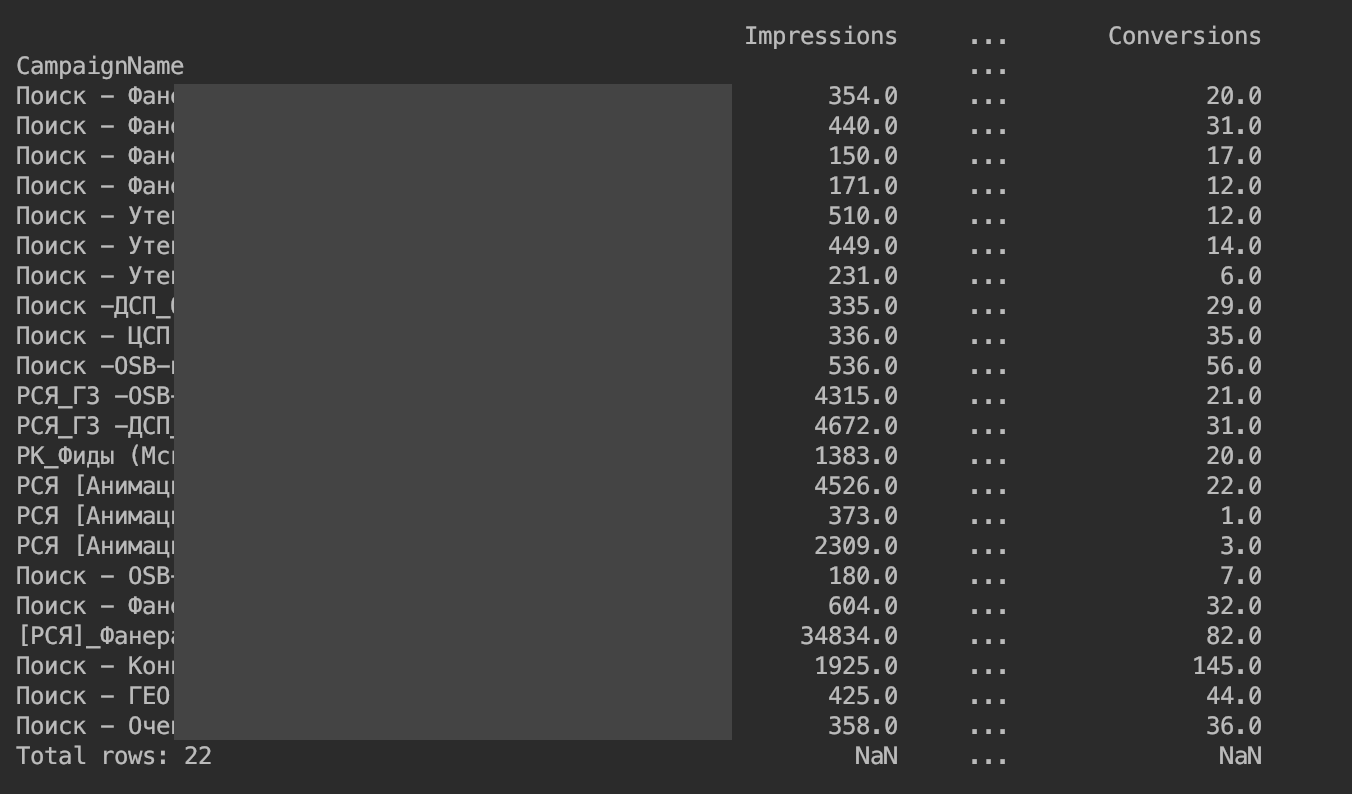
Now we import the server response into the DataFrame.
Step by Step:
It turned out the following:
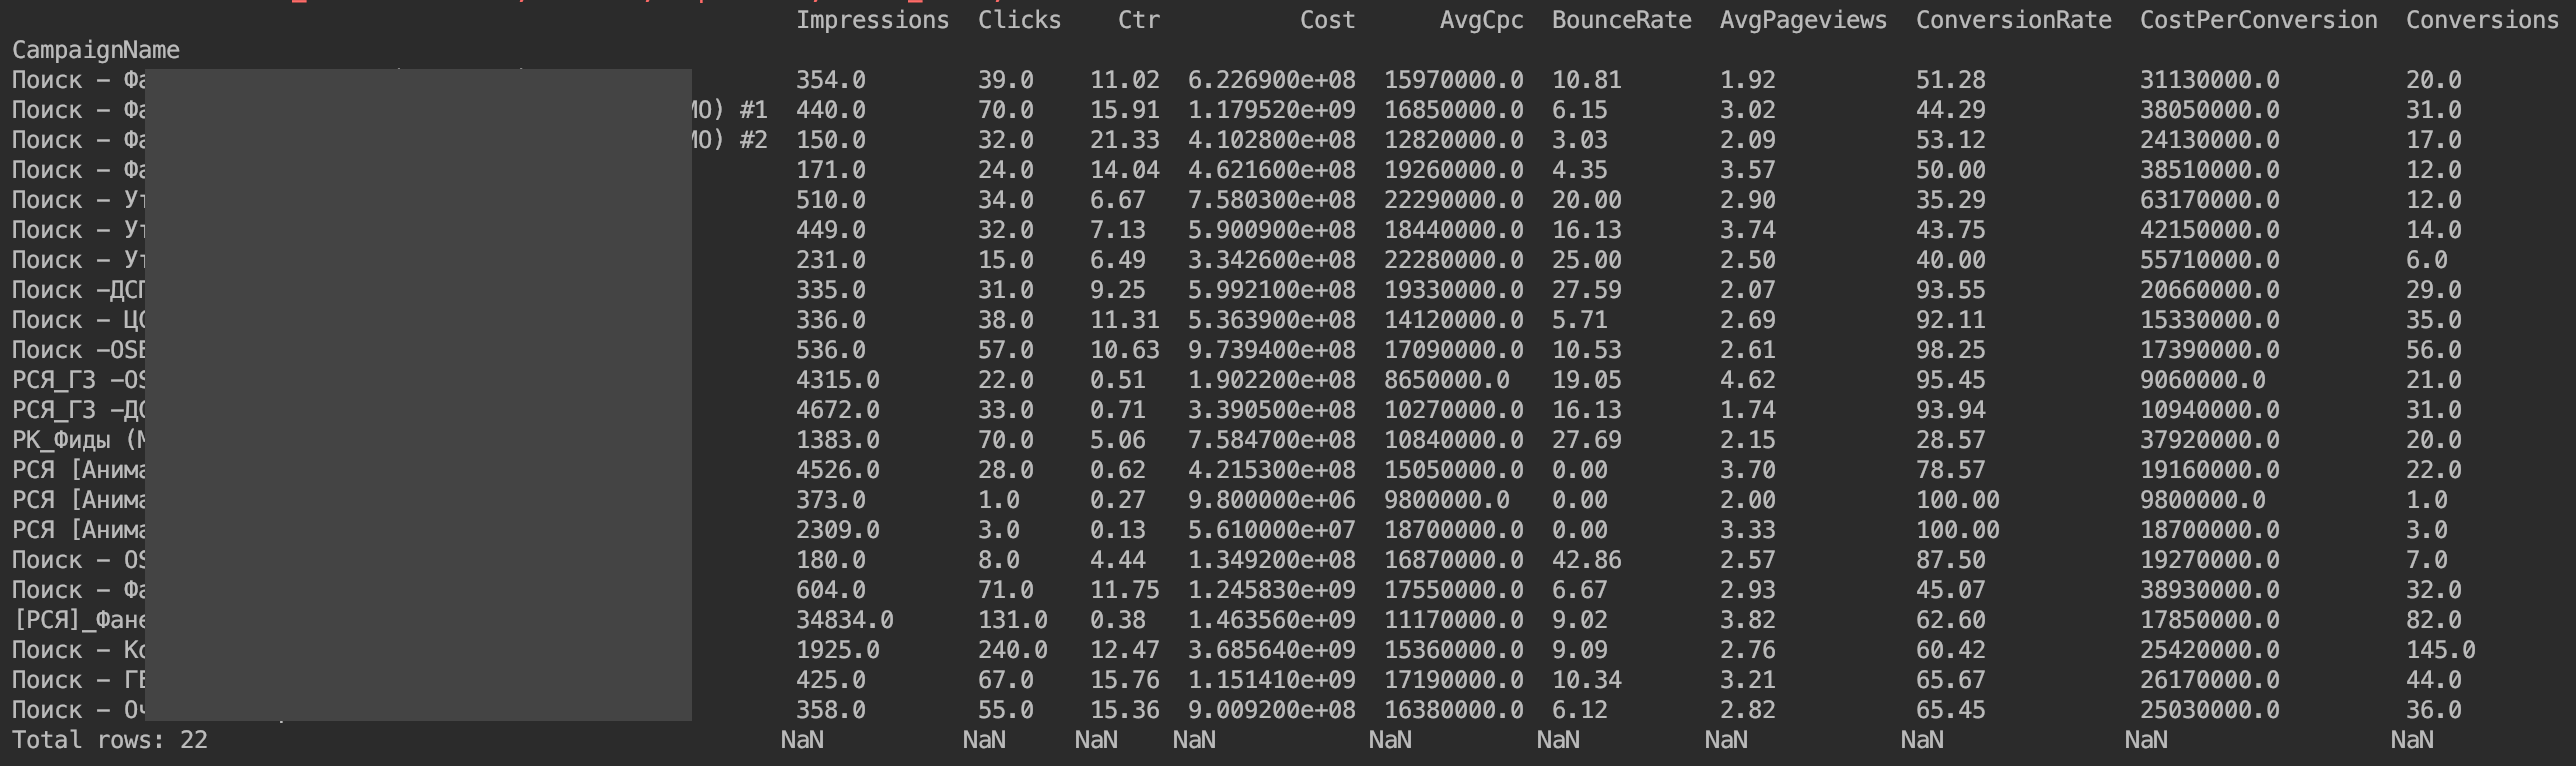
Remove the restriction on the output columns:
Now everything is shown:
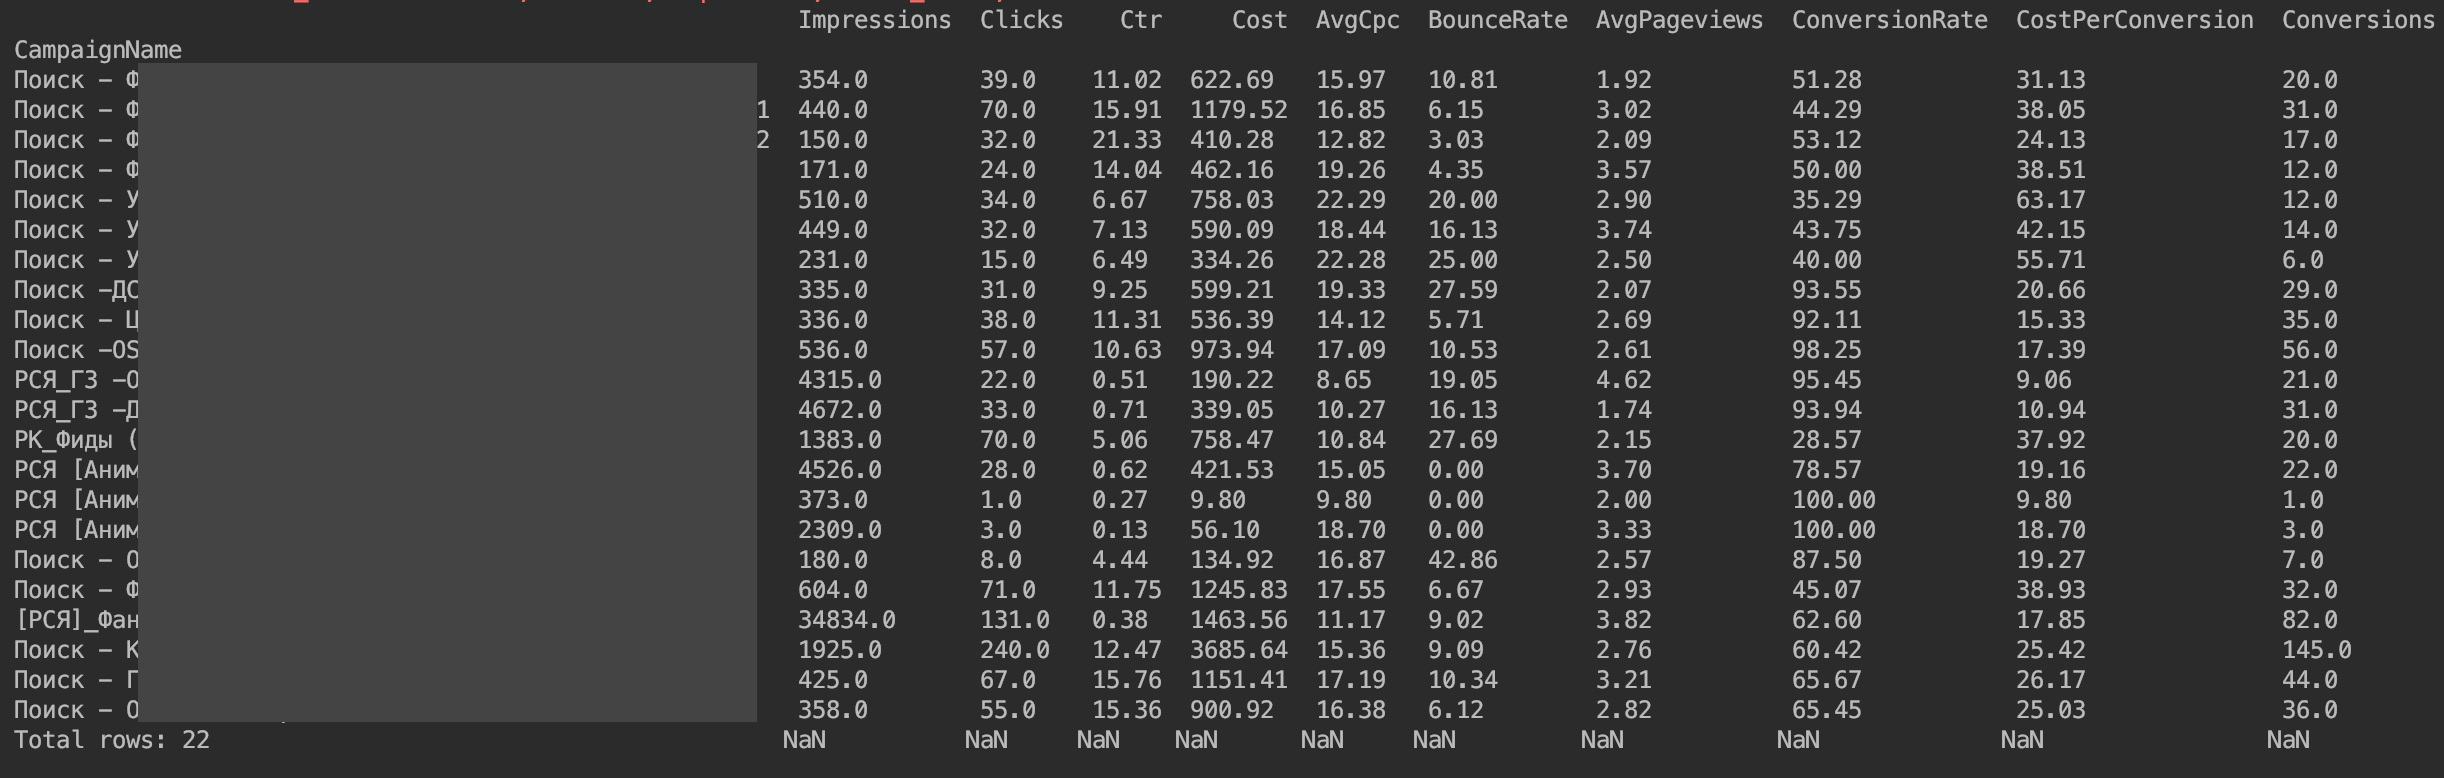
The only problem is that monetary values are not shown as desired. These are features of the implementation of the Yandex Direct API. We just need to divide the cash values by 1,000,000.
I also propose to immediately sort by the number of clicks.
Here we also have a DataFrame ready for analysis.
I wrote similar requests for myself to get statistics in the context of days and campaigns in order to always be aware of traffic deviations and to understand where the deviation occurred approximately.
Thanks for attention.
In this article I will talk about how to monitor advertising accounts using API and Python.
At the output, we will receive a request to the Yandex Direct API, with which we will receive statistics on advertising campaigns and will be able to process this data.
')
For this we need:
- Get the Yandex Direct API token
- Write a request to the server
- Import Data to DataFrame
Import Libraries
You need to import the libraries that are used in the query, as well as the “pandas” and “DataFrame”.
All imports will look like this:
import requests from requests.exceptions import ConnectionError from time import sleep import json import pandas as pd import numpy as np from pandas import Series,DataFrame Getting a token
This time I can’t tell better about the Direct API API documentation, so I’ll leave a link.
( Instructions for obtaining a token )
We write a request to the server API Yandex Direct
We copy request from the API documentation
Change the query.
- Register your token and login
Token.
token = 'blaBlaBLAblaBLABLABLAblabla'
Login.
clientLogin = 'e-66666666'
- Adjust the body of the request for themselves.
From this
body = { "params": { "SelectionCriteria": { "DateFrom": "_", "DateTo": "_" }, "FieldNames": [ "Date", "CampaignName", "LocationOfPresenceName", "Impressions", "Clicks", "Cost" ], "ReportName": u("_"), "ReportType": "CAMPAIGN_PERFORMANCE_REPORT", "DateRangeType": "CUSTOM_DATE", "Format": "TSV", "IncludeVAT": "NO", "IncludeDiscount": "NO" Do it
body = { "params": { "SelectionCriteria": { "Filter": [ { "Field": "Clicks", "Operator": "GREATER_THAN", "Values": [ "0" ] }, ] }, "FieldNames": [ "CampaignName", "Impressions", "Clicks", "Ctr", "Cost", "AvgCpc", "BounceRate", "AvgPageviews", "ConversionRate", "CostPerConversion", "Conversions" ], "ReportName": u("Report4"), "ReportType": « ", "DateRangeType": "LAST_5_DAYS", "Format": "TSV", "IncludeVAT": "NO", "IncludeDiscount": "NO" } } In SelectionCriteria, we write how we will select data. As a standard, 2 dates are written there, but in order not to constantly change them, we will replace the length of time with “Last 5 days”.
We set the filter for data . This is primarily required in order not to get empty values. The problem is that Direct shows the missing data as two minuses, because of which the data type of the entire column changes, after which you will not be able to perform mathematical operations without unnecessary gestures.
FieldNames. Register here the data that you need. I registered the fields that I use for analysis, your list may differ.
ReportType . This type of report is written in this field, for campaigns you need this particular report.
You should have something like this.
5. Import the data into the DataFrame.
(DataFrame is probably the most suitable way to work with this data.)
I was able to implement this function by writing and reading the csv file.
We find in the request a piece that is responsible for displaying statistics - this is “req.text”.
Remove the standard output of the program to write to the file. To do this, change all the conclusions in code 200.
print(" ") print("RequestId: {}".format(req.headers.get("RequestId", False))) print(" : \n{}».format(u(req.text))) On:
format(u(req.text)) Now we import the server response into the DataFrame.
file = open("cashe.csv", "w") file.write(req.text) file.close() f = DataFrame.from_csv("cashe.csv",header=1, sep=' ', index_col=0,) Step by Step:
- Open (and automatically create) the cashe.csv file to write
- Write the server response to it.
- Close the file
- Open the file as a DataFrame (specify the name of the file, which row contains the table headers, which divider between the data, which column the index)
It turned out the following:
Remove the restriction on the output columns:
pd.set_option('display.max_columns', None) pd.set_option('display.expand_frame_repr', False) pd.set_option('max_colwidth', -1) Now everything is shown:
The only problem is that monetary values are not shown as desired. These are features of the implementation of the Yandex Direct API. We just need to divide the cash values by 1,000,000.
f['Cost'] = f['Cost']/1000000 f['AvgCpc'] = f['AvgCpc']/1000000 f['CostPerConversion'] = f['CostPerConversion']/1000000 I also propose to immediately sort by the number of clicks.
f=f.sort_values(by=['Clicks'], ascending=False) Here we also have a DataFrame ready for analysis.
I wrote similar requests for myself to get statistics in the context of days and campaigns in order to always be aware of traffic deviations and to understand where the deviation occurred approximately.
Thanks for attention.
End Code:
import requests from requests.exceptions import ConnectionError from time import sleep import json import pandas as pd import numpy as np from pandas import Series,DataFrame pd.set_option('display.max_columns', None) pd.set_option('display.expand_frame_repr', False) pd.set_option('max_colwidth', -1) # UTF-8 Python 3, Python 2 import sys if sys.version_info < (3,): def u(x): try: return x.encode("utf8") except UnicodeDecodeError: return x else: def u(x): if type(x) == type(b''): return x.decode('utf8') else: return x # --- --- # Reports JSON- () ReportsURL = 'https://api.direct.yandex.com/json/v5/reports' # OAuth- , token = ' ' # # , clientLogin = ' ' # --- --- # HTTP- headers = { # OAuth-. Bearer "Authorization": "Bearer " + token, # "Client-Login": clientLogin, # "Accept-Language": "ru", # "processingMode": "auto" # # "returnMoneyInMicros": "false", # # "skipReportHeader": "true", # # "skipColumnHeader": "true", # # "skipReportSummary": "true" } # body = { "params": { "SelectionCriteria": { "Filter": [ { "Field": "Clicks", "Operator": "GREATER_THAN", "Values": [ "0" ] }, ] }, "FieldNames": [ "CampaignName", "Impressions", "Clicks", "Ctr", "Cost", "AvgCpc", "BounceRate", "AvgPageviews", "ConversionRate", "CostPerConversion", "Conversions" ], "ReportName": u("Report4"), "ReportType": "CAMPAIGN_PERFORMANCE_REPORT", "DateRangeType": "LAST_5_DAYS", "Format": "TSV", "IncludeVAT": "NO", "IncludeDiscount": "NO" } } # JSON body = json.dumps(body, indent=4) # --- --- # HTTP- 200, # HTTP- 201 202, while True: try: req = requests.post(ReportsURL, body, headers=headers) req.encoding = 'utf-8' # UTF-8 if req.status_code == 400: print(" ") print("RequestId: {}".format(req.headers.get("RequestId", False))) print("JSON- : {}".format(u(body))) print("JSON- : \n{}".format(u(req.json()))) break elif req.status_code == 200: format(u(req.text)) break elif req.status_code == 201: print(" ") retryIn = int(req.headers.get("retryIn", 60)) print(" {} ".format(retryIn)) print("RequestId: {}".format(req.headers.get("RequestId", False))) sleep(retryIn) elif req.status_code == 202: print(" ") retryIn = int(req.headers.get("retryIn", 60)) print(" {} ".format(retryIn)) print("RequestId: {}".format(req.headers.get("RequestId", False))) sleep(retryIn) elif req.status_code == 500: print(" . , ") print("RequestId: {}".format(req.headers.get("RequestId", False))) print("JSON- : \n{}".format(u(req.json()))) break elif req.status_code == 502: print(" .") print(", - .") print("JSON- : {}".format(body)) print("RequestId: {}".format(req.headers.get("RequestId", False))) print("JSON- : \n{}".format(u(req.json()))) break else: print(" ") print("RequestId: {}".format(req.headers.get("RequestId", False))) print("JSON- : {}".format(body)) print("JSON- : \n{}".format(u(req.json()))) break # , API except ConnectionError: # print(" API") # break # - except: # print(" ") # break file = open("cashe.csv", "w") file.write(req.text) file.close() f = DataFrame.from_csv("cashe.csv",header=1, sep=' ', index_col=0,) f['Cost'] = f['Cost']/1000000 f['AvgCpc'] = f['AvgCpc']/1000000 f['CostPerConversion'] = f['CostPerConversion']/1000000 f=f.sort_values(by=['Clicks'], ascending=False) print(f) Source: https://habr.com/ru/post/445734/
All Articles