Search at a speed of 1 TB / s
TL; DR: Four years ago, I left Google with the idea of a new server monitoring tool. The idea was to combine into one service the usually isolated functions of collecting and analyzing logs, collecting metrics, alerts and a dashboard. One of the principles is that the service should be really fast , providing devops with an easy, interactive, enjoyable job. This requires processing data sets of several gigabytes in a fraction of a second, without going beyond the budget. Existing tools for working with logs are often slow and clumsy, so we are faced with a good task: to competently develop a tool to give users new sensations of work.
This article describes how we in Scalyr solved this problem by applying the methods of the old school, the approach of brute force, eliminating the extra layers and avoiding complex data structures. You can apply these lessons to your own engineering tasks.
Log analysis usually begins with a search: find all messages matching a certain pattern. In Scalyr, there are dozens or hundreds of gigabytes of logs from many servers. Modern approaches, as a rule, involve the construction of some complex data structure that is optimized for search. I, of course, saw this in Google, where they are pretty good at these things. But we stopped at a much more crude approach: linear scanning of logs. And it worked - we provide an interface with the search an order of magnitude faster than the competition (see the animation at the end).
The key insight was that modern processors are really very fast in simple, straightforward operations. This is easy to miss in complex, multi-layered systems that depend on I / O speed and network operations, and such systems are very common today. Thus, we have developed a design that minimizes the number of layers and excess garbage. With multiple processors and servers in parallel, the search speed reaches 1 TB per second.
')
Key findings from this article:
(This article describes the search for data in memory. In most cases, when a user performs a search by logs, Scalyr servers have already cached it. resources).
Traditionally, a search in a large dataset is performed by an index of keywords. For server logs, this means searching for each unique word in the log. For each word you need to make a list of all inclusions. This makes it easy to find all the messages with this word, for example, 'error', 'firefox' or "transaction_16851951" - just look in the index.
I used this approach in Google, and it worked well. But in Scalyr we are looking for byte by byte logs.
Why? From an abstract algorithmic point of view, keyword indexes are much more efficient than a coarse search. However, we do not sell algorithms, we sell performance. And performance is not only algorithms, but also system engineering. We have to take everything into account: the amount of data, the type of search, the available hardware, and the software context. We decided that for our particular problem, an option like 'grep' is better suited than an index.
Indexes are great, but they have limitations. One word is easy to find. Finding messages with a few words, such as 'googlebot' and '404', is much more difficult. Searching for a phrase like 'uncaught exception' requires a more cumbersome index, which registers not only all the messages with this word, but also the specific location of the word.
The real difficulty arises when you are not looking for words. Suppose you want to see how much traffic comes from bots. The first thought is a search in the logs for the word 'bot'. So you will find some bots: Googlebot, Bingbot and many others. But here 'bot' is not a word, but part of it. If we search for 'bot' in the index, we will not find messages with the word 'Googlebot'. If you check each word in the index and then scan the index for the keywords found, the search will slow down greatly. As a result, some programs for working with logs do not allow searching by parts of a word or (at best) allow using a special syntax with lower performance. We want to avoid this.
Another problem is punctuation. Want to find all requests from
Finally, engineers love powerful tools, and sometimes a problem can be solved only by a regular expression. Keyword index is not very suitable for this.
In addition, indexes are complex . Each message needs to be added to multiple keyword lists. These lists should always be kept in a searchable format. Queries with phrases, fragments of words or regular expressions should be translated into operations with several lists, and the results should be scanned and merged to obtain a result set. In the context of a large-scale multi-user service, such complexity creates performance problems that are not visible when analyzing algorithms.
Keyword indices also take up a lot of space, and storage is the main expense item in the log management system.
On the other hand, you can spend a lot of computing power on each search. Our users value high-speed search for unique queries, but such queries are relatively rare. For typical search queries, for example, for the dashboard, we use special techniques (we will describe them in the next article). Other requests are rare, so rarely do you have to process more than one at a time. But this does not mean that our servers are not busy: they are loaded with work on receiving, analyzing and compressing new messages, evaluating alerts, compressing old data, and so on. Thus, we have a fairly substantial stock of processors that can be used to fulfill requests.
Brute force works best on simple tasks with small internal cycles. Often you can optimize the inner loop for very high speeds. If the code is complex, it is much more difficult to optimize it.
Initially, our search code had a rather large inner loop. We store messages on 4K pages; Each page contains some messages (in UTF-8) and metadata for each message. Metadata is a structure in which the length of the value, the internal message ID, and other fields are encoded. The search cycle looked like this:
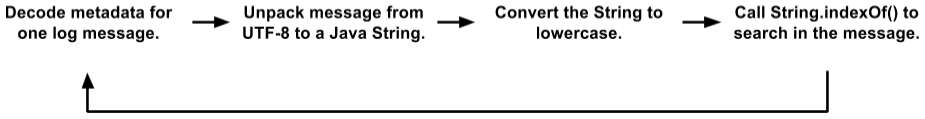
This is a simplified version compared to the actual code. But even here you can see several object locations, copies of data, and function calls. The JVM optimizes function calls fairly well and allocates ephemeral objects, so this code worked better than we deserved. During testing, clients used it quite successfully. But in the end we moved to a new level.
(You may ask why we store messages in such a format with 4K pages, text and metadata, rather than working directly with logs. There are many reasons that boil down to the internal Scalyr engine more like a distributed database than file system. Text search is often combined with DBMS-style filters in the fields after log parsing. We can simultaneously search for many thousands of logs at the same time, and simple text files are not suitable for our transactional, replicated, distributed control data).
Initially, it seemed that such a code was not very suitable for optimization under the brute force method. The “real work” in
It so happened that we store metadata at the beginning of each page, and the text of all messages in UTF-8 is packed at the other end. Taking advantage of this, we rewrote the cycle to search right across the page:

This version works directly on the
It is much easier to optimize for the brute force method. The internal search cycle is called simultaneously for the entire 4K page, and not separately for each message. There is no copying data or selection of objects. And more complex operations with metadata are invoked only with a positive result, and not for each message. Thus, we have eliminated a ton of overhead, and the remaining workload is concentrated in a small internal search cycle, which is well suited for further optimization.
Our actual search algorithm is based on Leonid Volnitsky's great idea . It is similar to the Boyer-Moore algorithm with a gap of approximately the length of the search string at each step. The main difference is that it checks two bytes at a time to minimize false matches.
Our implementation requires creating a 64K lookup table for each search, but this is nothing compared to the gigabytes of data we are looking for. The internal loop processes several gigabytes per second on a single core. In practice, stable performance is about 1.25 GB per second on each core, and there is room for improvement. You can eliminate some of the overhead outside the inner loop, and we plan to experiment with the inner loop in C instead of Java.
We discussed that the search by logs can be implemented “roughly”, but how much “power” do we have? A lot.
1 core : when used correctly, one core of a modern processor is quite powerful in itself.
8 cores : we are currently working on Amazon hi1.4xlarge and i2.4xlarge SSD servers, each with 8 cores (16 threads). As mentioned above, these kernels are usually occupied by background operations. When the user performs a search, the background operations are suspended, freeing up all 8 cores for the search. The search is usually completed in a split second, after which background work resumes (the program-controller ensures that a barrage of search queries does not interfere with important background work).
16 cores : for reliability, we organize servers into master / slave groups. Each master submits one SSD server and one EBS. If the main server crashes, the server on the SSD immediately takes its place. Almost all the time, master and slave work fine, so each data block is searchable on two different servers (the slave EBS server has a weak processor, so we do not consider it). We divide the task between them, so we have a total of 16 cores available.
Many cores : in the near future, we will distribute data across servers in such a way that they all participate in the processing of each non-trivial request. Each core will work. [Note: we implemented the plan and increased the search speed to 1 TB / s, see the note at the end of the article ].
Another advantage of the brute force method is fairly stable performance. As a rule, the search is not very sensitive to the details of the task and the data set (I think this is why it is called “rough”).
The keyword index sometimes gives an incredibly fast result, but in other cases it does not. Suppose you have 50 GB of logs in which the term 'customer_5987235982' occurs exactly three times. A search on this term counts three locations directly from the index and will end instantly. But a complex wildcard search can scan thousands of keywords and take a long time.
On the other hand, the brute force search for any query is performed at more or less the same speed. The search for long words is better, but even the search for one character is quite fast.
The simplicity of the brute force method means that its performance is close to the theoretical maximum. There are fewer options for unexpected disk overload, lock contention, pointer chase, and thousands of other reasons for crashes. I just looked at the requests made by Scalyr users last week on our busiest server. There were 14,000 requests. Exactly eight of them took more than one second; 99% completed within 111 milliseconds (if you didn’t use the log analysis tools, believe me: this is fast ).
Stable, reliable performance is important for service usability. If it periodically slows down, users will perceive it as unreliable and reluctant to use.
Here is a small animation that shows the Scalyr search in action. We have a demo account where we import every event in every public Github repository. In this demonstration, I study the data for the week: approximately 600 MB of raw logs.
The video was recorded live, without special training, on my desktop (about 5000 kilometers from the server). The performance you see is largely due to the optimization of the web client , as well as the fast and reliable backend. Whenever there is a pause without the 'loading' indicator, I pause so that you can read what I’m about to click.

When processing large amounts of data, it is important to choose a good algorithm, but “good” does not mean “fancy”. Think about how your code will work in practice. From the theoretical analysis of algorithms, some factors that may be of great importance in the real world fall out. Simpler algorithms are easier to optimize and more stable in borderline situations.
Also think about the context in which the code will run. In our case, we need powerful enough servers to manage background tasks. Users rarely initiate a search, so we can borrow a whole group of servers for the short period necessary to complete each search.
Using the brute force method, we implemented a fast, reliable, flexible search for a set of logs. We hope that these ideas will be useful for your projects.
Edit: The title and text changed from “Search at 20 GB per second” to “Search at 1 TB per second” to reflect an increase in performance over the past few years. This increase in speed is primarily due to the change in the type and number of EC2 servers that we are raising today to serve the increased client base. Changes are expected in the near future, which will provide another sharp increase in work efficiency, and we are looking forward to the opportunity to talk about it.
This article describes how we in Scalyr solved this problem by applying the methods of the old school, the approach of brute force, eliminating the extra layers and avoiding complex data structures. You can apply these lessons to your own engineering tasks.
The power of the old school
Log analysis usually begins with a search: find all messages matching a certain pattern. In Scalyr, there are dozens or hundreds of gigabytes of logs from many servers. Modern approaches, as a rule, involve the construction of some complex data structure that is optimized for search. I, of course, saw this in Google, where they are pretty good at these things. But we stopped at a much more crude approach: linear scanning of logs. And it worked - we provide an interface with the search an order of magnitude faster than the competition (see the animation at the end).
The key insight was that modern processors are really very fast in simple, straightforward operations. This is easy to miss in complex, multi-layered systems that depend on I / O speed and network operations, and such systems are very common today. Thus, we have developed a design that minimizes the number of layers and excess garbage. With multiple processors and servers in parallel, the search speed reaches 1 TB per second.
')
Key findings from this article:
- Rough search is a viable approach to solving real, large-scale problems.
- Brute force is a design technique, not a release from work. Like any technique, it is better suited for some problems than for others, and it can be implemented poorly or well.
- Brute force is especially good for stable performance.
- Efficient use of brute force requires code optimization and the timely use of sufficient resources. It is suitable if your servers are under heavy load, not user-related, and user operations remain in priority.
- Performance depends on the design of the entire system, and not only on the internal loop algorithm.
(This article describes the search for data in memory. In most cases, when a user performs a search by logs, Scalyr servers have already cached it. resources).
Brute force method
Traditionally, a search in a large dataset is performed by an index of keywords. For server logs, this means searching for each unique word in the log. For each word you need to make a list of all inclusions. This makes it easy to find all the messages with this word, for example, 'error', 'firefox' or "transaction_16851951" - just look in the index.
I used this approach in Google, and it worked well. But in Scalyr we are looking for byte by byte logs.
Why? From an abstract algorithmic point of view, keyword indexes are much more efficient than a coarse search. However, we do not sell algorithms, we sell performance. And performance is not only algorithms, but also system engineering. We have to take everything into account: the amount of data, the type of search, the available hardware, and the software context. We decided that for our particular problem, an option like 'grep' is better suited than an index.
Indexes are great, but they have limitations. One word is easy to find. Finding messages with a few words, such as 'googlebot' and '404', is much more difficult. Searching for a phrase like 'uncaught exception' requires a more cumbersome index, which registers not only all the messages with this word, but also the specific location of the word.
The real difficulty arises when you are not looking for words. Suppose you want to see how much traffic comes from bots. The first thought is a search in the logs for the word 'bot'. So you will find some bots: Googlebot, Bingbot and many others. But here 'bot' is not a word, but part of it. If we search for 'bot' in the index, we will not find messages with the word 'Googlebot'. If you check each word in the index and then scan the index for the keywords found, the search will slow down greatly. As a result, some programs for working with logs do not allow searching by parts of a word or (at best) allow using a special syntax with lower performance. We want to avoid this.
Another problem is punctuation. Want to find all requests from
50.168.29.7 ? What about debugging logs that contain [error] ? Indices usually miss punctuation.Finally, engineers love powerful tools, and sometimes a problem can be solved only by a regular expression. Keyword index is not very suitable for this.
In addition, indexes are complex . Each message needs to be added to multiple keyword lists. These lists should always be kept in a searchable format. Queries with phrases, fragments of words or regular expressions should be translated into operations with several lists, and the results should be scanned and merged to obtain a result set. In the context of a large-scale multi-user service, such complexity creates performance problems that are not visible when analyzing algorithms.
Keyword indices also take up a lot of space, and storage is the main expense item in the log management system.
On the other hand, you can spend a lot of computing power on each search. Our users value high-speed search for unique queries, but such queries are relatively rare. For typical search queries, for example, for the dashboard, we use special techniques (we will describe them in the next article). Other requests are rare, so rarely do you have to process more than one at a time. But this does not mean that our servers are not busy: they are loaded with work on receiving, analyzing and compressing new messages, evaluating alerts, compressing old data, and so on. Thus, we have a fairly substantial stock of processors that can be used to fulfill requests.
Brute force works if you have a brute force (and a lot of power)
Brute force works best on simple tasks with small internal cycles. Often you can optimize the inner loop for very high speeds. If the code is complex, it is much more difficult to optimize it.
Initially, our search code had a rather large inner loop. We store messages on 4K pages; Each page contains some messages (in UTF-8) and metadata for each message. Metadata is a structure in which the length of the value, the internal message ID, and other fields are encoded. The search cycle looked like this:
This is a simplified version compared to the actual code. But even here you can see several object locations, copies of data, and function calls. The JVM optimizes function calls fairly well and allocates ephemeral objects, so this code worked better than we deserved. During testing, clients used it quite successfully. But in the end we moved to a new level.
(You may ask why we store messages in such a format with 4K pages, text and metadata, rather than working directly with logs. There are many reasons that boil down to the internal Scalyr engine more like a distributed database than file system. Text search is often combined with DBMS-style filters in the fields after log parsing. We can simultaneously search for many thousands of logs at the same time, and simple text files are not suitable for our transactional, replicated, distributed control data).
Initially, it seemed that such a code was not very suitable for optimization under the brute force method. The “real work” in
String.indexOf() did not even dominate the CPU profile. That is, the optimization of this method alone would not have had a significant effect.It so happened that we store metadata at the beginning of each page, and the text of all messages in UTF-8 is packed at the other end. Taking advantage of this, we rewrote the cycle to search right across the page:
This version works directly on the
raw byte[] view and searches for all messages on the entire 4K page at once.It is much easier to optimize for the brute force method. The internal search cycle is called simultaneously for the entire 4K page, and not separately for each message. There is no copying data or selection of objects. And more complex operations with metadata are invoked only with a positive result, and not for each message. Thus, we have eliminated a ton of overhead, and the remaining workload is concentrated in a small internal search cycle, which is well suited for further optimization.
Our actual search algorithm is based on Leonid Volnitsky's great idea . It is similar to the Boyer-Moore algorithm with a gap of approximately the length of the search string at each step. The main difference is that it checks two bytes at a time to minimize false matches.
Our implementation requires creating a 64K lookup table for each search, but this is nothing compared to the gigabytes of data we are looking for. The internal loop processes several gigabytes per second on a single core. In practice, stable performance is about 1.25 GB per second on each core, and there is room for improvement. You can eliminate some of the overhead outside the inner loop, and we plan to experiment with the inner loop in C instead of Java.
We use force
We discussed that the search by logs can be implemented “roughly”, but how much “power” do we have? A lot.
1 core : when used correctly, one core of a modern processor is quite powerful in itself.
8 cores : we are currently working on Amazon hi1.4xlarge and i2.4xlarge SSD servers, each with 8 cores (16 threads). As mentioned above, these kernels are usually occupied by background operations. When the user performs a search, the background operations are suspended, freeing up all 8 cores for the search. The search is usually completed in a split second, after which background work resumes (the program-controller ensures that a barrage of search queries does not interfere with important background work).
16 cores : for reliability, we organize servers into master / slave groups. Each master submits one SSD server and one EBS. If the main server crashes, the server on the SSD immediately takes its place. Almost all the time, master and slave work fine, so each data block is searchable on two different servers (the slave EBS server has a weak processor, so we do not consider it). We divide the task between them, so we have a total of 16 cores available.
Many cores : in the near future, we will distribute data across servers in such a way that they all participate in the processing of each non-trivial request. Each core will work. [Note: we implemented the plan and increased the search speed to 1 TB / s, see the note at the end of the article ].
Simplicity provides reliability
Another advantage of the brute force method is fairly stable performance. As a rule, the search is not very sensitive to the details of the task and the data set (I think this is why it is called “rough”).
The keyword index sometimes gives an incredibly fast result, but in other cases it does not. Suppose you have 50 GB of logs in which the term 'customer_5987235982' occurs exactly three times. A search on this term counts three locations directly from the index and will end instantly. But a complex wildcard search can scan thousands of keywords and take a long time.
On the other hand, the brute force search for any query is performed at more or less the same speed. The search for long words is better, but even the search for one character is quite fast.
The simplicity of the brute force method means that its performance is close to the theoretical maximum. There are fewer options for unexpected disk overload, lock contention, pointer chase, and thousands of other reasons for crashes. I just looked at the requests made by Scalyr users last week on our busiest server. There were 14,000 requests. Exactly eight of them took more than one second; 99% completed within 111 milliseconds (if you didn’t use the log analysis tools, believe me: this is fast ).
Stable, reliable performance is important for service usability. If it periodically slows down, users will perceive it as unreliable and reluctant to use.
Search by logs in action
Here is a small animation that shows the Scalyr search in action. We have a demo account where we import every event in every public Github repository. In this demonstration, I study the data for the week: approximately 600 MB of raw logs.
The video was recorded live, without special training, on my desktop (about 5000 kilometers from the server). The performance you see is largely due to the optimization of the web client , as well as the fast and reliable backend. Whenever there is a pause without the 'loading' indicator, I pause so that you can read what I’m about to click.
Finally
When processing large amounts of data, it is important to choose a good algorithm, but “good” does not mean “fancy”. Think about how your code will work in practice. From the theoretical analysis of algorithms, some factors that may be of great importance in the real world fall out. Simpler algorithms are easier to optimize and more stable in borderline situations.
Also think about the context in which the code will run. In our case, we need powerful enough servers to manage background tasks. Users rarely initiate a search, so we can borrow a whole group of servers for the short period necessary to complete each search.
Using the brute force method, we implemented a fast, reliable, flexible search for a set of logs. We hope that these ideas will be useful for your projects.
Edit: The title and text changed from “Search at 20 GB per second” to “Search at 1 TB per second” to reflect an increase in performance over the past few years. This increase in speed is primarily due to the change in the type and number of EC2 servers that we are raising today to serve the increased client base. Changes are expected in the near future, which will provide another sharp increase in work efficiency, and we are looking forward to the opportunity to talk about it.
Source: https://habr.com/ru/post/445456/
All Articles