Buy back / not buy back: our ML-pilot in the "Platypus"
In this post we will talk about the pilot ML-study for the online hypermarket "Platypus", where we predicted the redemption of perishable goods. At the same time, we took into account the data not only on the stock balance, but also the production calendar with weekends and holidays, and even the weather (heat, snow, rain and hail, only for “Three Weather Taft”, but not for buyers). Now we know, for example, that the “mysterious Russian soul” especially longs for meat on Saturdays, and values white eggs above brown ones. But first things first.

The pilot in retail is more than a pilot
In retail, machine learning is in a dual position. On the one hand, retailers have accumulated impressive amounts of data for quite impressive periods of time: individual purchase checks, data from loyalty cards ... On the other, retail has existed so long that demand forecasting began to be solved long before the appearance of data science was in fashion necessary BI tools.
It turns out that retail is one of the most promising fields for datasentists' experiments and introducing machine learning, but business looks at all this with skepticism: is it really good for me? After all, there are already working solutions proven by many years of experience.
And here is the time to agree on a pilot study!
Pilots themselves have clear limitations and specifics compared to a full-fledged ML project.
- Time for a pilot study is spent enough to show customers the possibilities of machine learning on their data, but not so much to go into losses.
- In addition, the second shot at dasasyntistov, as a rule, will not be: if the first results of the business do not seem interesting, then it will retain skepticism and loyalty to the old methods of forecasting. So you need to aim aptly.
- During the pilot project between the customer and datsayntist no trust relationship can appear. And the units and specialists who possess important data for interpretation are most likely not available at the time of the pilot, as well as commercially important insights.
Of course, these features are not manifested in every pilot project, but they constitute an important part of its risks.
A little bit about the task
Long before the introduction to machine learning, Utkonos already used its own analytical system, which predicted the purchase of goods for a week with very high accuracy. Nevertheless, the retailer is interested in the possibility of improving the efficiency of planning. First of all, this concerned perishable products, many of which are also very expensive. Traditional fork: buy a lot - there will be losses, buy enough - the buyer will leave behind his beloved calf tenderloin, harvested under the full moon and slightly drizzling rain, to a competitor. For a reasonably accurate prediction for the day after tomorrow, machine-based solutions are better suited to allow for a larger number of factors to be taken into account than classical BI tools. “Utkonos” agreed to be our partner for an experiment aimed at testing the applicability hypothesis of Machine Learning for e-commerce.
To show the possibilities of machine learning for solving this problem, in agreement with the business, several product names were chosen:
- two products from the category “Chilled Meat” - as perishable products, the data on which it is most important to update promptly;
- and two products from the category "Chicken Egg" - as goods with specific seasonal demand, which cannot be predicted simply as "everyone buys X on Thursday, and multiply X by a factor on Friday". Although chicken eggs are not difficult to predict foreclosures and the weekly planning horizon is quite acceptable for them, it was on these products that they had to show that machine learning really sees complex relationships and builds a non-trivial forecast.
We have already chosen specific goods to our taste, relying on the fullness in historical data. Some goods were introduced into the line rather recently, some - on the contrary, were sold once, but at the moment they were already taken out of the range, so the value of the data on them was only historical.
The data provided by Utkonos contained information on the sales of four product names for the previous 2 years and on the availability of these products in stock during the relevant periods. We immediately “cut off” the last six months from the general data set, from the beginning of November to the end of April - this will be our test set. It includes both relatively quiet autumn months, and a series of winter holidays and spring holidays.
We were expecting a short but fascinating adventure.
Data from warehouses: mysterious and necessary
When working with historical data, the first question that arose before us was how to separate real sales from “maximum available sales” (i.e., cases when the goods that ended up in the warehouse were purchased by 100%, but if available, the sales volume could to be higher)? Such unfulfilled customer desires are not displayed in the data.
Availability of goods in stock. By the way, from the experience of previous projects in retail, we expected that these would be balances expressed in units of measurement. However, in this case we were dealing with a relative indicator of “accessibility”, which was measured as a percentage during the day. As for the presence of goods in stock, this indicator is very relative: the fact that there was no product at some point did not mean that they wanted to buy it.
Having experimented with different variants (reconstruction of “actual demand” on the basis of differently calculated coefficients and filtering data sales with different availability thresholds), we finally picked up the optimal threshold, which did not make the data set too narrow. The ideal - the availability of goods throughout the day - significantly reduced the data even for the best-selling goods.
Item 1: Chilled Meat (Unusual Poultry)
We began to work with chilled meat, as there was no doubt that the model had a predictive ability as soon as it was ready in draft form. (Spoiler: here and in vain - an interesting surprise awaited us in the sale of eggs, but more on that later).
In order to save time out of the box, we got a ready-made library that works well with time series, Prophet from Facebook .

The results of the model on the training data immediately show the advantages and disadvantages. The model well captures the "seasonality" of demand, but poorly - peaks of purchases. Also holidays, wired in Prophet by default. The relative deviation is 31.36%, we will continue to use it as a baseline result.
The built-in seasonal visualization tool that Prophet sees allows you to immediately get a little insight on how the purchases of one of the goods have changed in two years, what are their characteristics during the year and during the week:

Our chilled meat has a clear upward trend in the total number of purchases, the number of purchases grows from Monday to Saturday and falls on Sunday, in the summer purchases noticeably subside. It is bad that summer does not fall into our test period; on the other hand, let us remember that the period of holidays and vacations is important for the level of sales, because summer holidays are not the only ones in Russia.
The logical question is: is it possible to use this model immediately for a forecast for the next six months?
Intuitively, it seems not. The experiment showed that it is. The overall pattern of seasonality during the week is correct. But it immediately became obvious that from the general pattern of seasonality there are a million deviations both up and down, and the average deviation of 45.71% greatly exceeds the results on the training data. It is clear that this is no good.
To begin with, we will try to train the model every day, imagining that every day after the store finishes, datasets are complemented with sales for "today." We already know that in sales there is an uptrend as a whole - it is possible that the turnover on our test data is growing with greater intensity due to more active marketing activity than it was on the training set.
Relative success: with daily additional training of the model, the relative deviation is 33.79%. We supplemented the model parameters with information on postponed weekends, religious posts and holidays traditional for Russia (such as the New Year, Easter and a number of others). Also, sharp weather changes were added: days when the temperature jumped up or down by 10+ degrees or was just noticeably higher or lower than the other days of this month. Now, on average for six months, our forecast deviated from real sales by 28.48%, and on the whole, the model began to take better account of bursts of consumer activity. We improved the average deviation by five percent! Despite the fact that Prophet, in principle, does not work well with emissions, and it is recommended to clear the data from them - this was a noticeable movement forward.


Before showing preliminary results, the question arose: can we improve the forecast a little more? If you look at the correlation of sales of goods and its average price per day - it is clear that these are related signs, and the price is not taken into account when building a model. But judging by the data set, we could only take a certain “average price per unit”: in orders it often varied during the same day, i.e. It was recorded with the personal discount of the buyer, and the “shop-window” prices were not included in the data set.

The correlation coefficient between the average price per unit per day and the number of sold volume of this type of chilled meat was ¬ –0.61 with p <0.01. It is clear that the "average price per unit" is not an ideal indicator: if there were a lot of purchases from, say, partners with a constant big discount during the day, dangerous noises will creep into the data. We wanted to single out the days when there were marketing influences: general discounts for a group of products, discounts for everyone who introduces freely distributed promotional code, etc.
Nevertheless, even after the allocation of days with the average price in the 5% quantile as promotional, no increase in the accuracy of the model did not work out. Increased accuracy in the days of extreme sales, and the average relative deviation for six months remained the same.
But the idea of a pronounced statistical relationship with the price saved for the future.

We were completely satisfied with the preliminary result, it was time to switch to other products before the time allotted for the pilot project ends.
Item 2: chicken egg
We were immediately warned that eggs are one of the most significant product categories in terms of the influence of external events. First of all, the volume of purchases grows on Easter: eggs are painted and are prepared with eggs. But more, of course, color. This is easy to understand by comparing sales of white and brown eggs.

In general, our model expects that there will be some increase in demand on Easter, but its forecast is almost 2 times lower than the real indicator (and this deviation of ~ 100% during Easter week makes the average deviation for half a year incredibly large). Why? After all, Easter week happens every year - there must be a pattern in these previous 2 years!
Research analysis showed that there is no pattern. In 2018 (this is our test data), the peak of purchases falls on the whole week before Easter until April 7. At Easter itself (April 8, 2018), purchases of eggs always fall, which is perfectly correct for the model. But in 2017, Easter falls on April 16, and the peak of purchases in historical data is April 8, and this year the peak is one day. In 2016, Easter falls on May 1st. The peak of purchases is April 29, with rises on the day before and the day after. In 2015, Easter falls on April 12, the peak of shopping again one day, April 9.

Our first version was the influence of the days of the week (and the imagination painted the parents, who need to paint a dozen eggs by tomorrow, because it was a thematic lesson, and the child said this today). Alas, it is not. Probably, during Easter there are some factors that we have not yet found (and have not taken into account) - both external and related to the marketing of the company itself.
We can do better!
This story is about working with the retailer's data in a limited time, and not about secret machine learning techniques. But in working with data there is an opportunity to improve the result.
After working with products from the “Chicken Egg” category, it became clear that the model could be improved by adding factors that we did not use in the pilot project. Therefore, it was decided to conduct a small experiment with a random forest and data that we can collect from open sources. Plus, we will be able to see how the model behaves, where the days of sale will have a versatile set of features, and not just a set of “special days” allocated for various reasons.
The following information was collected in the “outside world” data set:
- full production calendar for each year;
- religious posts and holidays, secular holidays;
- weather conditions and their deviations from the average values for the month in the region, as well as fluctuations during the last month, day and week;
- dollar and euro exchange rates for the Central Bank and their fluctuations as indicators of the overall economic condition.
Separately added were signs of individual marketing campaigns and a unit price.
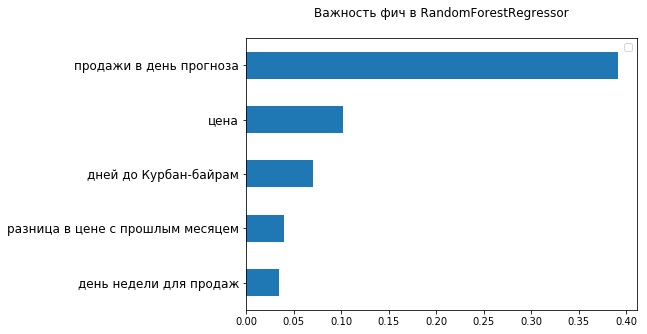
On the extended data set, we again built a model that daily trained on new data, now using RandomForestRegressor. Relative deviation improved slightly: up to 27.29%. The graph shows that the new model better predicts the impact of marketing campaigns, but worse - weekly seasonality.

Looking at the top-5 of the most important signs from the point of view of the used RandomForestRegressor, one can make sure that there are already two signs related to the cost of the goods — the current price and its changes from the previous month. Obviously, the fact that the price range could not be well placed in the FB Prophet, affected its accuracy.
On checking whether we can think a little more and improve the result, the pilot study was completed. The main goals were achieved: we showed that machine learning is in principle applicable for the retailer's data and shows good results even in the “quick start” mode.
Alexandra Tsareva, Jet Intelligence Intelligent Analytics Specialist
')
Source: https://habr.com/ru/post/445190/
All Articles