Errors embedded in the system: their role in statistics
In the last article I indicated how widespread the problem of t-test misuse in scientific publications (and this can only be done due to their openness, and it’s not known what trash is going on when using it in all coursework, reports, teaching tasks, etc.) . To discuss this, I talked about the fundamentals of analysis of variance and the level of significance α given by the researcher himself. But to fully understand the whole picture of statistical analysis, it is necessary to emphasize a number of important things. And the most basic of them is the concept of error.
Any physical system contains any error, inaccuracy. In the most diverse form: the so-called tolerance - the difference in size of different products of the same type; nonlinear characteristic - when a device or method measures something according to a strictly known law within certain limits, and then becomes inapplicable; discreteness - when we are technically unable to ensure the smoothness of the output characteristics.
And at the same time, there is a purely human error - the incorrect use of devices, instruments, mathematical laws. There is a fundamental difference between the error inherent in the system and the error in applying this system. It is important to distinguish and not confuse between these two concepts, called the same word "error". In this article I prefer to use the word “error” to designate the properties of the system, and “incorrect use” for its erroneous use.
')
That is, the ruler error is equal to the tolerance of the equipment that strokes its canvas. And an error in the sense of incorrect application would be to use it when measuring the details of a wristwatch. The error of the balance sheet is written on it and is about 50 grams, and incorrect use of the balance sheet would be weighing a 25 kg bag on it, which stretches the spring from the area of Hooke's law to the area of plastic deformations. The error of an atomic-force microscope comes from its discreteness — it is impossible to “touch” objects with its probe smaller than one atom in diameter. But there are many ways to misuse it or misinterpret data. And so on.
So, what kind of error takes place in statistical methods? And this mistake is precisely the notorious level of significance α.
An error in the mathematical apparatus of statistics is its Bayesian probabilistic essence itself. In the last article, I already mentioned what statistical methods are based on: determining the significance level α as the highest permissible probability to wrongly reject the null hypothesis, and the independent assignment of this value by the researcher to the researcher.
Do you already see this convention? In fact, in criterion methods there is no usual mathematical rigor. Mathematics here operates with probabilistic characteristics.
And here comes another moment, where the wrong interpretation of one word in a different context is possible. It is necessary to distinguish between the very notion of probability and the actual implementation of the event, which is expressed in the probability distribution. For example, before the start of any of our experiments, we do not know what kind of value we will receive as a result. There are two possible outcomes: by making a certain value of the result, we either actually get it, or not. It is logical that the probability of both events is 1/2. But the Gaussian curve shown in the previous article shows the probability distribution of the fact that we correctly guess the coincidence.
This can be illustrated with an example. Let we throw two playing dice 600 times - regular and cheating. We obtain the following results:

Before the experiment for both cubes, the loss of any face will be equally probable - 1/6. However, after the experiment, the essence of the Shulersky cube is revealed, and we can say that the probability density of a six on it is 90%.
Another example that chemists know, physicists, and anyone interested in quantum effects is atomic orbitals. Theoretically, an electron can be “smeared” in space and be located almost anywhere. But in practice there are areas where he will be in 90 percent or more of the cases. These areas of space, formed by a surface with a probability density of 90% electron being there, are classical atomic orbitals, in the form of spheres, dumbbells, etc.
So, independently setting the level of significance, we obviously agree to the mistake described in its name. Because of this, no result can be considered “100% reliable” - our statistical conclusions will always contain some probability of failure.
The error formulated in determining the level of significance α is called the error of the first kind . It can be defined as “false alarm”, or, more correctly, a false positive result. In fact, what do the words “mistakenly reject the null hypothesis” mean? This means, by mistake, to take the observed data as significant differences between the two groups. To make a false diagnosis about the presence of the disease, to hasten to reveal to the world a new discovery, which is not really - these are examples of errors of the first kind.
But then, should there be false-negative results? That's right, and they are called errors of the second kind . Examples are not a timely diagnosis or disappointment as a result of the study, although in fact there are important data in it. Errors of the second kind are denoted by a letter, oddly enough, β. But this concept itself is not so important for statistics as the number 1-β. The number 1-β is called the power of the criterion , and as it is easy to guess, it characterizes the ability of the criterion not to miss a significant event.
However, the content in the statistical methods of errors of the first and second kind is not only their limitation. The very concept of these errors can be used directly in statistical analysis. How?
ROC analysis (from receiver operating characteristic, receiver performance) is a method for quantifying the applicability of a certain attribute to binary classification of objects. Simply put, we can come up with some way to distinguish sick people from healthy, cats from dogs, black from white, and then check the validity of this method. Let's go back to the example.
Let you - a budding criminologist, and develop a new way to covertly and unequivocally determine whether a person is a criminal. You came up with a quantitative trait: to assess the criminal inclinations of people by the frequency of listening to Michael Circle. But will your symptom give adequate results? Let's figure it out.
You will need two groups of people to validate your criteria: ordinary citizens and criminals. Let's set, indeed, the average annual listening time for Michael Circle is different (see figure):
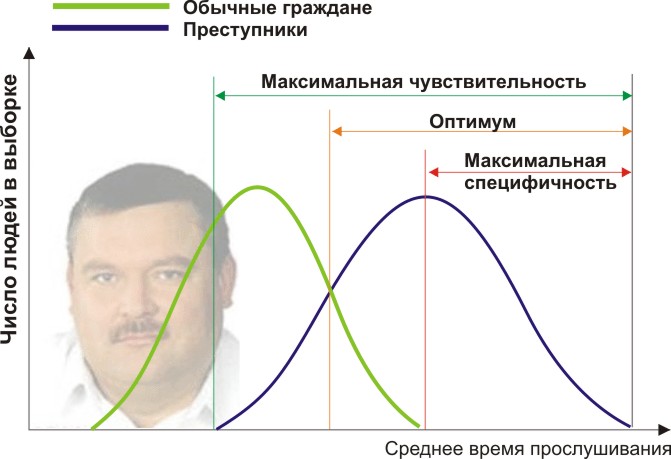
Here we see that, by the quantitative attribute of the listening time, our samples overlap. Someone listens to the Circle spontaneously on the radio without committing crimes, and someone breaks the law, listening to other music or even being deaf. What are our boundary conditions? ROC analysis introduces the concepts of selectivity (sensitivity) and specificity. Sensitivity is defined as the ability to identify all points of interest to us (in this example, the criminals), and specificity — not to capture anything false positive (not to suspect ordinary people). We can set some critical quantitative trait that separates one from the other (orange), ranging from maximum sensitivity (green) to maximum specificity (red).
Let's look at the following scheme:

By shifting the value of our trait, we change the ratio of false positive and false negative results (the area under the curves). Similarly, we can give definitions of Sensitivity = Pos. Res-m / (Position. Res-m + False-negative. Res-m) and Specificity = Neg. cut-t / (Neg. cut-t + false positive. cut-t).
But most importantly, we can estimate the ratio of positive results to false positives on the entire interval of the values of our quantitative trait, which is our desired ROC curve (see figure):

And how do we understand from this chart how good our sign is? Very simple, calculate the area under the curve (AUC, area under curve). The dashed line (0,0; 1,1) means complete coincidence of the two samples and a completely meaningless criterion (the area under the curve is 0.5 of the entire square). But the convexity of the ROC curve just says about the perfection of the criterion. If we manage to find such a criterion that the samples will not intersect at all, then the area under the curve will occupy the entire graph. In general, the sign is considered good, allowing to reliably separate one sample from another, if AUC> 0.75-0.8.
With this analysis you can solve a variety of tasks. Having decided that too many housewives were under suspicion because of Mikhail Krug, and besides that dangerous dangerous recidivists who were listening to Noggano were missed, you can reject this criterion and develop another one.
Having emerged as a method of processing radio signals and identifying "friend or foe" after the attack on Pearl Harbor (hence this strange name for the receiver characteristic), ROC analysis is widely used in biomedical statistics for analyzing, validating, creating and characterizing biomarker panels. etc. It is flexible in use if it is based on sound logic. For example, you can develop indications for medical clinical examination of pensioners-cores, using a highly specific criterion, increasing the efficiency of detecting heart disease and not overloading doctors with unnecessary patients. And during a dangerous epidemic of a previously unknown virus, on the contrary, you can come up with a highly selective criterion so that, in a direct sense, no sneeze will escape from vaccination.
We met with the errors of both kinds and their clarity in the description of validated criteria. Now, moving from these logical foundations, it is possible to destroy a number of false stereotypical descriptions of the results. Some misplaced language captures our minds, often confused by their similar words and concepts, and also because of very little attention paid to misinterpretation. On this, perhaps, you will need to write separately.
Error and incorrect application: what is the difference?
Any physical system contains any error, inaccuracy. In the most diverse form: the so-called tolerance - the difference in size of different products of the same type; nonlinear characteristic - when a device or method measures something according to a strictly known law within certain limits, and then becomes inapplicable; discreteness - when we are technically unable to ensure the smoothness of the output characteristics.
And at the same time, there is a purely human error - the incorrect use of devices, instruments, mathematical laws. There is a fundamental difference between the error inherent in the system and the error in applying this system. It is important to distinguish and not confuse between these two concepts, called the same word "error". In this article I prefer to use the word “error” to designate the properties of the system, and “incorrect use” for its erroneous use.
')
That is, the ruler error is equal to the tolerance of the equipment that strokes its canvas. And an error in the sense of incorrect application would be to use it when measuring the details of a wristwatch. The error of the balance sheet is written on it and is about 50 grams, and incorrect use of the balance sheet would be weighing a 25 kg bag on it, which stretches the spring from the area of Hooke's law to the area of plastic deformations. The error of an atomic-force microscope comes from its discreteness — it is impossible to “touch” objects with its probe smaller than one atom in diameter. But there are many ways to misuse it or misinterpret data. And so on.
So, what kind of error takes place in statistical methods? And this mistake is precisely the notorious level of significance α.
Errors of the first and second kind
An error in the mathematical apparatus of statistics is its Bayesian probabilistic essence itself. In the last article, I already mentioned what statistical methods are based on: determining the significance level α as the highest permissible probability to wrongly reject the null hypothesis, and the independent assignment of this value by the researcher to the researcher.
Do you already see this convention? In fact, in criterion methods there is no usual mathematical rigor. Mathematics here operates with probabilistic characteristics.
And here comes another moment, where the wrong interpretation of one word in a different context is possible. It is necessary to distinguish between the very notion of probability and the actual implementation of the event, which is expressed in the probability distribution. For example, before the start of any of our experiments, we do not know what kind of value we will receive as a result. There are two possible outcomes: by making a certain value of the result, we either actually get it, or not. It is logical that the probability of both events is 1/2. But the Gaussian curve shown in the previous article shows the probability distribution of the fact that we correctly guess the coincidence.
This can be illustrated with an example. Let we throw two playing dice 600 times - regular and cheating. We obtain the following results:
Before the experiment for both cubes, the loss of any face will be equally probable - 1/6. However, after the experiment, the essence of the Shulersky cube is revealed, and we can say that the probability density of a six on it is 90%.
Another example that chemists know, physicists, and anyone interested in quantum effects is atomic orbitals. Theoretically, an electron can be “smeared” in space and be located almost anywhere. But in practice there are areas where he will be in 90 percent or more of the cases. These areas of space, formed by a surface with a probability density of 90% electron being there, are classical atomic orbitals, in the form of spheres, dumbbells, etc.
So, independently setting the level of significance, we obviously agree to the mistake described in its name. Because of this, no result can be considered “100% reliable” - our statistical conclusions will always contain some probability of failure.
The error formulated in determining the level of significance α is called the error of the first kind . It can be defined as “false alarm”, or, more correctly, a false positive result. In fact, what do the words “mistakenly reject the null hypothesis” mean? This means, by mistake, to take the observed data as significant differences between the two groups. To make a false diagnosis about the presence of the disease, to hasten to reveal to the world a new discovery, which is not really - these are examples of errors of the first kind.
But then, should there be false-negative results? That's right, and they are called errors of the second kind . Examples are not a timely diagnosis or disappointment as a result of the study, although in fact there are important data in it. Errors of the second kind are denoted by a letter, oddly enough, β. But this concept itself is not so important for statistics as the number 1-β. The number 1-β is called the power of the criterion , and as it is easy to guess, it characterizes the ability of the criterion not to miss a significant event.
However, the content in the statistical methods of errors of the first and second kind is not only their limitation. The very concept of these errors can be used directly in statistical analysis. How?
ROC analysis
ROC analysis (from receiver operating characteristic, receiver performance) is a method for quantifying the applicability of a certain attribute to binary classification of objects. Simply put, we can come up with some way to distinguish sick people from healthy, cats from dogs, black from white, and then check the validity of this method. Let's go back to the example.
Let you - a budding criminologist, and develop a new way to covertly and unequivocally determine whether a person is a criminal. You came up with a quantitative trait: to assess the criminal inclinations of people by the frequency of listening to Michael Circle. But will your symptom give adequate results? Let's figure it out.
You will need two groups of people to validate your criteria: ordinary citizens and criminals. Let's set, indeed, the average annual listening time for Michael Circle is different (see figure):
Here we see that, by the quantitative attribute of the listening time, our samples overlap. Someone listens to the Circle spontaneously on the radio without committing crimes, and someone breaks the law, listening to other music or even being deaf. What are our boundary conditions? ROC analysis introduces the concepts of selectivity (sensitivity) and specificity. Sensitivity is defined as the ability to identify all points of interest to us (in this example, the criminals), and specificity — not to capture anything false positive (not to suspect ordinary people). We can set some critical quantitative trait that separates one from the other (orange), ranging from maximum sensitivity (green) to maximum specificity (red).
Let's look at the following scheme:
By shifting the value of our trait, we change the ratio of false positive and false negative results (the area under the curves). Similarly, we can give definitions of Sensitivity = Pos. Res-m / (Position. Res-m + False-negative. Res-m) and Specificity = Neg. cut-t / (Neg. cut-t + false positive. cut-t).
But most importantly, we can estimate the ratio of positive results to false positives on the entire interval of the values of our quantitative trait, which is our desired ROC curve (see figure):
And how do we understand from this chart how good our sign is? Very simple, calculate the area under the curve (AUC, area under curve). The dashed line (0,0; 1,1) means complete coincidence of the two samples and a completely meaningless criterion (the area under the curve is 0.5 of the entire square). But the convexity of the ROC curve just says about the perfection of the criterion. If we manage to find such a criterion that the samples will not intersect at all, then the area under the curve will occupy the entire graph. In general, the sign is considered good, allowing to reliably separate one sample from another, if AUC> 0.75-0.8.
With this analysis you can solve a variety of tasks. Having decided that too many housewives were under suspicion because of Mikhail Krug, and besides that dangerous dangerous recidivists who were listening to Noggano were missed, you can reject this criterion and develop another one.
Having emerged as a method of processing radio signals and identifying "friend or foe" after the attack on Pearl Harbor (hence this strange name for the receiver characteristic), ROC analysis is widely used in biomedical statistics for analyzing, validating, creating and characterizing biomarker panels. etc. It is flexible in use if it is based on sound logic. For example, you can develop indications for medical clinical examination of pensioners-cores, using a highly specific criterion, increasing the efficiency of detecting heart disease and not overloading doctors with unnecessary patients. And during a dangerous epidemic of a previously unknown virus, on the contrary, you can come up with a highly selective criterion so that, in a direct sense, no sneeze will escape from vaccination.
We met with the errors of both kinds and their clarity in the description of validated criteria. Now, moving from these logical foundations, it is possible to destroy a number of false stereotypical descriptions of the results. Some misplaced language captures our minds, often confused by their similar words and concepts, and also because of very little attention paid to misinterpretation. On this, perhaps, you will need to write separately.
Source: https://habr.com/ru/post/444992/
All Articles