Automatic Canary Deploy with Flagger and Istio

The CD is recognized as a corporate software practice; it is the result of the natural evolution of the established CI principles. However, CD is still a rather rare phenomenon, possibly due to the complexity of management and the fear of unsuccessful deployments affecting the availability of the system.
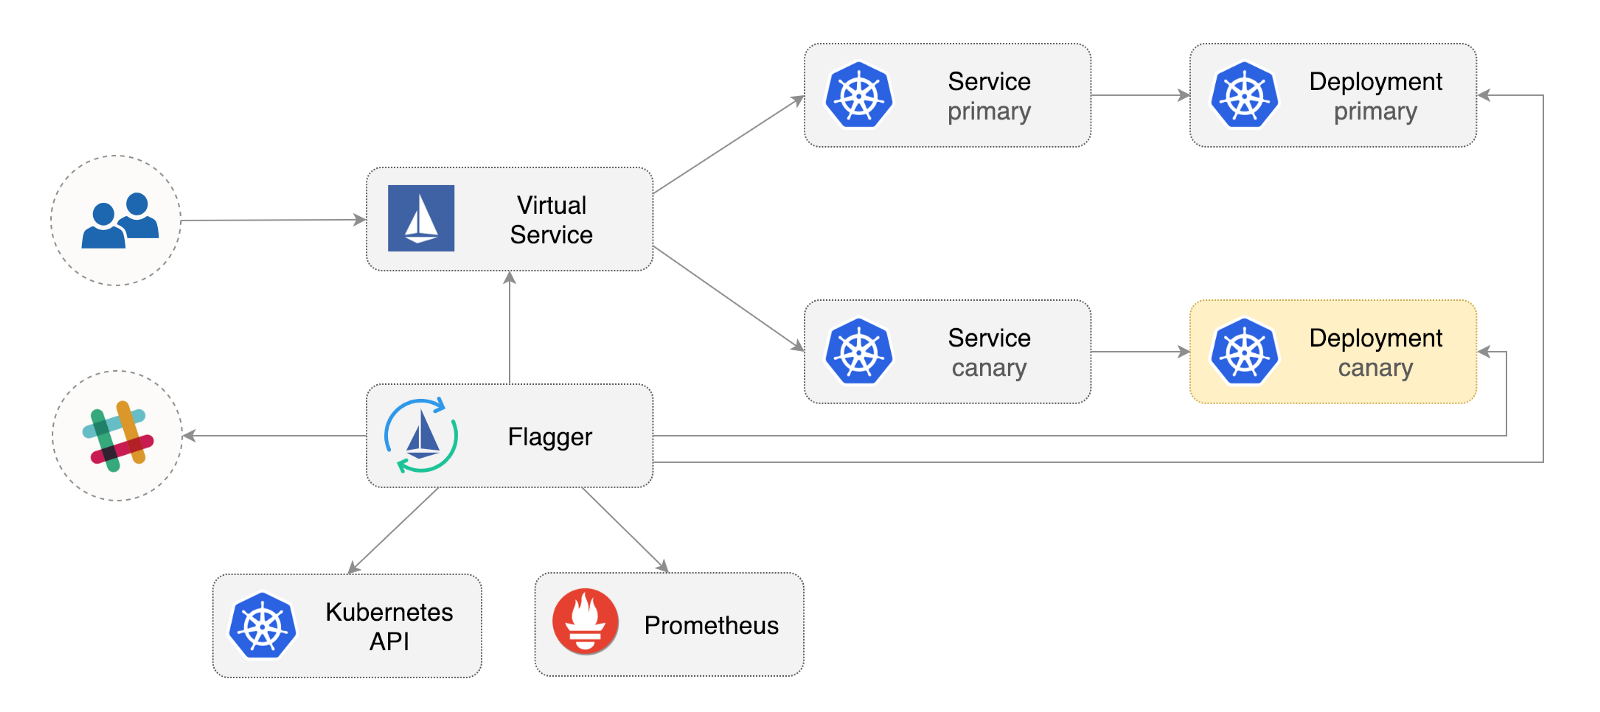
Flagger is an open source Kubernetes operator whose purpose is to eliminate intricate relationships. It automates the promotion of canary deploying using Istio traffic and Prometheus metrics to analyze application behavior during a controlled rollout.
Below is a step-by-step guide to setting up and using Flagger in Google Kubernetes Engine (GKE).
Kubernetes Cluster Setup
You start by creating a GKE cluster with the Istio add-in (if you do not have a GCP account, you can register here - to get free credits).
Sign in to Google Cloud, create a project and enable billing for it. Install the gcloud command line utility and configure your project using gcloud init .
Set the default project, computation area, and zone (replace PROJECT_ID with your project):
gcloud config set project PROJECT_ID gcloud config set compute/region us-central1 gcloud config set compute/zone us-central1-a Enable the GKE service and create a cluster with HPA and Istio add-ins:
gcloud services enable container.googleapis.com K8S_VERSION=$(gcloud beta container get-server-config --format=json | jq -r '.validMasterVersions[0]') gcloud beta container clusters create istio \ --cluster-version=${K8S_VERSION} \ --zone=us-central1-a \ --num-nodes=2 \ --machine-type=n1-standard-2 \ --disk-size=30 \ --enable-autorepair \ --no-enable-cloud-logging \ --no-enable-cloud-monitoring \ --addons=HorizontalPodAutoscaling,Istio \ --istio-config=auth=MTLS_PERMISSIVE The above command will create a default node pool that includes two n1-standard-2 VMs (vCPU: 2, RAM 7.5 GB, disk: 30 GB). Ideally, you should isolate the Istio components from your workloads, but there is no simple way to start Istio bogs in the selected pool of nodes. The Istio manifests are considered read-only, and the GKE will undo any changes, such as binding to a node or detaching from the sub.
Configure credentials for kubectl :
gcloud container clusters get-credentials istio Create a Cluster Administrator role binding:
kubectl create clusterrolebinding "cluster-admin-$(whoami)" \ --clusterrole=cluster-admin \ --user="$(gcloud config get-value core/account)" Install the Helm command line tool:
brew install kubernetes-helm Homebrew 2.0 is now also available for Linux .
Create a service account and bind the cluster role for Tiller:
kubectl -n kube-system create sa tiller && \ kubectl create clusterrolebinding tiller-cluster-rule \ --clusterrole=cluster-admin \ --serviceaccount=kube-system:tiller Deploy Tiller in kube-system :
helm init --service-account tiller You should consider using SSL between Helm and Tiller. For more information on securing a Helm installation, see docs.helm.sh
Confirm the settings:
kubectl -n istio-system get svc After a few seconds, the GCP should assign an external IP address to the istio-ingressgateway .
Setting up an Istio gateway
Create a static IP address called istio-gateway using the istio-gateway IP address:
export GATEWAY_IP=$(kubectl -n istio-system get svc/istio-ingressgateway -ojson | jq -r .status.loadBalancer.ingress[0].ip) gcloud compute addresses create istio-gateway --addresses ${GATEWAY_IP} --region us-central1 Now you need an Internet domain and access to your DNS registrar. Add two A records (replace example.com with your domain):
istio.example.com A ${GATEWAY_IP} *.istio.example.com A ${GATEWAY_IP} Ensure that the wildcard DNS symbol works:
watch host test.istio.example.com Create a common Istio gateway to provide services outside of the service mesh over HTTP:
apiVersion: networking.istio.io/v1alpha3 kind: Gateway metadata: name: public-gateway namespace: istio-system spec: selector: istio: ingressgateway servers: - port: number: 80 name: http protocol: HTTP hosts: - "*" Save the above resource as public-gateway.yaml, and then apply it:
kubectl apply -f ./public-gateway.yaml No production system should provide services on the Internet without SSL. To protect your Istio gateway with cert-manager, CloudDNS and Let's Encrypt, please read the Flagger GKE documentation .
Install flagger
The GKE Istio add-on does not include a copy of Prometheus, which is cleaning the Istio telemetry service. Since Flagger uses Istio HTTP metrics to perform canary analysis, you need to support the following Prometheus configuration, similar to the one that comes with the official Istio Helm schema.
REPO=https://raw.githubusercontent.com/stefanprodan/flagger/master kubectl apply -f ${REPO}/artifacts/gke/istio-prometheus.yaml Add the Flagger Helm repository:
helm repo add flagger [https://flagger.app](https://flagger.app/) Deploy Flagger to the istio-system enabling Slack notifications:
helm upgrade -i flagger flagger/flagger \ --namespace=istio-system \ --set metricsServer=http://prometheus.istio-system:9090 \ --set slack.url=https://hooks.slack.com/services/YOUR-WEBHOOK-ID \ --set slack.channel=general \ --set slack.user=flagger You can install Flagger in any namespace if it can communicate with the Istio Prometheus service via port 9090.
Flagger has a Grafana dashboard for canary analysis. Install Grafana in istio-system :
helm upgrade -i flagger-grafana flagger/grafana \ --namespace=istio-system \ --set url=http://prometheus.istio-system:9090 \ --set user=admin \ --set password=change-me Expand Grafana through an open gateway, creating a virtual service (replace example.com with your domain):
apiVersion: networking.istio.io/v1alpha3 kind: VirtualService metadata: name: grafana namespace: istio-system spec: hosts: - "grafana.istio.example.com" gateways: - public-gateway.istio-system.svc.cluster.local http: - route: - destination: host: flagger-grafana Save the above resource as grafana-virtual-service.yaml, and then apply it:
kubectl apply -f ./grafana-virtual-service.yaml When you go to http://grafana.istio.example.com in your browser, you must be directed to the Grafana login page.
Depla web applications with Flagger
Flagger deploit Kubernetes and, if necessary, horizontal automatic scaling (HPA), then creates a series of objects (Kubernetes deployments, ClusterIP services and Istio virtual services). These objects open the application in a service mesh and manage canary analysis and promotion.
Create a test namespace with Istio Sidecar implementation enabled:
REPO=https://raw.githubusercontent.com/stefanprodan/flagger/master kubectl apply -f ${REPO}/artifacts/namespaces/test.yaml Create a warmup tool and an automatic horizontal scaling tool for poda:
kubectl apply -f ${REPO}/artifacts/canaries/deployment.yaml kubectl apply -f ${REPO}/artifacts/canaries/hpa.yaml Deploy a test load service to generate traffic during canary analysis:
helm upgrade -i flagger-loadtester flagger/loadtester \ --namepace=test Create a custom canary resource (replace example.com with your domain):
apiVersion: flagger.app/v1alpha3 kind: Canary metadata: name: podinfo namespace: test spec: targetRef: apiVersion: apps/v1 kind: Deployment name: podinfo progressDeadlineSeconds: 60 autoscalerRef: apiVersion: autoscaling/v2beta1 kind: HorizontalPodAutoscaler name: podinfo service: port: 9898 gateways: - public-gateway.istio-system.svc.cluster.local hosts: - app.istio.example.com canaryAnalysis: interval: 30s threshold: 10 maxWeight: 50 stepWeight: 5 metrics: - name: istio_requests_total threshold: 99 interval: 30s - name: istio_request_duration_seconds_bucket threshold: 500 interval: 30s webhooks: - name: load-test url: http://flagger-loadtester.test/ timeout: 5s metadata: cmd: "hey -z 1m -q 10 -c 2 http://podinfo.test:9898/" Save the above resource as podinfo-canary.yaml, and then apply it:
kubectl apply -f ./podinfo-canary.yaml The above analysis, if successful, will be performed for five minutes with verification of HTTP metrics every half a minute. You can determine the minimum time required to test and advance the canary deployment using the following formula: interval * (maxWeight / stepWeight) . Canary CRD fields are documented here .
After a couple of seconds, Flagger will create canary objects:
# applied deployment.apps/podinfo horizontalpodautoscaler.autoscaling/podinfo canary.flagger.app/podinfo # generated deployment.apps/podinfo-primary horizontalpodautoscaler.autoscaling/podinfo-primary service/podinfo service/podinfo-canary service/podinfo-primary virtualservice.networking.istio.io/podinfo Open a browser and go to app.istio.example.com , you should see the version number of the demo application .
Automatic canary analysis and promotion
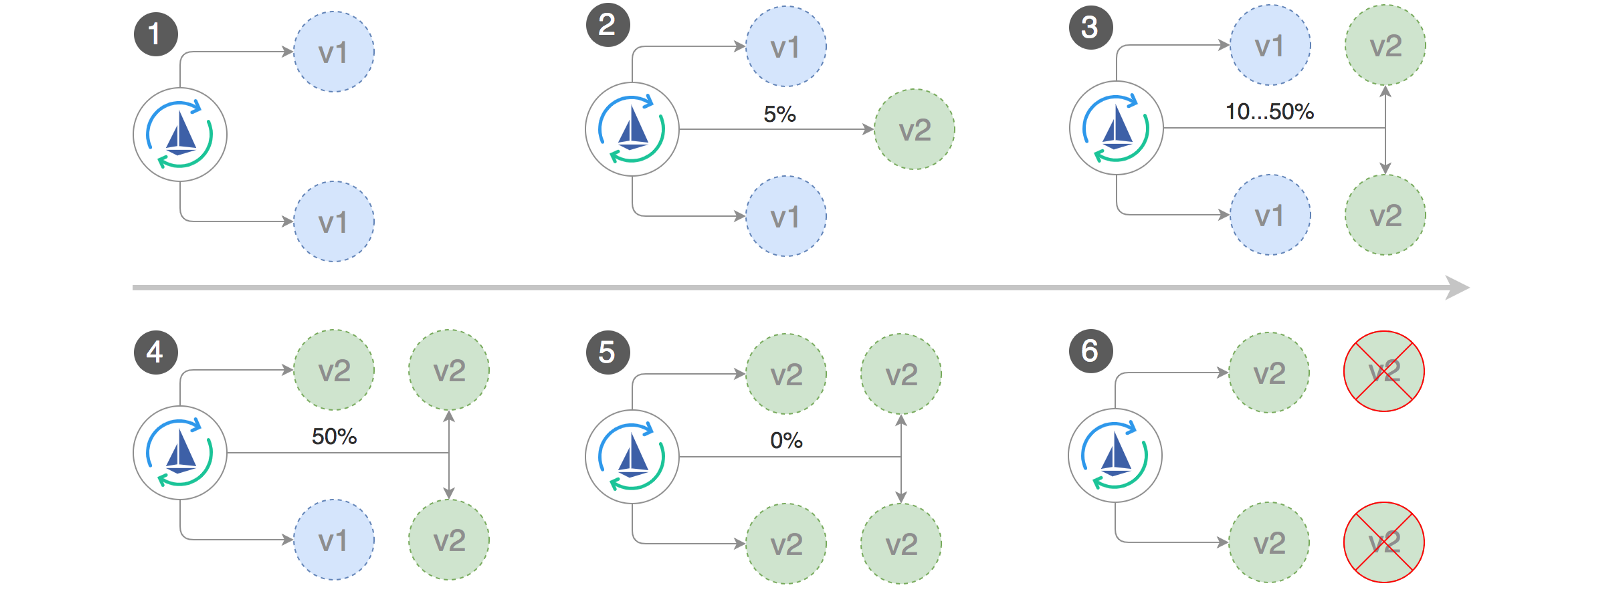
Flagger implements a management cycle that gradually moves traffic to canary, while simultaneously measuring key performance indicators, such as the level of success of HTTP requests, the average duration of requests and the efficiency of the feed. Based on KPI analysis, canary is promoted or interrupted, and analysis results are published in Slack.
Canary deploy runs when one of the following objects changes:
- Depla PodSpec (container image, command, ports, env, etc.)
- ConfigMaps mounted as volumes or converted to environment variables
- Secrets are mounted as volumes or transformed into environment variables.
Running a canary deployment when updating a container image:
kubectl -n test set image deployment/podinfo \ podinfod=quay.io/stefanprodan/podinfo:1.4.1 Flagger discovers that the deployment version has changed and begins to analyze it:
kubectl -n test describe canary/podinfo Events: New revision detected podinfo.test Scaling up podinfo.test Waiting for podinfo.test rollout to finish: 0 of 1 updated replicas are available Advance podinfo.test canary weight 5 Advance podinfo.test canary weight 10 Advance podinfo.test canary weight 15 Advance podinfo.test canary weight 20 Advance podinfo.test canary weight 25 Advance podinfo.test canary weight 30 Advance podinfo.test canary weight 35 Advance podinfo.test canary weight 40 Advance podinfo.test canary weight 45 Advance podinfo.test canary weight 50 Copying podinfo.test template spec to podinfo-primary.test Waiting for podinfo-primary.test rollout to finish: 1 of 2 updated replicas are available Promotion completed! Scaling down podinfo.test During the analysis, canary results can be monitored using Grafana:

Note: if new changes are applied to deployment during the canary analysis, then Flagger will restart the analysis phase.
Make a list of all the canaries in your cluster:
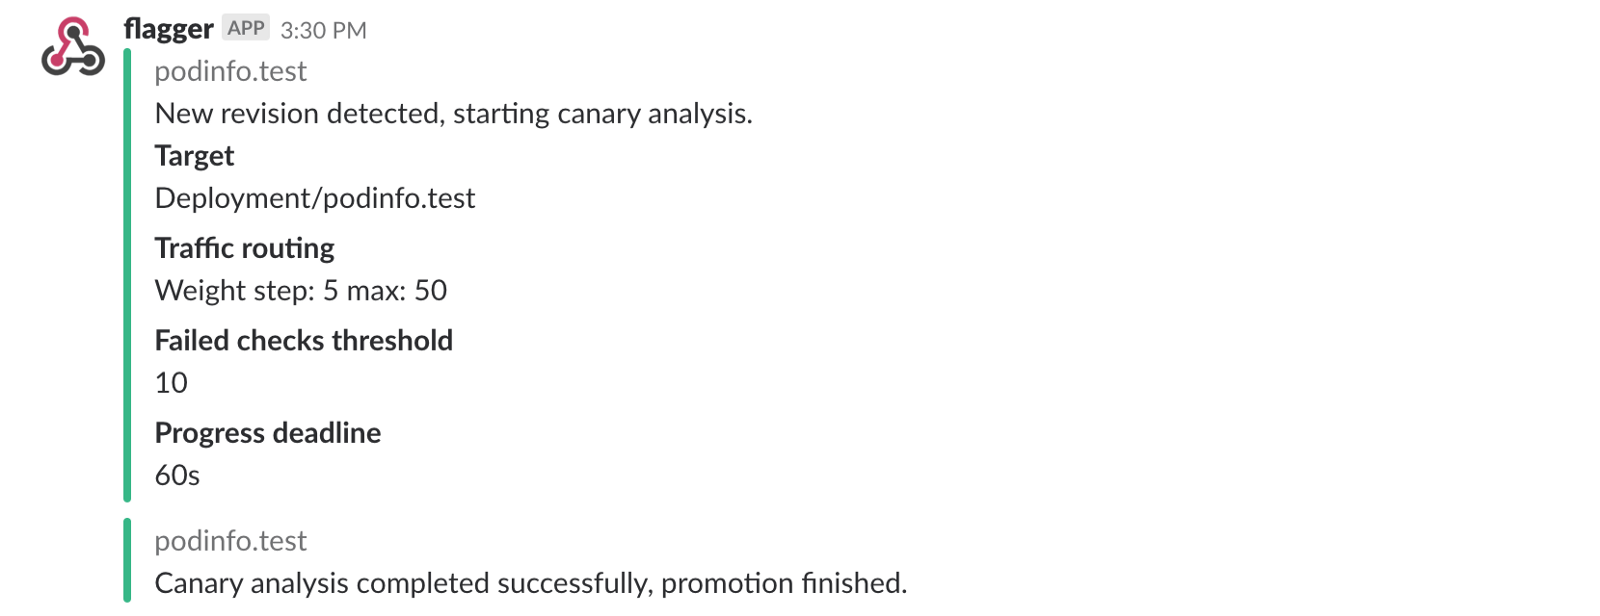
watch kubectl get canaries --all-namespaces NAMESPACE NAME STATUS WEIGHT LASTTRANSITIONTIME test podinfo Progressing 15 2019-01-16T14:05:07Z prod frontend Succeeded 0 2019-01-15T16:15:07Z prod backend Failed 0 2019-01-14T17:05:07Z If you enabled Slack notifications, you will receive the following messages:
Auto Rollback
During the canary analysis, you can generate HTTP HTTP 500 synthetic errors and a high response delay to check if Flagger will not stop deploy.
Create a test sub and perform the following action in it:
kubectl -n test run tester \ --image=quay.io/stefanprodan/podinfo:1.2.1 \ -- ./podinfo --port=9898 kubectl -n test exec -it tester-xx-xx sh HTTP 500 error generation:
watch curl http://podinfo-canary:9898/status/500 Delay generation:
watch curl http://podinfo-canary:9898/delay/1 When the number of unsuccessful checks reaches the threshold, the traffic is sent back to the primary channel, the canary is scaled to zero, and the deployment is marked as unsuccessful.
Canary errors and delay peaks are recorded as Kubernetes events and recorded by Flagger in JSON format:
kubectl -n istio-system logs deployment/flagger -f | jq .msg Starting canary deployment for podinfo.test Advance podinfo.test canary weight 5 Advance podinfo.test canary weight 10 Advance podinfo.test canary weight 15 Halt podinfo.test advancement success rate 69.17% < 99% Halt podinfo.test advancement success rate 61.39% < 99% Halt podinfo.test advancement success rate 55.06% < 99% Halt podinfo.test advancement success rate 47.00% < 99% Halt podinfo.test advancement success rate 37.00% < 99% Halt podinfo.test advancement request duration 1.515s > 500ms Halt podinfo.test advancement request duration 1.600s > 500ms Halt podinfo.test advancement request duration 1.915s > 500ms Halt podinfo.test advancement request duration 2.050s > 500ms Halt podinfo.test advancement request duration 2.515s > 500ms Rolling back podinfo.test failed checks threshold reached 10 Canary failed! Scaling down podinfo.test If you enabled Slack notifications, you will receive a message when the deadline for performing or reaching the maximum number of failed checks during the analysis is exceeded:

Finally
Running a service mesh, such as Istio, in addition to Kubernetes will provide automatic metrics, logs, and protocols, but the deployment of workloads still depends on external tools. Flagger seeks to change this by adding progressive supply capabilities to Istio.
Flagger is compatible with any Kubernetes CI / CD solution, and canary analysis can be easily extended using webchuks to perform system integration / acceptance tests, load tests, or any other user checks. Since Flagger is declarative and responds to Kubernetes events, it can be used in the GitOps pipelines along with Weave Flux or JenkinsX . If you use JenkinsX, you can install Flagger with jx add-ons.
Flagger is supported by Weaveworks and provides canary deployments in Weave Cloud . The project is being tested on GKE, EKS and bare metal with kubeadm.
If you have suggestions for improving Flagger, please send a question or PR to GitHub at stefanprodan / flagger . Contributions are more than welcome!
Thanks Ray Ray .
')
Source: https://habr.com/ru/post/444808/
All Articles