The color of the moon and sun from space in terms of RGB and color temperature
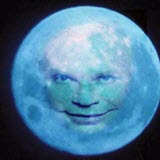 It would seem that the question of the color of the Moon and the Sun from space for modern science is so simple that in our century there should be no problem at all with the answer. We are talking about colors when observing precisely from space, since the atmosphere causes a color change due to Rayleigh light scattering. "Surely somewhere in the encyclopedia about this in detail, in numbers it has long been written," you will say. Well, now try searching the Internet for information about it. Happened? Most likely no. The maximum that you will find is a couple of words about the fact that the moon has a brownish tint, and the sun is reddish. But you will not find information about whether these shades are visible to the human eye or not, especially the meanings of colors in RGB or at least color temperatures. But you will find a bunch of photos and videos where the Moon from space is absolutely gray, mostly in photos of the American Apollo program, and where the Sun from space is depicted white and even blue.
Especially my personal opinion is nothing but a consequence of the intervention of politics in science. After all, the colors of the moon and sun from space directly relate to the flights of Americans to the moon.
I searched through many scientific articles and books in search of information about the color of the Moon and the Sun from space. Fortunately, it turned out that even though they do not have a direct answer to RGB, there is complete information about the spectral density of the solar radiation and the reflectivity of the moon across the spectrum. This is quite enough to get accurate colors in RGB values. You just need to carefully calculate what, in fact, I did. In this article I will share the results of calculations with you and, of course, I will tell you in detail about the calculations themselves. And you will see the Moon and the Sun from space in real colors!
I carried out the calculations in the Mathcad program and, accordingly, the code fragments will be in the built-in programming language, which is quite suitable as understandable for all pseudo-code.
')
At the same time I will tell you in detail what is the RGB color model, with which, I think, you are all familiar. This question is also not entirely simple. For example, try to answer the following two questions. Let the color be set to
- What values of RGB has a color that is 2 times darker than the specified?
- What are the values of RGB in gray with the same brightness as the specified?
It would seem that there is thinking, divided by 2 in the first case, i.e. rgb (60,40,50) and averaged in the second case, i.e.
Also talk about the color temperature and how to calculate it.
XYZ color space
XYZ is a reference color model, defined in the strict mathematical sense by the CIE (International Commission on Illumination) International Organization for Illumination in 1931. Model CIE XYZ is a master model of almost all other color models used in technical areas. XYZ color is set as follows:
$$ display $$ X = \ int _ {390 \, nm} ^ {830 \, nm} I (\ lambda) \, {\ overline {x}} (\ lambda) \, d \ lambda \\ Y = \ int _ {390 \, nm} ^ {830 \, nm} I (\ lambda) \, {\ overline {y}} (\ lambda) \, d \ lambda \\ Z = \ int _ {390 \, nm} ^ {830 \, nm} I (\ lambda) \, {\ overline {z}} (\ lambda) \, d \ lambda $$ display $$
Where $ inline $ I (\ lambda) $ inline $ - the spectral density of any energy photometric value (for example, radiation flux, energy brightness, etc., in absolute or relative terms) over the wavelength range from 390 to
I downloaded these color matching functions from here:
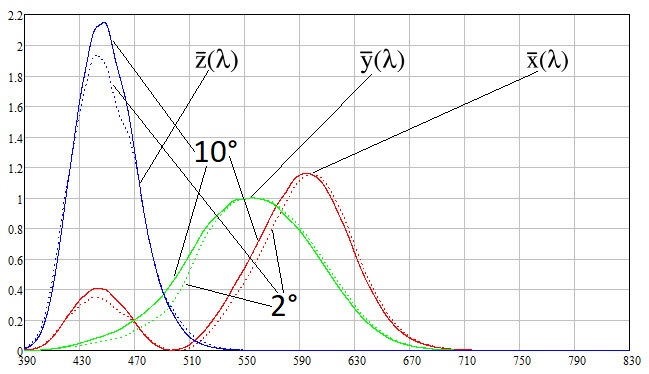
From the graphs it can be seen that above
I compute the above integrals by the trapezoid method :

where c is the coordinate number of the color space (1, 2, 3 for X, Y, Z, respectively); cw is a table of color matching functions; f is the spectral density;
The correct color matching functions have the property that the area under all three curves is the same:
$$ display $$ \ int _ {390 \, nm} ^ {830 \, nm} \, {\ overline {x}} (\ lambda) \, d \ lambda \, = \ int _ {390 \, nm } ^ {830 \, nm} \, {\ overline {y}} (\ lambda) \, d \ lambda \, = \ int _ {390 \, nm} ^ {830 \, nm} \, {\ overline {z}} (\ lambda) \, d \ lambda $$ display $$
This is done so that the uniform spectrum has the same XYZ coordinate values. Check if this property holds:
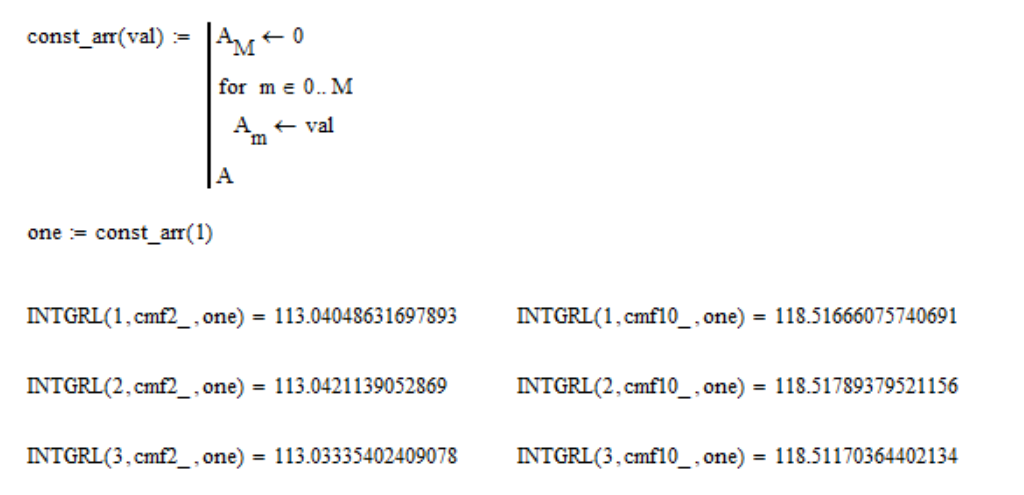
where one is an array of 1; cmf2_ and cmf10_ are color matching function tables for

Brightness normalization
Consider the work of a digital camera. The main element of a digital camera is a matrix, which consists of photosensors. When an image is projected onto a matrix, an electric charge is accumulated in each of its photosensors, which is proportional to the radiation energy of the photosensor. Photosensors capture the brightness of the image element, without carrying any information about its color. For information about the color of the matrix of photosensors on top of the covered matrix of miniature filters. These filters perform the role of color matching functions. Each pixel consists of several photosensors, which are combined in the amount of various light filters.
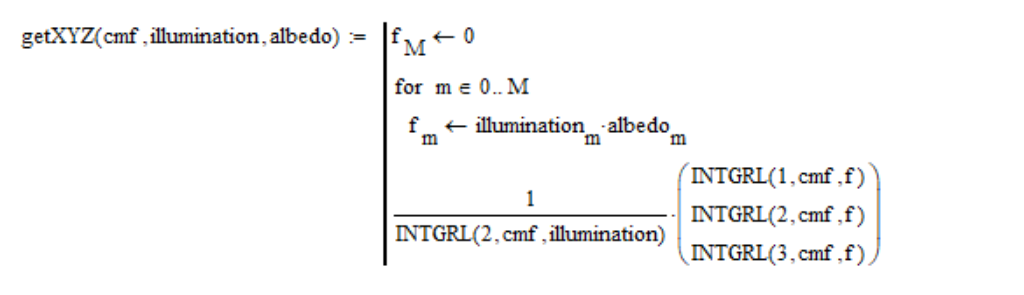
Thus, as a function $ inline $ I (\ lambda) $ inline $ we should take the spectral density of the radiation energy of one pixel. Such a spectral density can be represented as
$$ display $$ I (\ lambda) = coef \ cdot illumination (\ lambda) \ cdot albedo (\ lambda) $$ display $$
where illumination is the spectral density of the light source; albedo - the reflectivity of the surface of the photographed object; coef is a certain constant coefficient, which is determined by the exposure time, aperture, distance from the light source to the object being photographed and other factors. Reflectance refers to the visible albedo , which is defined as the ratio of the brightness of a flat surface element illuminated by a parallel beam of rays to the brightness of an absolutely white surface located perpendicular to the rays.
Now imagine that we are doing the work of the photoexposure meter, with which the photographer sets the shutter speed and aperture on the camera. In other words, we need to choose a coef value so that the image is normal in brightness, not too dark, not too bright. Imagine that there is a completely white screen behind the object being photographed. The albedo reflectivity of such a screen is by definition equal to 1 at all wavelengths. Set the value of coef so that the visual brightness Y of this screen is equal to 1. Why 1? Because in the RGB color model, the maximum possible brightness value is 1, which is achieved with
$$ display $$ coef = \ frac {1} {\ int _ {390 \, nm} ^ {830 \, nm} illumination (\ lambda) \, {\ overline {y}} (\ lambda) \, d \ lambda} $$ display $$
It should be noted that such a normalization does not guarantee that the value of each RGB coordinate will be less than or equal to 255. For example, if you remove an absolutely white screen with a red light source, then the RGB color will zoom out.
So, I calculate the coordinate values of the XYZ color space as follows:
We need to somehow express the color of the sun. We cannot photograph it directly, and in our mathematical model we have not foreseen such an extreme case. Obviously, we need to photograph the surface illuminated by the Sun in white. Since the Sun from space has a reddish tint, then, as I said, the color of an absolutely white screen goes off the scale. Therefore, we must take the surface darker. I empirically found that we must take white paper with an albedo of 0.91. More albedo can not be taken, begins to roll off. So in order to get the color of the Sun, I simply set the albedo value to 0.91 at all wavelengths in the above formula:

SRGB color space
The most common color space using the RGB model is sRGB. Therefore, when they talk about RGB without clarification, it is the sRGB color space that is the standard for representing the color spectrum using the RGB model. This standard was created by the International Color Consortium (ICC) in 1996 to unify the use of the RGB model in monitors, printers and Internet sites. Let's analyze this standard, the description of which is available at
The conversion of XYZ to sRGB takes place in three stages. First, XYZ coordinates are converted to linear RGB coordinates, then linear coordinates are converted to non-linear RGB coordinates, and at the end non-linear coordinates are converted to 8-bit RGB coordinates, which, in fact, are the coordinates of the sRGB color space.
The conversion of XYZ coordinates to linear RGB coordinates is as follows:

and the opposite is:

I wonder where did these strange numbers come from in square matrices? And they came from the recommendation of ITU-R BT.709
We introduce the following functions:
$$ display $$ XYZ (R, G, B) = RGB \ _to \ _XYZ \ cdot {\ begin {bmatrix} R \\ G \\ B \ end {bmatrix}} \\ W (R, G, B) = XYZ_1 (R, G, B) + XYZ_2 (R, G, B) + XYZ_3 (R, G, B) \\ xy (R, G, B) = \ frac {1} {W (R, G, B)} \ cdot {\ begin {bmatrix} XYZ_1 (R, G, B) \\ XYZ_2 (R, G, B) \ end {bmatrix}} $$ display $$
Then the requirements of recommendations ITU-R BT.709 take the following form:
$$ display $$ xy (1,0,0) = {\ begin {bmatrix} 0.64 \\ 0.33 \ end {bmatrix}}, \; xy (0,1,0) = {\ begin {bmatrix} 0.30 \\ 0.60 \ end {bmatrix}}, \; xy (0,0,1) = {\ begin {bmatrix} 0.15 \\ 0.06 \ end {bmatrix}} \\ xy (1,1,1) = {\ begin {bmatrix} 0.3127 \\ 0.3290 \ end {bmatrix }} $$ display $$
We have 8 equations, when we have 9 unknown elements of the RGB_to_XYZ matrix, i.e. one more equation is missing. And not a grasping equation is given implicitly, I had to guess before it myself. The essence of this equation is that for white color, the visual brightness Y should be equal to 1:
$$ display $$ XYZ_2 (1,1,1) = 1 $$ display $$
I found the exact solution of these equations in rational numbers:
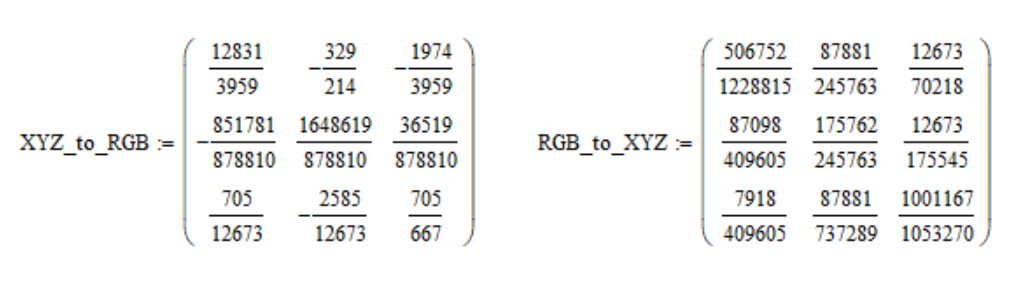
If you round the numbers in my result to four decimal places, you get those weird numbers in the standard of the International Consortium for color. In my calculations, I use not rounded matrices, but the above-mentioned exact ones (as far as floating-point numbers with double precision allow).
So, the linear coordinates of RGB based on the table of color matching functions (cmf), spectral radiation density (illumination) and reflectivity (albedo) I calculate as follows:

I also use linear coordinates RGB, averaged over the

From the linear coordinates of RGB, the visual brightness Y is calculated using the following formula (by default, Mathcad arrays are numbered starting from the zero element):

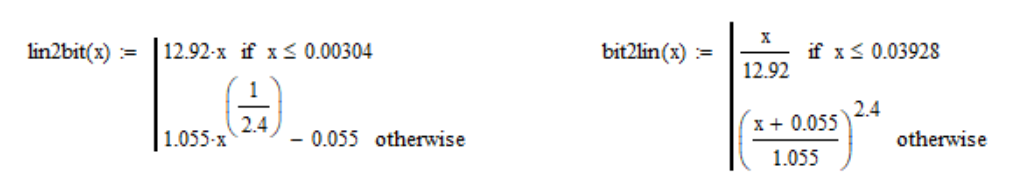
We continue to disassemble the standard. Each linear coordinate of the RGB is converted to nonlinear using the nonlinear function lin2bit, and back to bit2lin, which are defined as follows:
The graphs of these functions look like this:
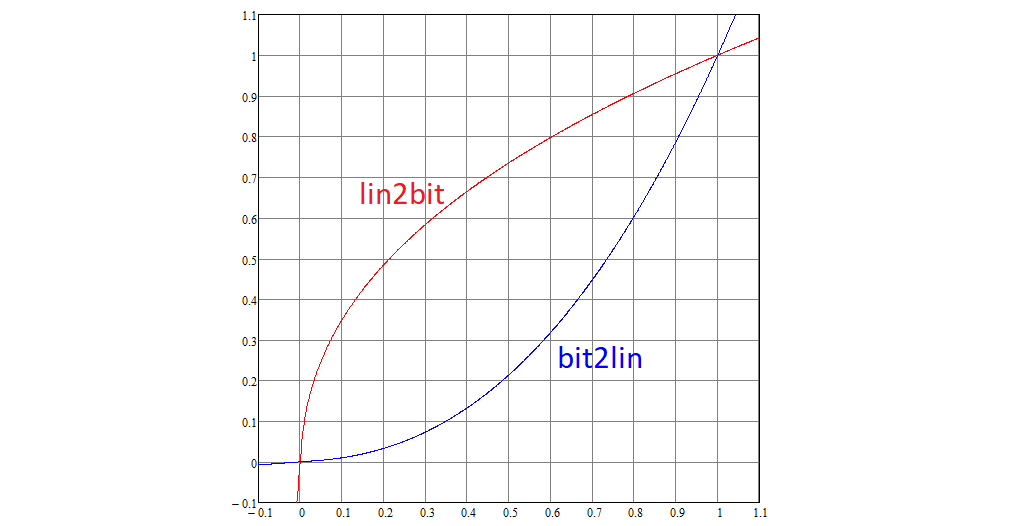
Note that 0 is converted to 0, 1 to 1.
At the end, the non-linear coordinates of RGB are converted to 8-bit by multiplying by 255, followed by rounding to whole numbers.
Thus, I defined the following functions for converting linear RGB coordinates to 8-bit and vice versa:

Now we are ready to solve the problem from the introduction. I remind the condition.
Let the color be set to
1) What are the values of RGB has a color that is 2 times darker than the specified?
2) What are the RGB values for gray with the same brightness as the given one?
Decision:

Answers: 1)
Colour temperature
The color temperature of the light source, measured in Kelvin, is determined by the temperature of the absolutely black body located on the color chart in the same place as the radiation source under consideration. If the light source does not fall on the Planck curve (a curve that is determined by the set of color points of an absolutely black body at different temperatures), a correlated color temperature is used to characterize it. This value is also measured in Kelvin and is determined by the temperature of an absolutely black body, whose color is as close as possible to the color of the light source. To find the correlated color temperature of the radiation source on the color chart constructed in coordinates
For an absolutely black body of temperature T, the radiation power per unit area of the radiating surface in a unit wavelength interval is expressed by Planck’s law :
$$ display $$ R (\ lambda, T) = \ frac {2 \ pi hc ^ 2} {\ lambda ^ 5} \ frac {1} {e ^ {hc / \ lambda k T} -1} $$ display $$
Accordingly, I calculate the spectral density of blackbody radiation as follows (in the zero column of the cmf2 color matching function table are the wavelength values in nanometers):
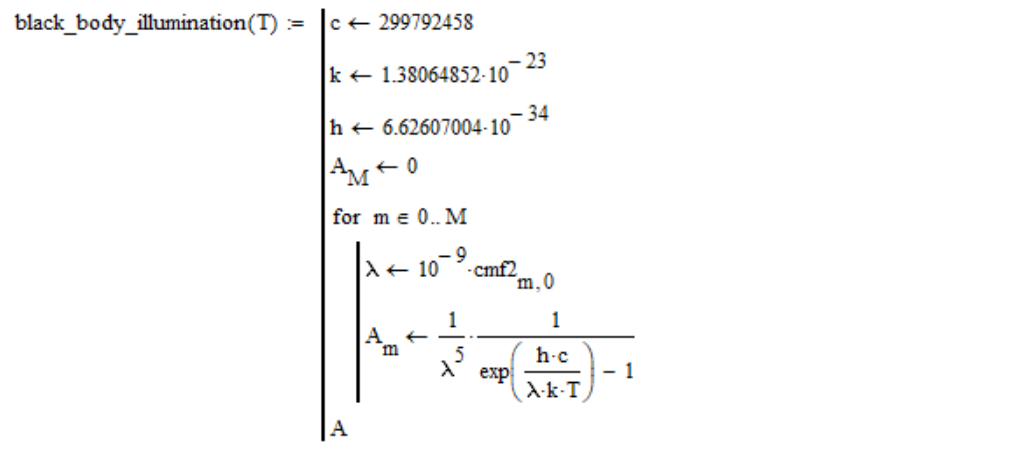
Please note, I lowered the constant factor, since it is still reduced with further normalization in brightness (the brightness of the light source does not affect the color temperature).
Then I calculate the linear coordinates of RGB:

RGB linear coordinates are converted to

On the plane

For example, for a standard white light source, the dependence of this distance on temperature looks like this:

The value of T at which this dependence has a minimum is the color temperature of the considered light source.
Sun's spectral density
The data of the spectral density of the solar radiation in the absence of the atmosphere I downloaded from here:
As will be shown below, light sources D65 and E490 have color temperatures of 6467K and 5912K, respectively. The spectral radiation densities of the light sources D65, E490 and absolutely black bodies of the corresponding temperatures are as follows:
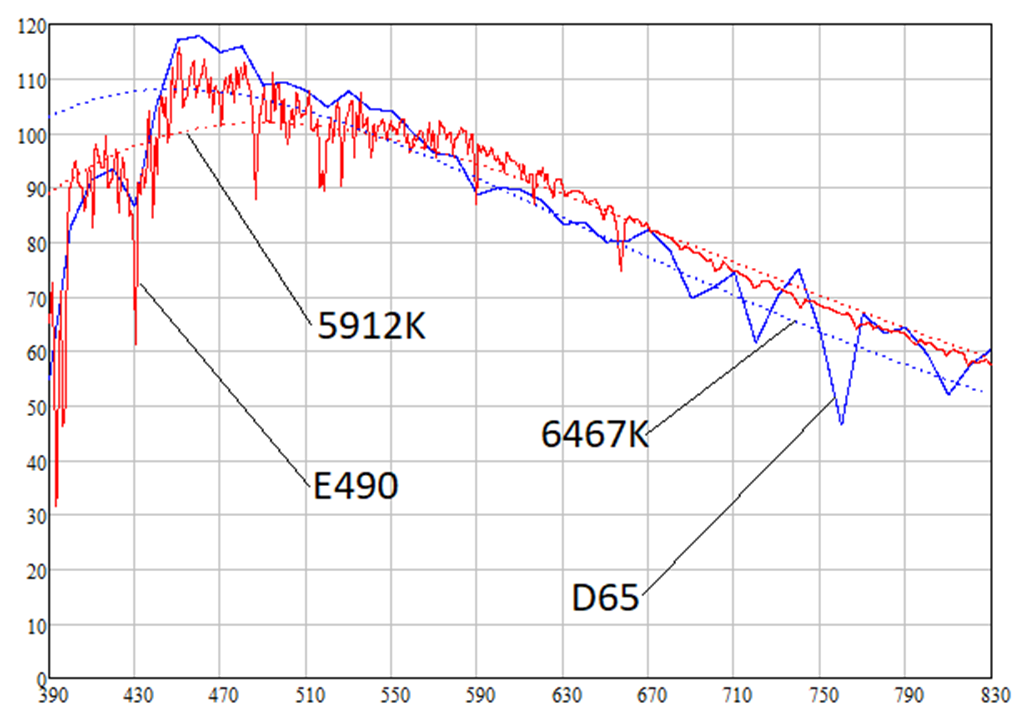
You can see that the spectral density of solar radiation is higher than that of a white light source at longer wavelengths, i.e., at wavelengths of red light (620-770 nm). This means that the sun has a reddish tint. Indeed, the calculations give the following colors of the light sources D65, E490 and absolutely black bodies of corresponding temperatures (as I said, white paper with an albedo of 0.91 is considered):

Note, the coordinates of the sRGB of the Sun and the black body temperature of 5912K exactly match. This is not explained by anything, it just happens.
The color of the circles in the last picture is the true color of the Sun from space. The human eye clearly sees the reddish tint of the sun. So, the fact that the Sun from space is white is a big myth! It should be noted that for some reason this shade is not observed on the Apollo photos and videos. In these photographs, the visible reddish hue of the Sun would certainly appear on the white surfaces of the American flag and spacesuits. And as will be shown below, this hue of the Sun makes a significant contribution to the "redness" of the Moon from space.
Is the moon different or the same color?
Opponents of the theory of the lunar conspiracy promote the version that the moon is different in color. Allegedly, the moon is gray in places, brown in places, and the Apollos landed where the moon is gray. But this version directly contradicts scientific data. The article
The color differences on the moon are extremely small.
Shevchenko also writes in his book
For many years, the famous American researcher T. McCord worked in this direction. He obtained more than 200 spectra for different parts of the lunar surface of 10–20 km each. All the curves obtained are basically similar in appearance.
So, no, the moon is not different in color, but the same.
Data on the color of the moon by Shevchenko
Shevchenko in his book
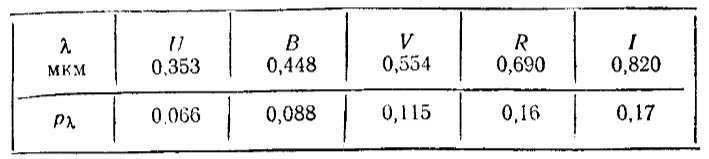
In my calculations, I apply the piecewise linear interpolation of this data. The missing data on the interval of 820-830 nm, I received a direct continuation of the segment on the interval of 690-820 nm.
LRO Color Data by LRO
The dependence of the reflectivity of the lunar surface on the conditions of illumination and observation at wavelengths from 321 nm to 689 nm is given in

The phase angle can be expressed in terms of the azimuth angle $ inline $ \ varPsi $ inline $ using the spherical cosine theorem as follows:
$$ display $$ g = \ arccos \ left (\ cos \ left (i \ right) \ cos \ left (e \ right) + \ sin \ left (i \ right) \ sin \ left (e \ right) \ cos \ left (\ varPsi \ right) \ right) $$ display $$
In the calculations, I take the traditional values of the angles
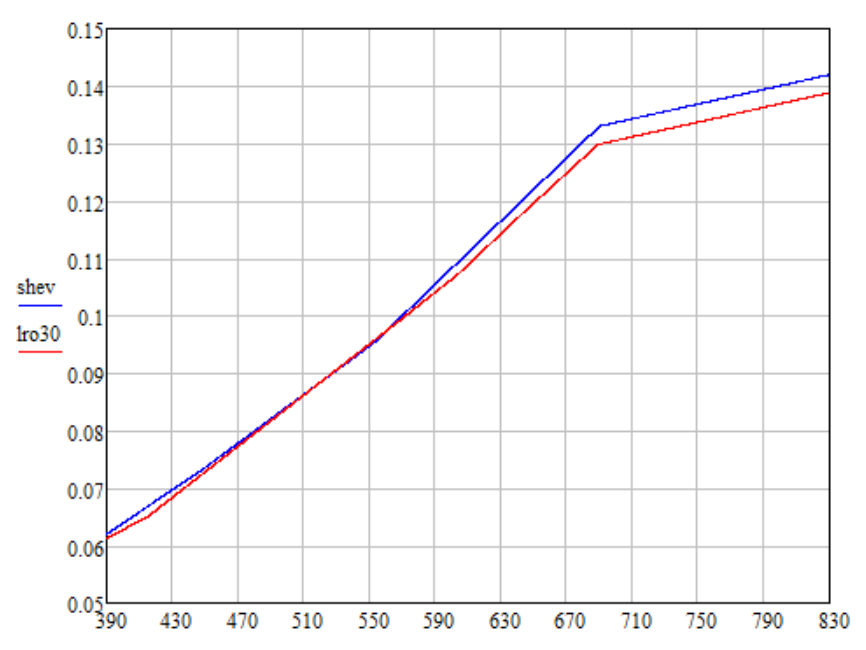
I did a linear extrapolation of the LRO data over the interval of 689-830 nm so that the ratio of the values at the points of 830 nm and 689 nm was the same as that of the Shevchenko data (shev plot).
Data on the color of the moon by "Kaguya"
In
But the work is interesting in that it speaks of the colossal discrepancies between the data of Kaguya and the data of the Apollo 16 mission. And this is one of the rare cases when the scientific community openly speaks of inconsistencies associated with the flights of Americans to the moon.
Calculation results
Further I will use the following notation:
D65 - standard white light source D65;
E490 - the source of light from the sun in the absence of the atmosphere;
D65
B-0.91 LRO (30 °) Shevch. lin (2 °) 0.9076,0.9120,0.8968 0.1177.0.0931.0.0688 0.1202.0.0931.0.0697 lin (ten) 0.9084,0.9122,0.8929 0.1165.0.0916.0.0687 0.1188.0.0917.0.0696 lin (average) 0.9080,0.9121,0.8948 0.1171,0.0924,0.0688 0.1195,0.0924.0.0697 sRGB (100%) rgb (244,245,243) rgb (96,86,74) rgb (97,86,75) sRGB (200%) - rgb (133,119,104) rgb (134,119,104) sRGB (300%) - rgb (160,144,125) rgb (161,144,126) sRGB (400%) - rgb(182,164,143) rgb(184,164,144) . . 6467K 4928K 4891K
E490
-0.91 LRO(30°) Shevch. . (2°) 1.0005,0.8892,0.8490 0.1283,0.0909,0.0649 0.1310,0.0909,0.0657 . (10°) 1.0021,0.8888,0.8483 0.1272,0.0895,0.0650 0.1297,0.0895,0.0659 . (.) 1.0013,0.8890,0.8486 0.1277,0.0902,0.0649 0.1303,0.0902,0.0658 sRGB (100%) rgb(255,242,237) rgb(100,85,72) rgb(101,85,73) sRGB (200%) - rgb(138,118,101) rgb(140,118,102) sRGB (300%) - rgb(166,142,122) rgb(168,142,123) sRGB (400%) - rgb(189,162,139) rgb(191,162,140) . . 5912K 4550K 4512K
The following image shows the moon's surface colors

As you can see, the Moon from space has a brown color, both according to LRO data, and according to Shevchenko's data. Shevchenko turns out to be a little (barely noticeably) redder than LRO.
The color of the moon in the photos
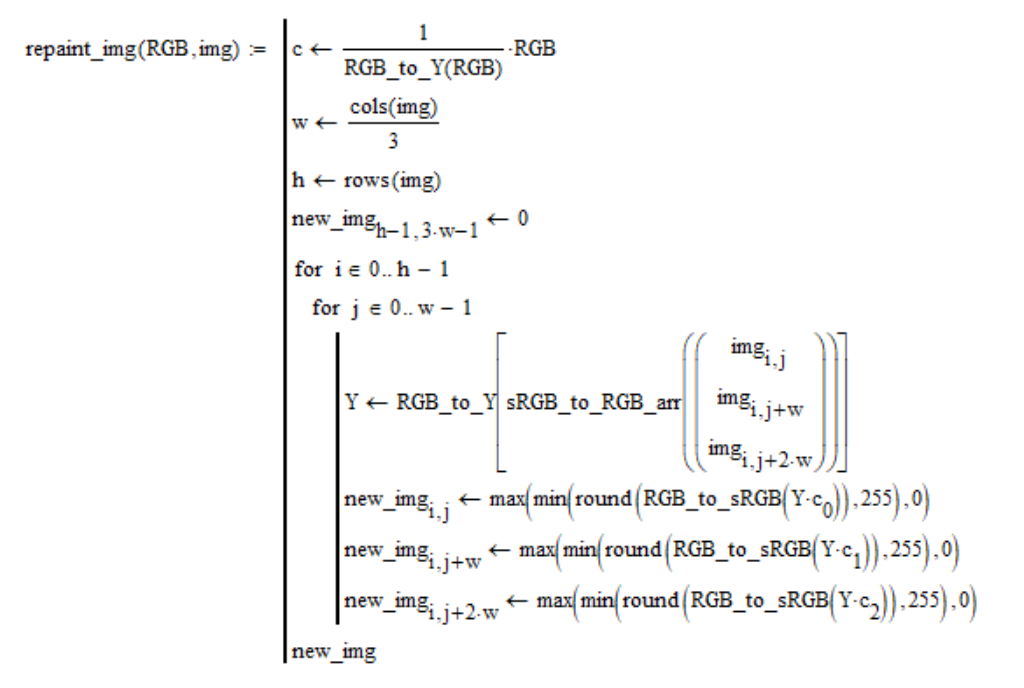
In this section we will do the coloring of photos. Let the image be given img and the color in linear coordinates RGB . Each pixel of the image is replaced by a pixel of a given color of the same brightness as that of the source pixel. The image in the Mathcad program is represented as a single sRGB coordinate matrix, which is obtained by stitching three “R”, “G”, “B” matrices from left to right. With this in mind, the coloring procedure is as follows:
For interest, I took photographs of the Apollo photo album depicting the lunar surface of the American program and repainted it in the colors obtained from my calculations. I give only the results, and the conclusion that these authentic photos or fake, make it yourself.
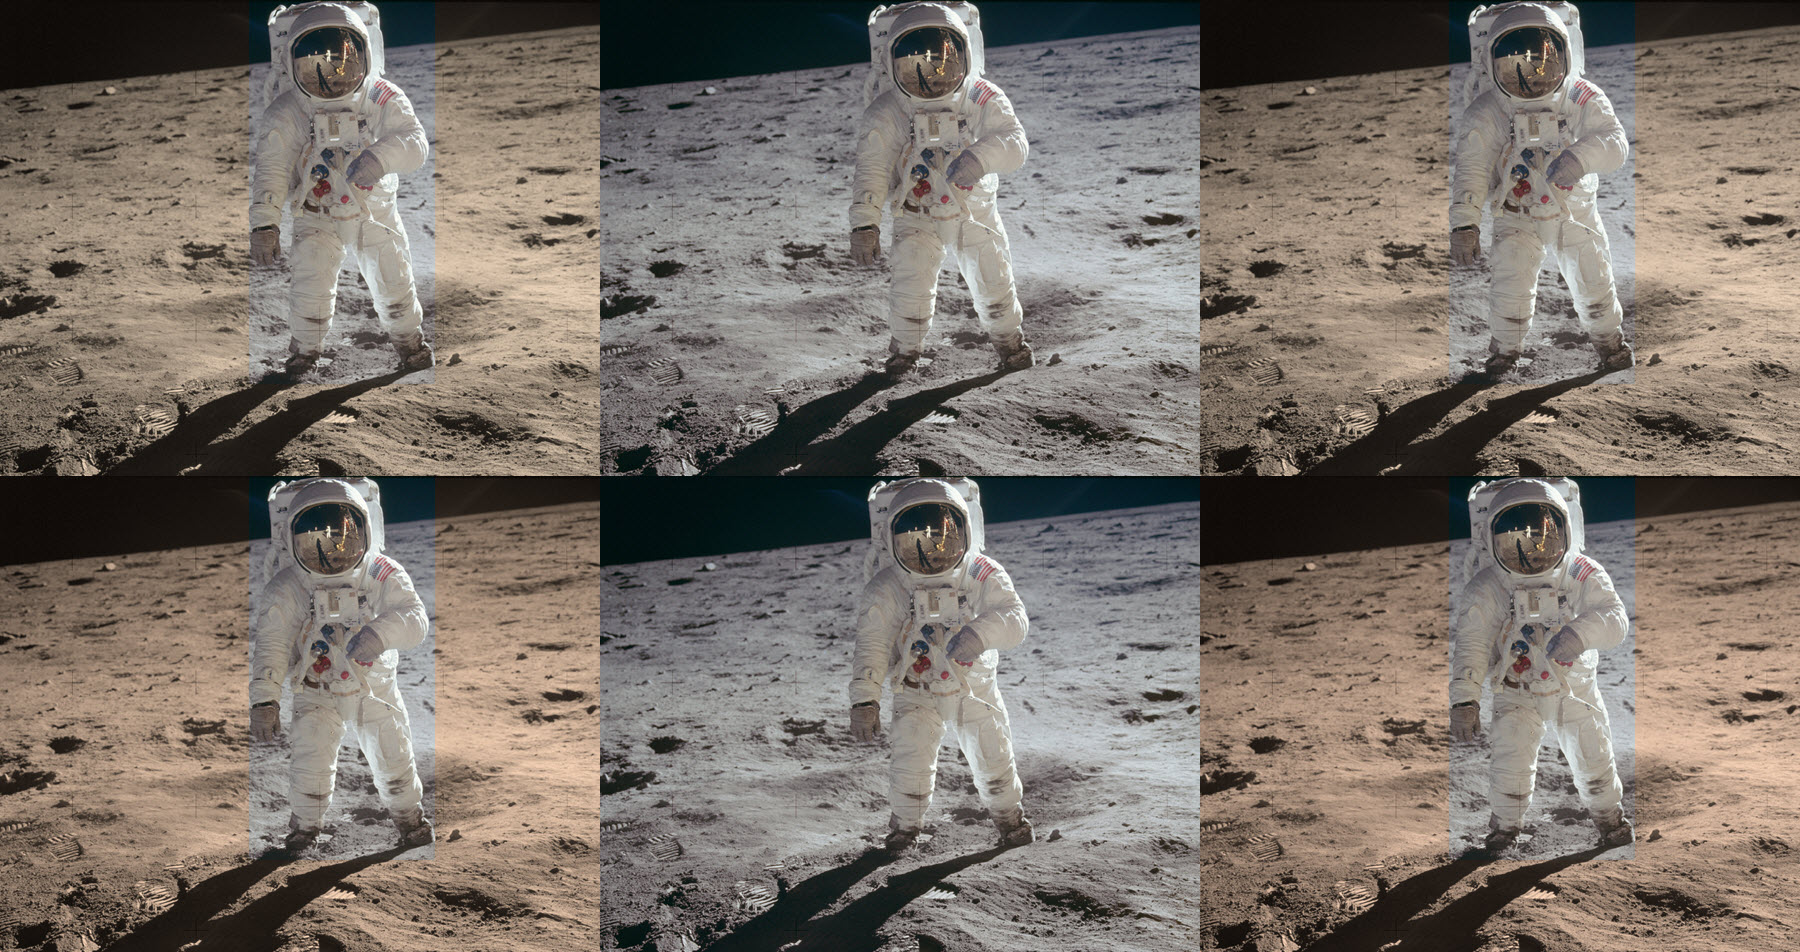
The result of the coloring pictures AS11-44-6552:

In the middle are the original photos. On the left, the photographs are painted in colors according to LRO data at traditional angles
As you can see, the reddish tint of the Sun makes a significant contribution to the "redness" of the surface of the Moon, which ultimately looks brown, and not gray at all.
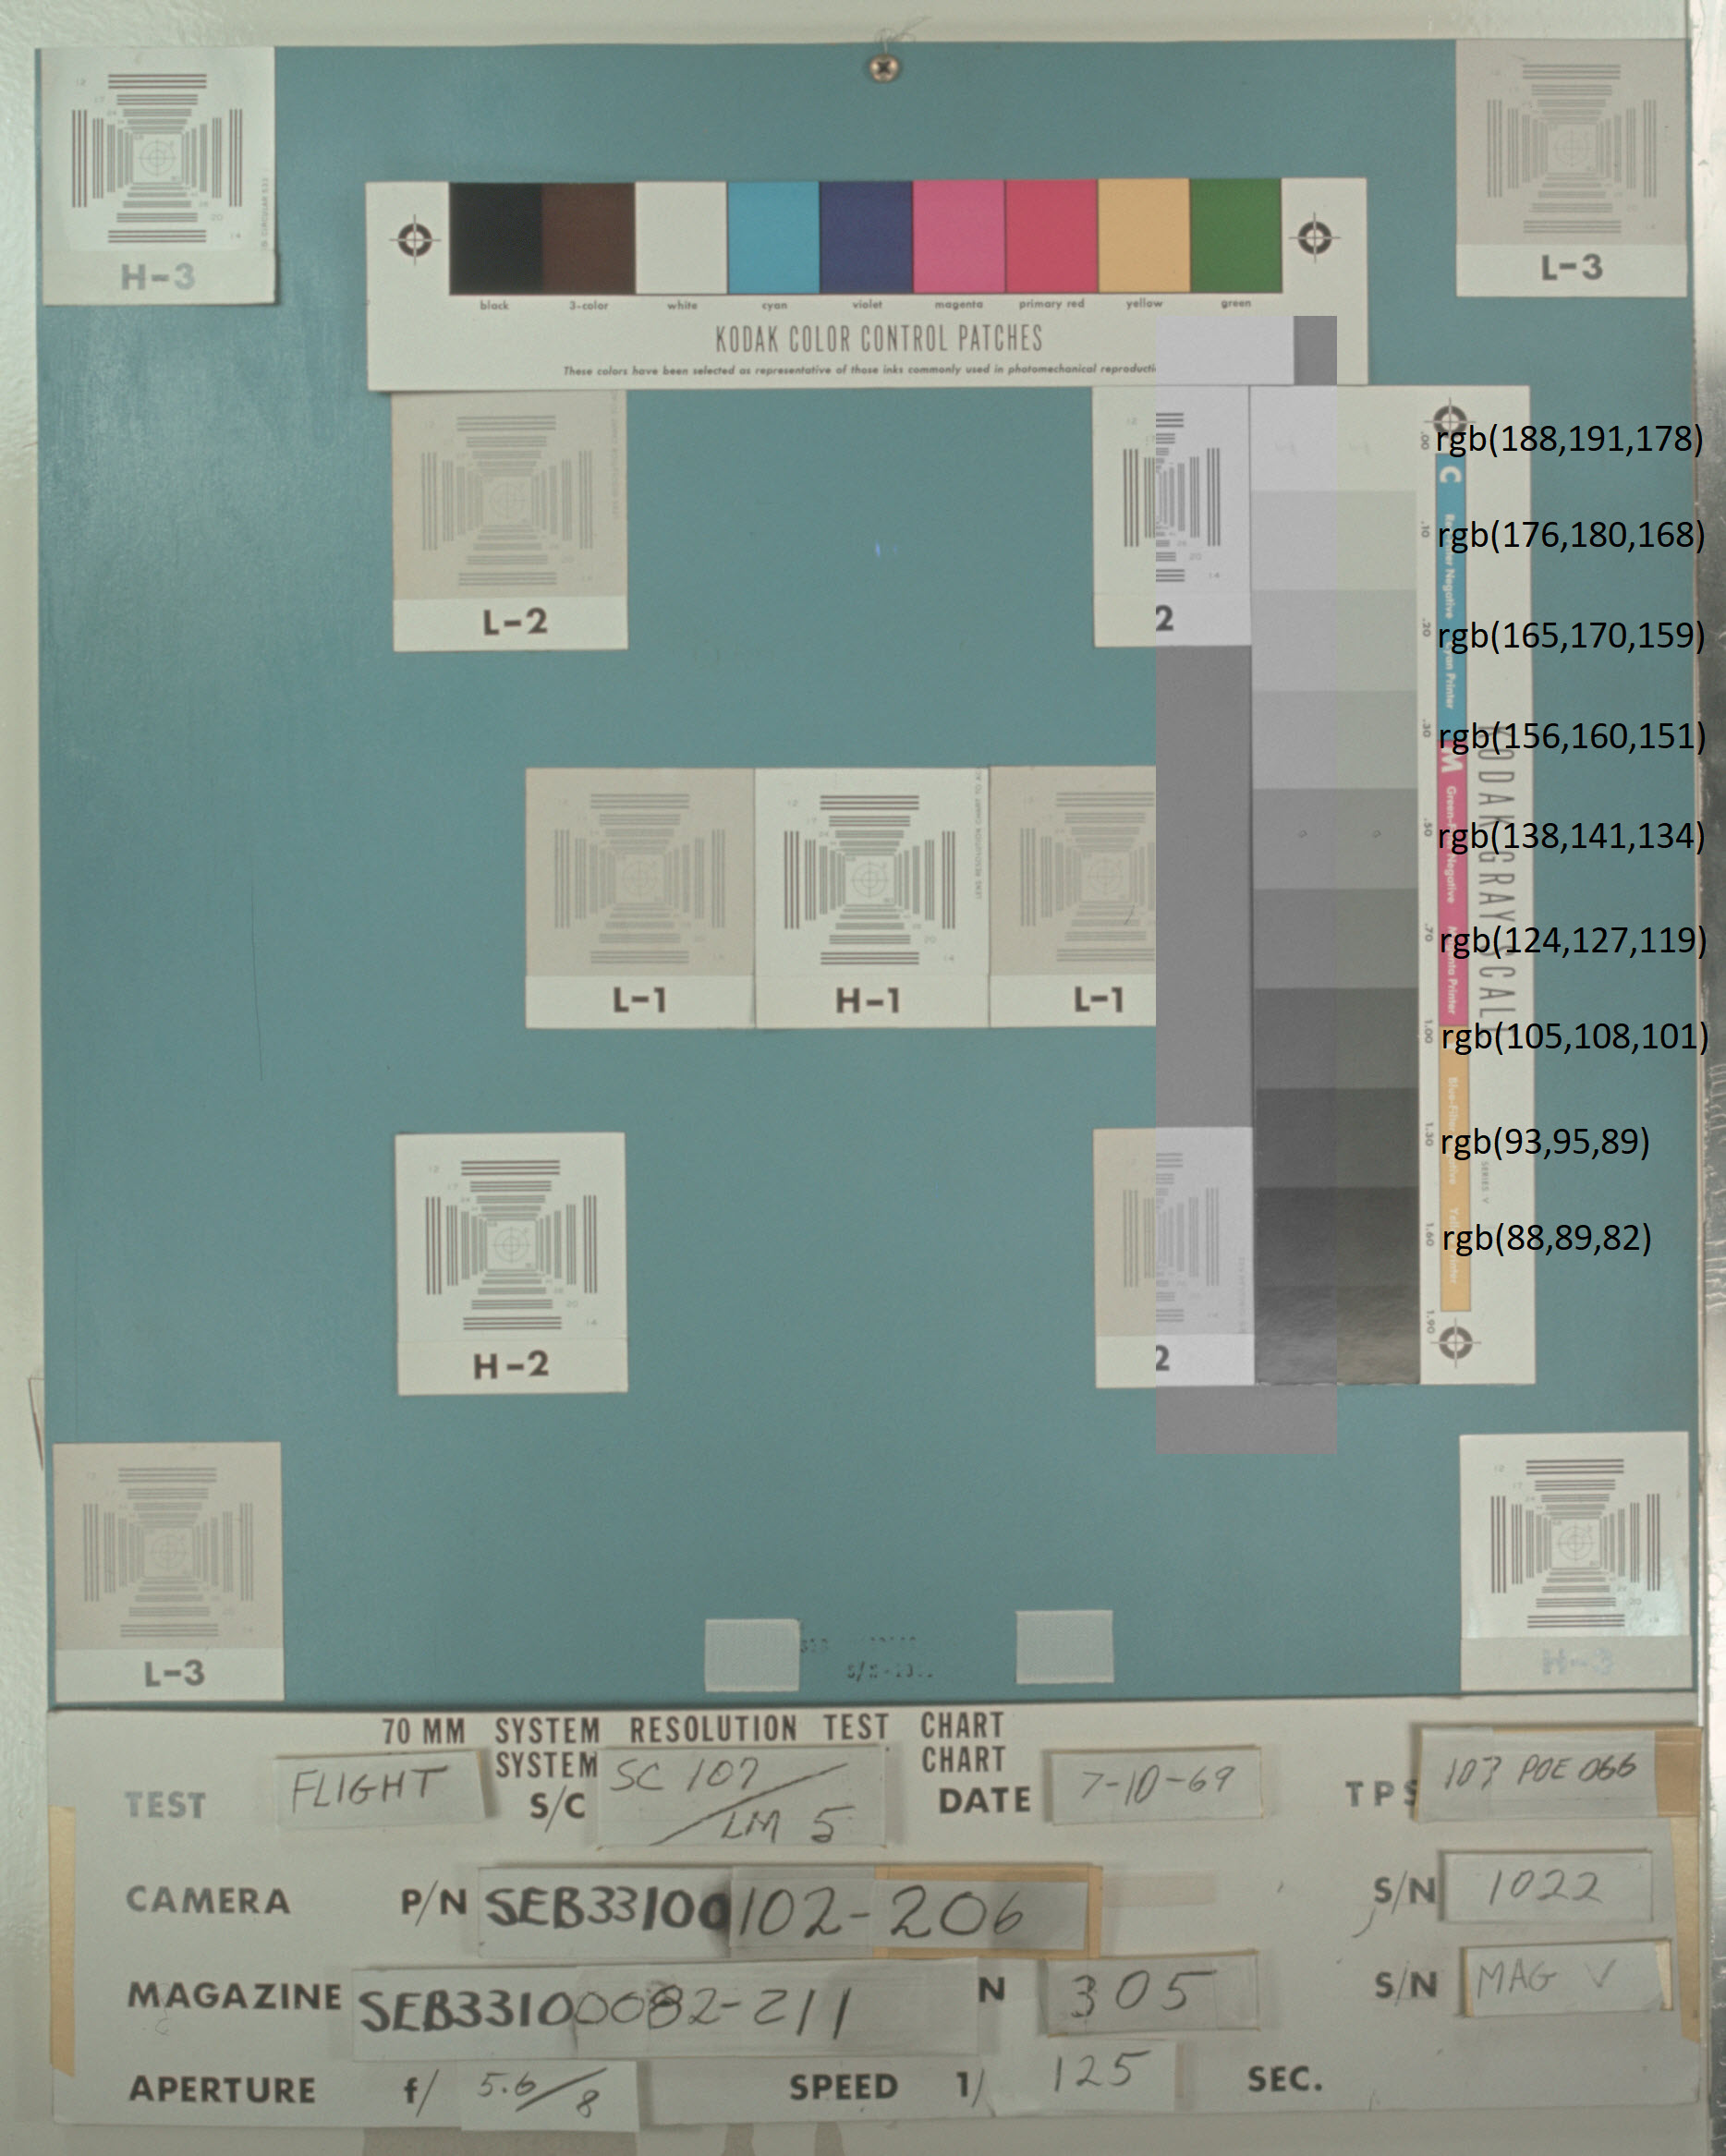
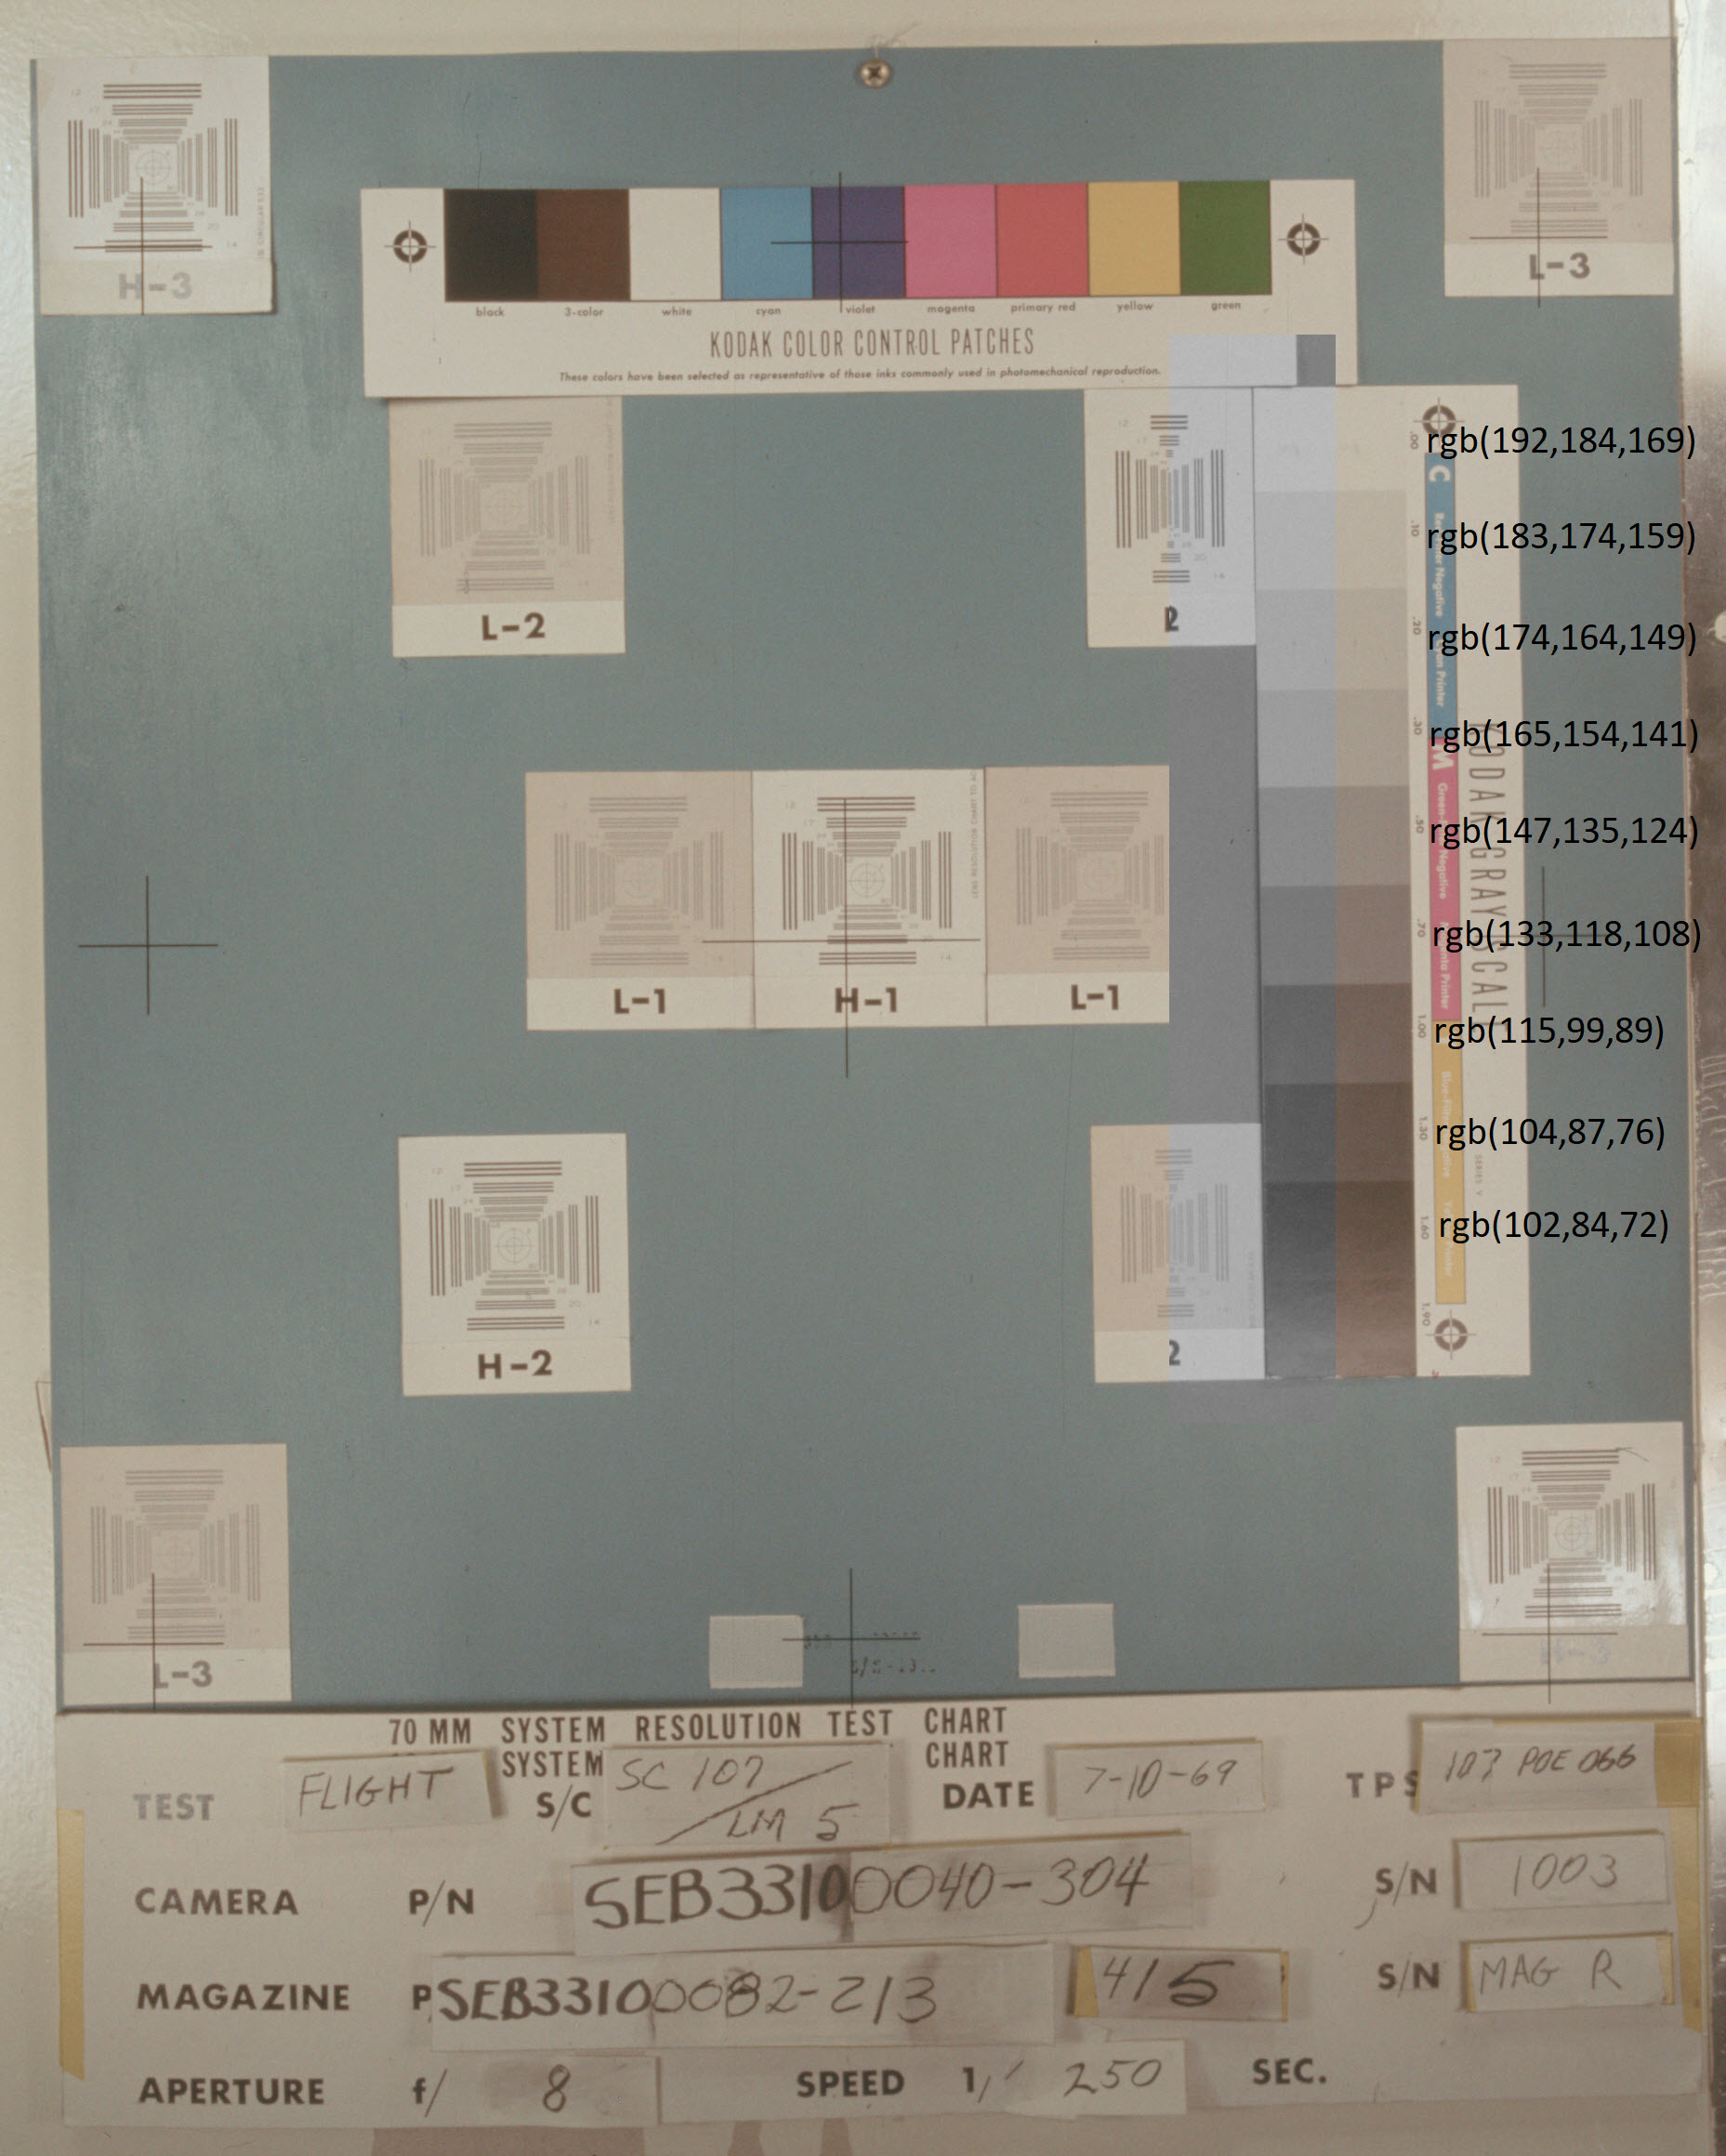
The gray color of the moon in the photos of NASA could be explained by the fact that for some reason the film “went away” to blue, but this version disappears immediately if we analyze the pictures of gray gradations at the end of the albums. The photograph as11-44-chart shows such a snapshot for the last photo above. I put real grays of the same brightness to the photo to the left of the gray gradations as in the photo, and also wrote out the sRGB coordinate values. The result was the following image:
As you can see, the film not only did not “go away” in blue, but even slightly “went away” in the opposite direction from the blue. Such a deviation can not turn brown to gray.
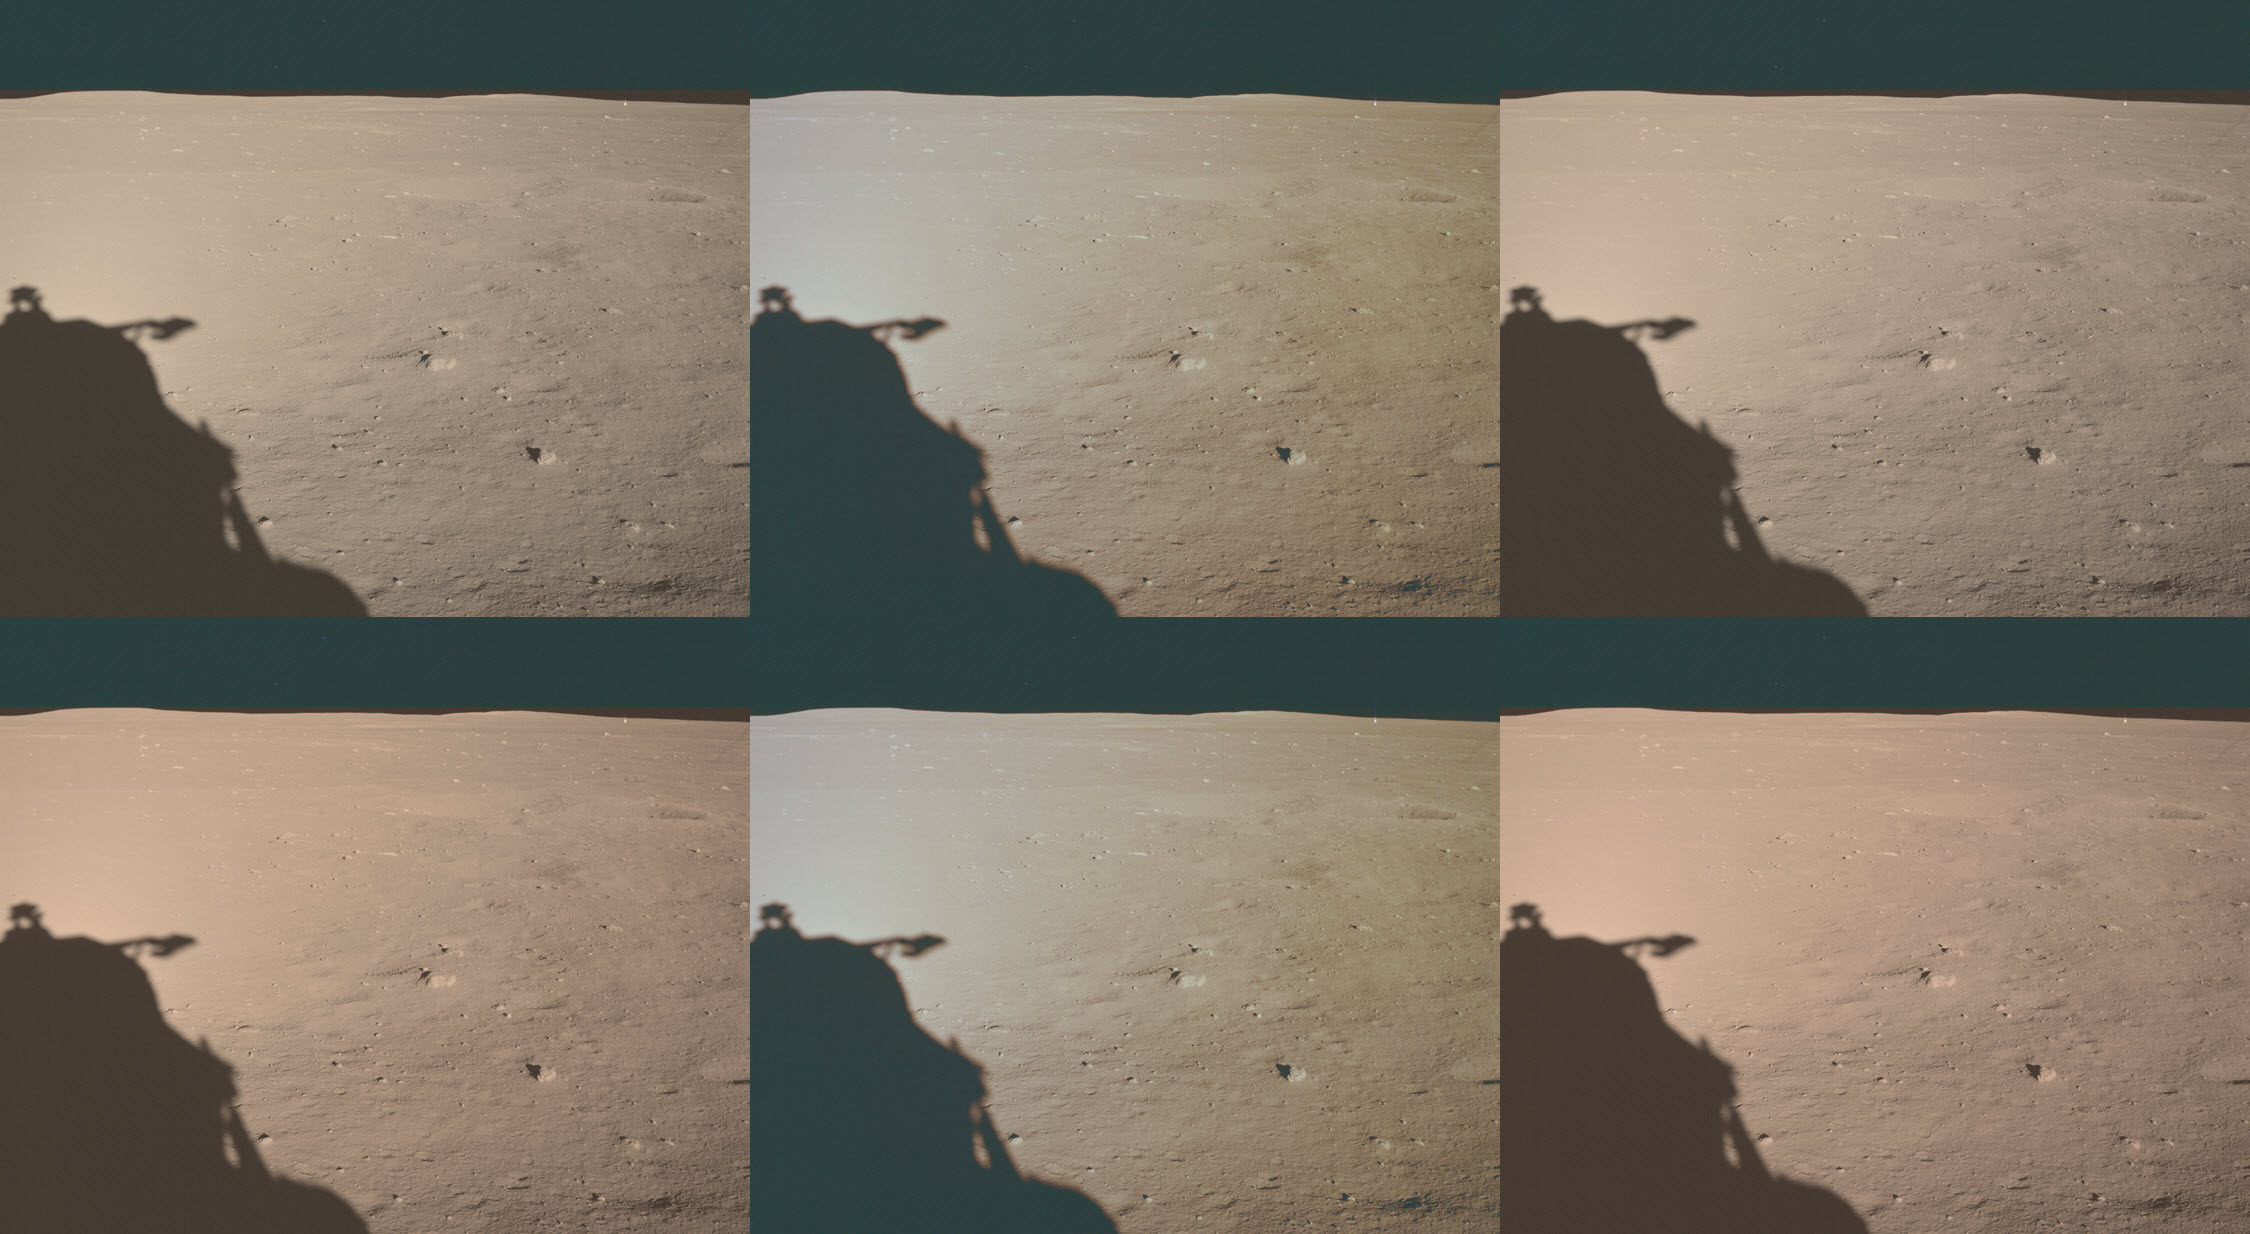
The result of the coloring photos AS11-40-5903 :
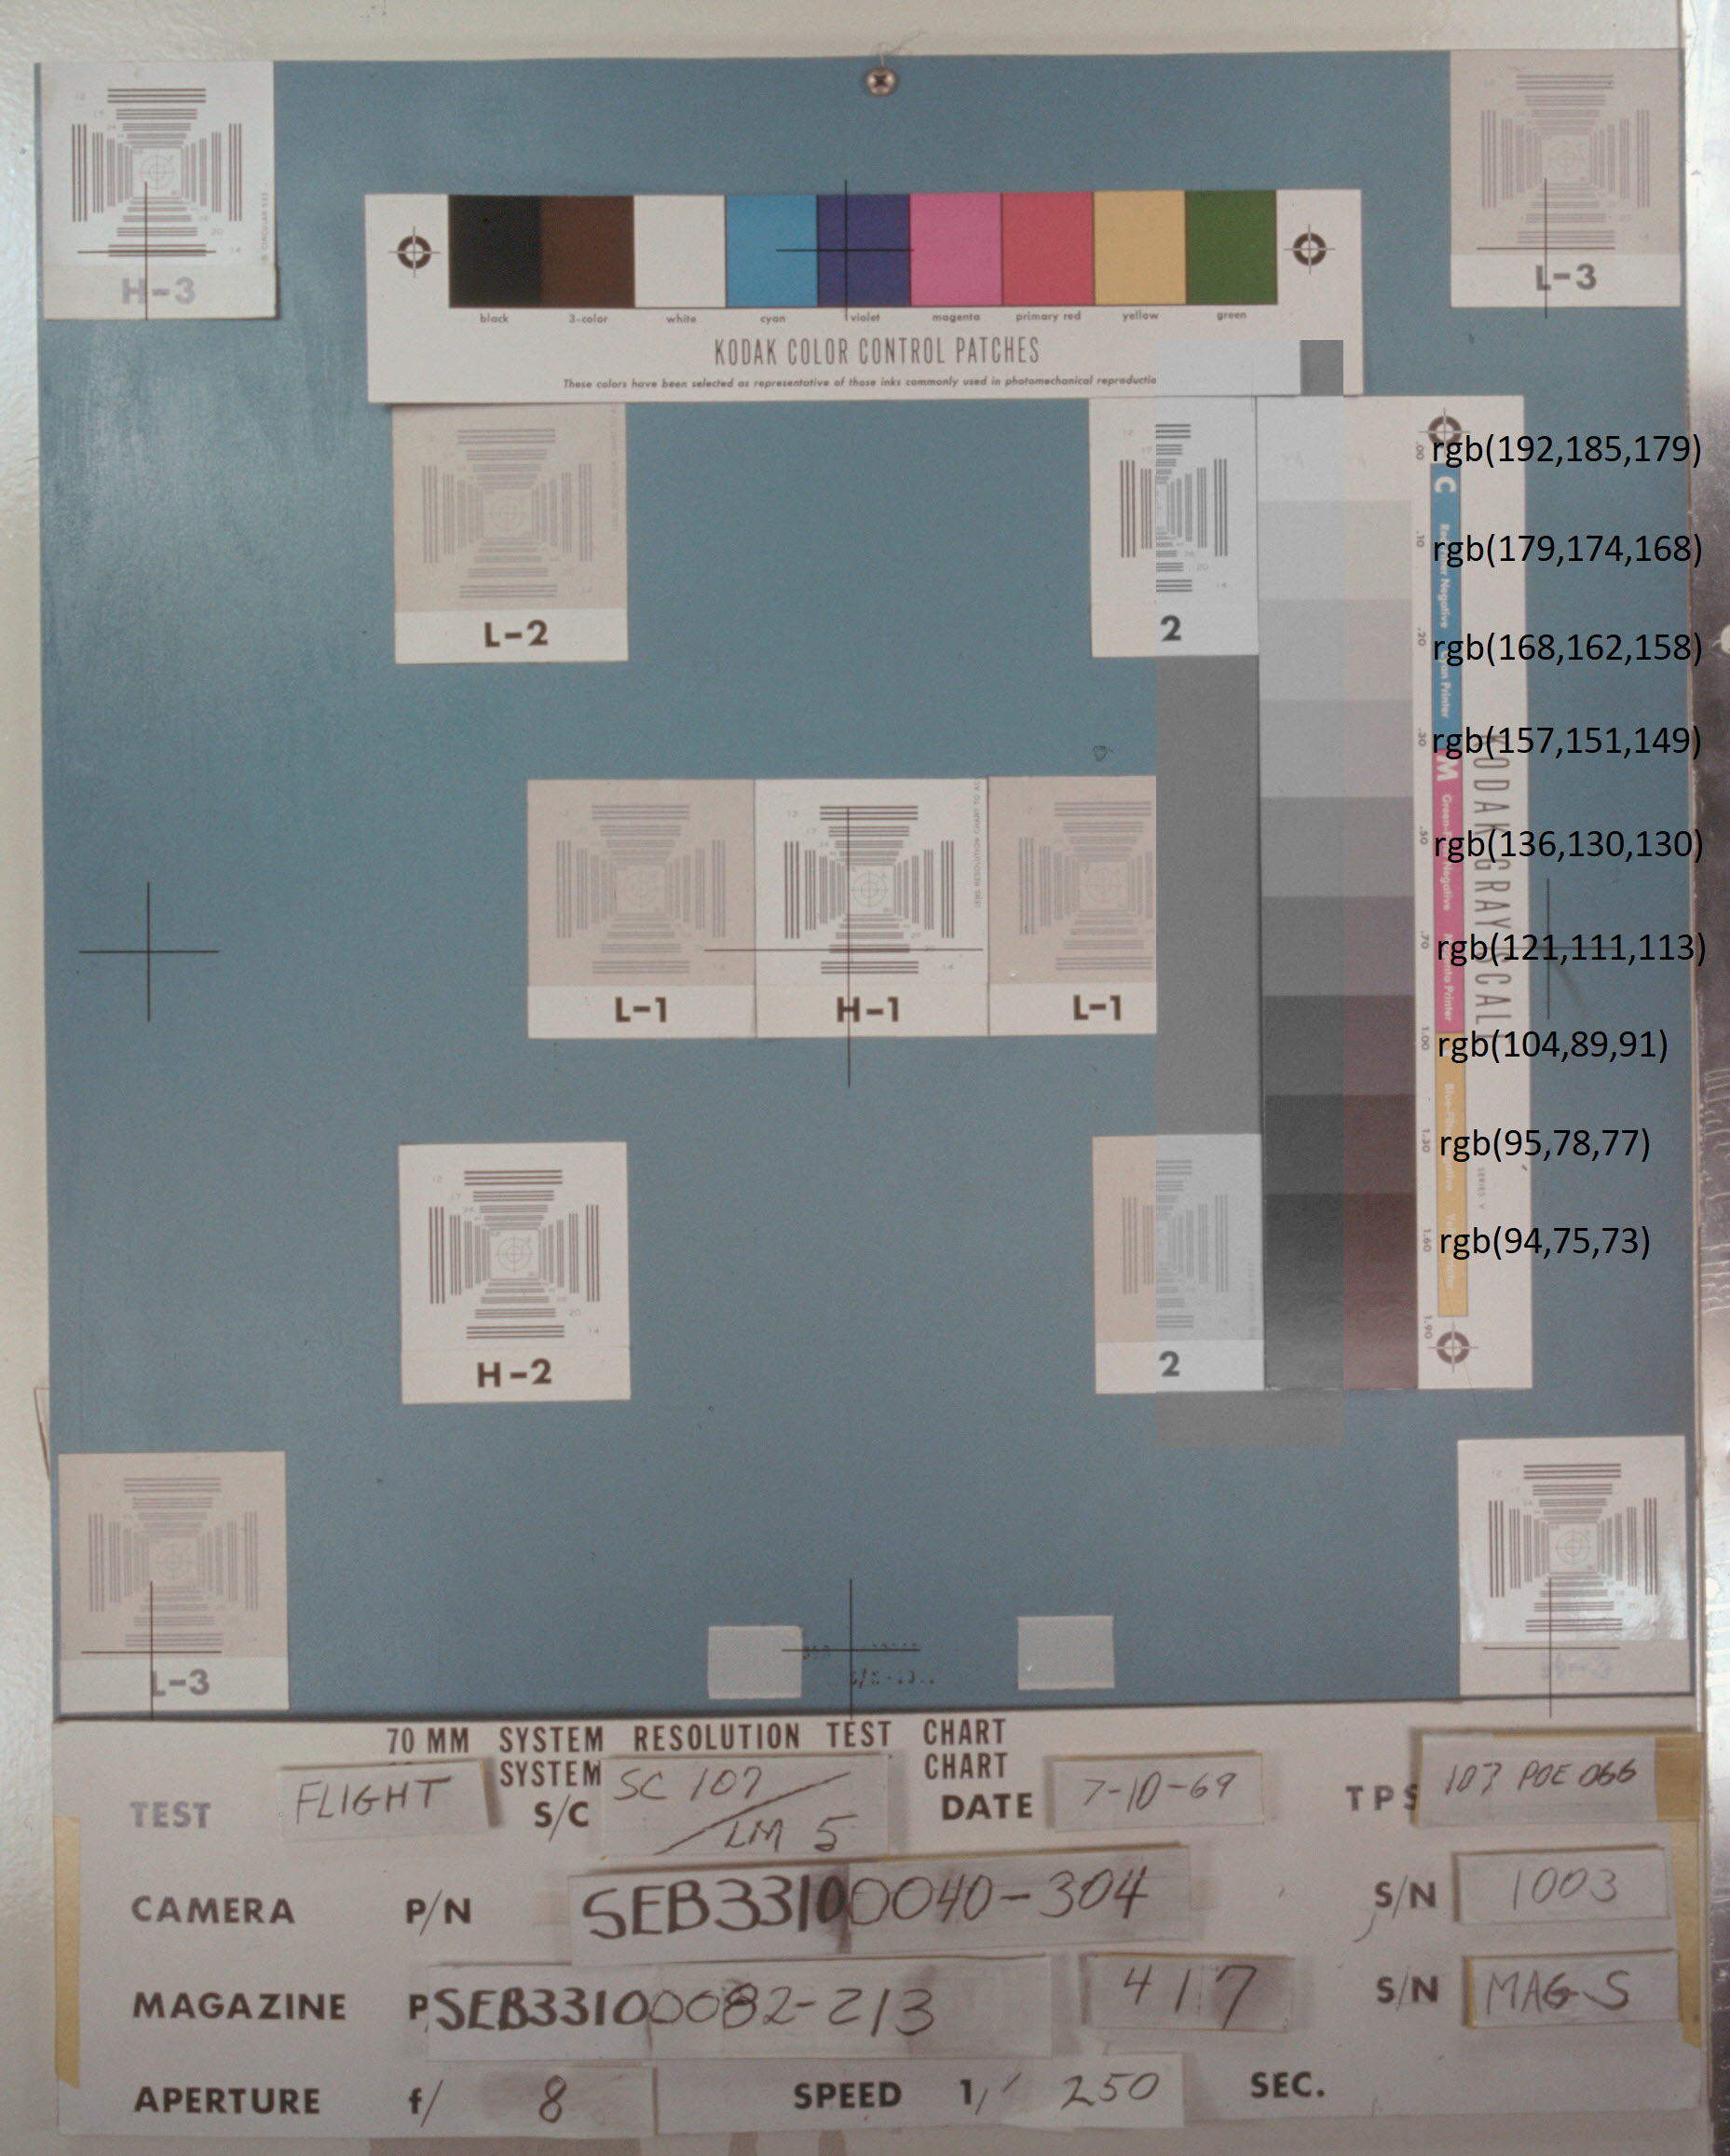
In the original photo, the lunar surface in places has not just a gray color, but even a slight bluish tint. The photograph of the as11-40-chart shows the corresponding picture of the gradations of gray:
The film "went away" not to the "blue" color, but to the "red". And even after that, for some reason, the lunar surface in the NASA photo is gray.
The result of the coloring photos AS11-37-5455 :
This is one of the rare photos of the program "Apollo", where the lunar surface has a brown tint, though not entirely. Opponents of the theory of the lunar conspiracy like to show it, they say, look, brown. But the trick has crept in here. Let us analyze the photo as11-37-chart , which shows the corresponding picture of gray gradations:
The film just "left" in brown. That's the whole reason for the brown tint of the lunar surface in NASA photographs.
The dependence of the color of the lunar surface on the conditions of illumination and observation
Using the LRO data given in
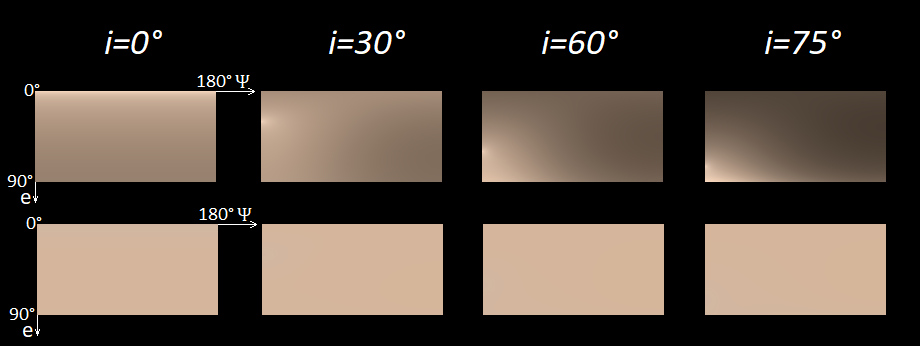
As can be seen from the picture, only the brightness changes. In the bottom row, the colors are almost the same everywhere for the human eye. Although, if you look closely, in the case of
Moon soil color
The NASA website has a very strange photograph, namely this photograph of lunar soil sample No. 10005 .
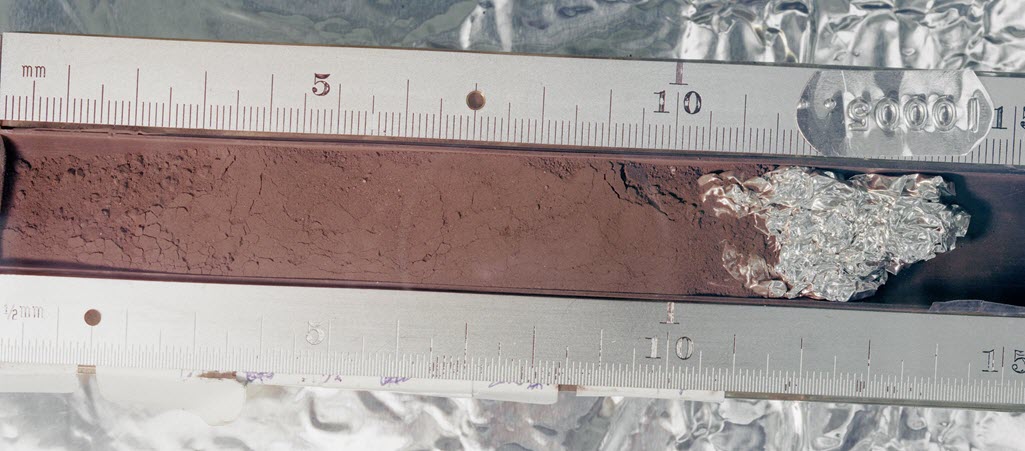
The lunar soil on the photo looks brown, even too brown given the fact that the lighting was produced by a white light source. The correctness of the white balance can be checked by the color of the white paper that came into the frame.
Maybe this is the same orange ground that the Apollo 17 astronauts found? Not!The document
And now let's listen to what Neil Armstrong (Apollo 11 astronaut) says in an interview with Patrick Moore
When you look at the ground near or in your hand, you find that it is actually coal-gray, and we especially could not find anything different from this color.
(If you’re looking at what you’re looking for.
It turns out, Neil Armstrong, not afraid of the word, lied.
Literature
one. Color & Vision Research Laboratory - New CIE XYZ functions transformed from the CIE (2006) LMS functions
2 International Color Consortium - A Standard Default Color Space for the Internet: sRGB
3 Recommendation ITU-RBT.709 - for HDTV standards for production and international program exchange
four. Robertson R. "Computation of correlated color temperature and distribution temperature" /.Opt. Soc. Am.58, 1528 (1968).
five. 2000 ASTM Standard Extraterrestrial Spectrum Reference E-490-00
6 CIE Standard Illuminant D65
7 "The first results of the determination of the physicomechanical properties of the soils of the Moon", M .: 1970. Gosstroy of the USSR, ed. prof.Dr. Techn. Sciences VG Bulycheva, p. 8.
eight. Shevchenko, VV, The Moon and Its Observation, 1983, pp. 91-92.
9. Hapke, B., B. Denevi, H. Sato, S. Braden, and M. Robinson (2012), Orbiter Wide-Angle Camera, J. Geophys. Res., 117, E00H15
10. Ohtake, M. et al. (2010), SELENE (Kaguya) Multiband Imager Data, Space Sci. Rev., 154, 57-77
eleven. THE APOLLO 11 DRIVE TUBES, Dissection and description by Judith H. Allton, NASA (1978)
12. BBC. Neil Armstrong Interviews Patrick Moore (1970)
Source: https://habr.com/ru/post/444556/
All Articles