The time has come java 12! Review of hot JEPs

Half a year has passed, which means time to install a new Java ! It was a long way, and only a few got to the end. Of the interesting JEPs, the raw lines fell off, but we'll talk about the rest under the cut.
How is it going
The release of a new version of Java is taking place according to a new “accelerated” release cycle, about six months in length. The exact dates are defined on the project page . For JDK 12, there were several major phases:
- 2018/12/13 - First deceleration phase (at this moment fork is made from the main branch in the repository);
- 2019/01/17 - The second phase of the slowdown (complete everything you can);
- 2019/02/07 - Release candidate (only the most important bugs are fixed);
- 2019/03/19 - Release, General Availability. <- you are here
What to us from this schedule? Yes, in fact, nothing - we just came to the finish line, and the lordly look at the fans of Legacy from the height of a brand new, fresh JDK 12.
Bugs! Panic! All to the bottom!

When a new non-LTS version comes out, usually everyone doesn’t care about new features. More interesting, if it does not fall apart to the devil.
Of course, there are a lot of bugs, but not in JDK 12 :) Judging by the format, everything is normal:
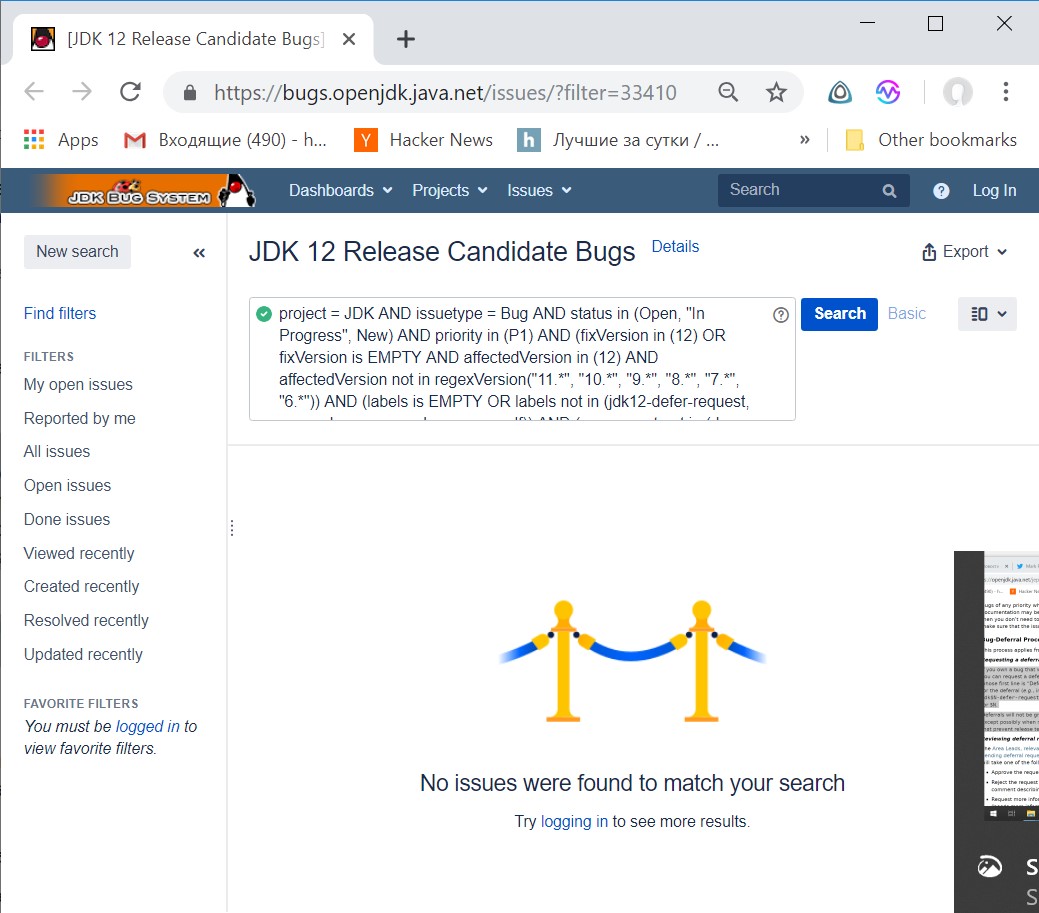
I will quote a request so that you understand exactly what “norm” is:
project = JDK AND issuetype = Bug AND status in (Open, "In Progress", New) AND priority in (P1) AND (fixVersion in (12) OR fixVersion is EMPTY AND affectedVersion in (12) AND affectedVersion not in regexVersion("11.*", "10.*", "9.*", "8.*", "7.*", "6.*")) AND (labels is EMPTY OR labels not in (jdk12-defer-request, noreg-demo, noreg-doc, noreg-self)) AND (component not in (docs, globalization, infrastructure) OR component = infrastructure AND subcomponent = build) AND reporter != "Shadow Bug" ORDER BY priority, component, subcomponent, assignee Of course, in general, bugs have a place to be, they are not going anywhere in such a huge project. It is claimed only that right now P1 bugs are not noticed.
More formally, communication with the bugs is declared in a special document, the JEP 3: JDK Release Process , which is owned by our immortal steward on the troubled waves of the Java-ocean - Mark Reinhold.
And especially worth getting to the paragraph , telling, Who is to blame and what to do , how to transfer tickets, if by the 12th release no longer have time. It is necessary to put the jdk$N-defer-request tag in the bugtracker in which N indicates which release you would like to transfer from and leave a comment, the first line of which is Deferral Request . Further, reviews of all such requests are taken by the leads of the respective areas and projects.
The problems of passing TCK cannot be ignored in this way - it is guaranteed that Java remains Java, and not something toad. The jdk$N-defer-request label does not disappear anywhere. Interestingly, what they do with people who violate the rule of tag removal - I suggest feeding them to guinea pigs.
However, this way you can see how many bugs are ported to JDK 13. Let's try this query:
project = JDK AND issuetype = Bug AND status in (Open, "In Progress", New) AND (labels in (jdk12-defer-request) AND labels not in (noreg-demo, noreg-doc, noreg-self)) AND (component not in (docs, globalization, infrastructure) OR component = infrastructure AND subcomponent = build) AND reporter != "Shadow Bug" ORDER BY priority, component, subcomponent, assignee Only 1 thing, JDK-8216039 : "TLS with BC and RSASSA-PSS breaks ECDHServerKeyExchange". Not much. If this argument still does not help, then, as your lawyer, I recommend trying a sedative.
And what about the bottom line?

It is clear that most features affect not the users (Java programmers), but the developers of the OpenJDK itself. Therefore, just in case, I divide the features into external and internal . Internal can be skipped, but I will be offended, I wrote so much text.
189: Shenandoah: A Low-Pause-Time Garbage Collector (Experimental)
External feature . In short, people do not like it when Java slows down, especially if the SLA requires responsiveness of the order of 10-500 milliseconds. Now we have a free low-gap GC that is trying to work closer to the left edge of this range. The trade-off is that we exchange CPU and RAM for reduced delays. Phase labeling and hip seal work in parallel with the live application threads. The remaining small pauses are due to the fact that you still need to search and update the roots of the object graph.
If none of the above makes any sense to you - it does not matter, Shenandoah just works , regardless of understanding or misunderstanding of the underlying processes.
Alexey Shipilyov, Kristina Flood and Roman Kennke are working on it - you need to try hard not to know about these people. If you generally understand how GC works, but you can’t imagine what the developer can do there, I recommend looking at the wonderful translation by Lyoshina of the article “Homemade garbage collector for OpenJDK” or on the JVM Anatomy Quarks series. This is very interesting .
Extremely important. Oracle decided not to ship Sheandoah with any of its release builds - with the one on jdk.java.net, or from the one on oracle.com. Considering that Shenandoah is one of the most important features of JDK 12, it is worthwhile to install some other official build, for example, from Azul .
230: Microbenchmark Suite
Internal feature . If you have ever tried to write microbench marks, then you know that this is done on JMH. JMH is a framework for creating, assembling, running and analyzing micro-benchmarks for Java and other JVM-languages, written by you understand who (all the coincidences are random). Unfortunately, not everything that is done in the world of "normal" applications can be applied inside the JDK. For example, we are unlikely to ever see normal Spring Framework code there.
Fortunately, since version 12 you can use at least JMH, and there is already a set of tests that are written on it. You can see it in jdk/jdk/test/micro/org/openjdk/bench (you can see directly in the browser, this path is a link).
For example, here’s what a GC test looks like.
Let me remind you that here we don’t have StackOverflow, and using code from copy-paste, here and hereafter, is prohibited without reading and following all the licenses from the corresponding file and the OpenJDK project in general, otherwise you will easily sue your socks on any court.
@BenchmarkMode(Mode.AverageTime) @OutputTimeUnit(TimeUnit.NANOSECONDS) @State(Scope.Thread) public class Alloc { public static final int LENGTH = 400; public static final int ARR_LEN = 100; public int largeLen = 100; public int smalllen = 6; @Benchmark public void testLargeConstArray(Blackhole bh) throws Exception { int localArrlen = ARR_LEN; for (int i = 0; i < LENGTH; i++) { Object[] tmp = new Object[localArrlen]; bh.consume(tmp); } } //... } 325: Switch Expressions (Preview)
External feature . Radically change your approach to writing endless switches over two screens long. Look:
Virgin Java Switch vs ...
int dayNum = -1; switch (day) { case MONDAY: case FRIDAY: case SUNDAY: dayNum = 6; break; case TUESDAY: dayNum = 7; break; case THURSDAY: case SATURDAY: dayNum = 8; break; case WEDNESDAY: dayNum = 9; break; } Why is bad : a lot of letters, you can skip the break (especially if you are a drug addict, or you suffer from ADHD).
... vs Chad Java Swtich Expression!
int dayNum = switch (day) { case MONDAY -> 0; case TUESDAY -> 1; default -> { int k = day.toString().length(); int result = f(k); break result; } }; Why is good : few letters, safe, convenient, new cool feature.
Bonus : if you are a sadist, then you will receive the deepest satisfaction, as thousands of IDE developers are now tormented with the support of this feature. Yes, lany , yes? You can catch him after the report on April 6th and gently ask him to give out all the dirty details.
This preview feature, just because it does not work! When compiling, injavacyou need to pass the command line options--enable-preview --release 12, and to run viajava- only the--enable-previewflag.
334: JVM Constants API
Internal feature . Developers want to manipulate class files. It is necessary to do this conveniently, and this is a statement of the problem. At least, Brian Goetz, who owns this JEP, said so :-) This is all part of a larger battlefield, but for now we will not go deeper.
In each Java class there is a so-called "constant pool", where there is a dump of either some values (like strings and ints), or runtime entities like classes and methods. Digging in this dump can be done using the ldc - "load costant" instruction, so all this junk is called loadable constants. There is a special case for invokedynamic, but it doesn't matter.
If we work with classfiles, we want to conveniently simulate bytecode instructions, and therefore - loadable constants. The first desire is to simply make the corresponding Java types, but how to present them with the "live" class, the structure of CONSTANT_Class_info ? Class objects depend on the correctness and consistency of loading classes, and with classes being loaded in Java, hellish bacchanalia is created. Let's start with the fact that not all classes can be loaded into a VM, but we still need to describe them!
I would like to somehow manage things like classes, methods and less well-known animals like method handles and dynamic constants, taking into account all these subtleties.
This is solved by introducing new value-based types of symbolic links (in the sense of JVMS 5.1 ), each of which describes a particular kind of constant. Describes purely nominally, in isolation from loading classes or access issues. They live in packages like java.lang.invoke.constant and they don’t ask, but you can take a look at the patch here .
340: One AArch64 Port, Not Two
External feature . Already in JDK 9 there was a strange situation when Oracle and Red Hat simultaneously put their ARM ports on combat duty. And here we see the end of the story: the 64-bit part of the Oracle port was removed from the Upstream.
It would be possible to delve into history for a long time, but there is a better way. BellSoft participated in the development of this JEP, and its office is located in St. Petersburg, next to the former office of Oracle.
Therefore, I immediately turned immediately to Alexey Voitylov, CTO of BellSoft:
"BellSoft releases Liberica JDK, which, in addition to x86 Linux / Windows / Mac and Solaris / SPARC, supports ARM. Starting from JDK 9 for ARM, we focused on improving the performance of the AARCH64 port for server applications and continued to support the 32-bit part of the ARM port for embedded solutions. Thus, at the time of the release of JDK 11, there was a situation when nobody supported the 64-bit part of the port from Oracle (including Oracle), and the OpenJDK community decided to remove it in order to focus on the AARCH64 port. At the moment it is more productive ( see, for example, JEP 315 , which we I integrated into JDK 11) and, starting with JDK 12, supports all the features present in the Oracle port (the last one, Minimal VM, I integrated in September), so I gladly helped Bob Vandette remove this rudiment in JDK 12. As a result, OpenJDK the community received one port on AARCH64 and one port on ARM32, which certainly facilitates their support. "
341: Default CDS Archives
Internal feature . The problem is that when launching Java applications, thousands of classes are loaded, which creates the feeling that Java significantly slows down at startup. But to whom to lie, this is not just a "feeling" - the way it is. To correct the problem since ancient times, various rituals are practiced.
Class Data Sharing is a feature that came to us from time immemorial as a commercial feature from JDK 8 Update 40. It allows you to pack all this startup debris into the archive of some kind of its own format (you do not need to know which one), then the launch speed applications increases. And after a while, JEP 310 appeared: Application Class-Data Sharing, which allowed not only system classes, but also application classes to do the same.
For JDK classes, it looks like this. First, we dump the classes with the java -Xshare:dump , and then launch the application, telling it to use this cache: java -Xshare:on -jar app.jar . Everything, the startup improved a little. So you knew about this feature? Many who do not know so far!
It looks strange here: why every time it is self-ritual to write -Xshare:dump , if the default result of executing this command is a bit predictable at the stage of creating the JDK distribution? According to the documentation , if the Java 8 distribution was installed using the installer, then right at the time of installation it should run the necessary commands for you. Like, the installer quietly mined in the corner. But why? And what to do with the distribution kit, which is distributed not in the form of an installer, but as a zipnik?
It's simple: starting with JDK 12, the CDS archive will be generated by the creators of the distribution, immediately after linking. Even for nightly builds (assuming they are 64-bit and native, not for cross-compiling).
Users do not even need to know about the presence of this feature, because, starting with JDK 11, -Xshare:auto enabled by default, and this archive will pick up automagically. Thus, the mere fact of updating to JDK 12 speeds up the launch of the application!
344: Abortable Mixed Collections for G1
Internal feature . Honestly, I do not understand anything in the work of G1 GC features explanation is unrewarding, because requires an understanding of the details of his work from both the explanatory and the understanding. For most people, GC is some kind of little devil from a snuffbox, which can be screwed up in case of anything. Therefore, the problem should be explained as something simpler.
Problem : G1 could work better.
Well, the problem is that GC is a compromise of many parameters, one of which is the duration of the pause. Sometimes the pause is too long, and then it’s good to be able to cancel it.
When does this happen? G1 does analyze the behavior of the application and selects the scope of work (expressed in the form of a collection set ) on the basis of its conclusions. When the scope of work is approved, G1 is taken to collect all the living objects in the collection set, stubbornly and non-stop, in one sitting. Sometimes it takes too much time. In essence, this means that G1 miscalculated the amount of work. You can fool him by suddenly changing the behavior of your application so that heuristics will work on top of rotten data when too many old regions fall into the collection set.
To get out of the situation, G1 was modified by the following mechanism: if the heuristics regularly selects the wrong amount of work, G1 switches to incremental garbage collection, step by step, and each next step (if it did not fit into the target runtime) can be canceled. It does not make sense to increment something incrementally (young regions), so all such work is allocated to the "mandatory" unit, which is still being carried out continuously.
What to do with the end user? Nothing, you need to upgrade to JDK 12, everything will be better by itself.
346: Promptly Return Unused Committed Memory from G1
Internal feature . The problem is that if we have a big hip that no one actively uses, it seems fair to get all this inactive memory back into the operating system. Before JDK 12, however, this did not happen.
To achieve its goal in terms of the admissible pause length, G1 produces a set of incremental, parallel, and multistage cycles. In JDK 11, it gives commited memory to the operating system only with full GC, or during the parallel labeling phase. If you connect logging (-Xloggc: /home/gc.log -XX: + PrintGCDetails -XX: + PrintGCDateStamps), then this phase is displayed like this:
8801.974: [G1Ergonomics (Concurrent Cycles) request concurrent cycle initiation, reason: occupancy higher than threshold, occupancy: 12582912000 bytes, allocation request: 0 bytes, threshold: 12562779330 bytes (45.00 %), source: end of GC] 8804.670: [G1Ergonomics (Concurrent Cycles) initiate concurrent cycle, reason: concurrent cycle initiation requested] 8805.612: [GC concurrent-mark-start] 8820.483: [GC concurrent-mark-end, 14.8711620 secs] The funny thing is that G1 as it can struggles with full stops, and the concurrent cycle starts only with frequent allocations and clogged heap. Our situation, when hip nobody touches - it is just the opposite. Situations when G1 will scratch to give memory to the operating system will occur very well, very rarely!
So everyone would have scored on this problem (“buy even more RAM, what a niggard!”), But for one thing - there are all kinds of clouds and containers in which this means insufficient utilization and loss of serious money. Look, what a cool report , filled to the brim with pain.
The decision was to teach G1 to behave well in this particular case, as Shenanda or GenCon from OpenJ9 already know how. It is necessary to determine the inadequate utilization of the hip and, accordingly, reduce its use. On some tests on Tomkate, this reduced the memory consumption by almost two times.
The bottom line is that the application is considered inactive, or if the interval has expired (in milliseconds) since the last build and there is no concurrent cycle, or if getloadavg() on a one-minute period showed a load below a certain threshold. As soon as some of this has happened, periodic garbage collection is launched - it will certainly not clean as well as a full assembly, but it will affect the application as little as possible.
You can poke it into this log:
(1) [6.084s][debug][gc,periodic ] Checking for periodic GC. [6.086s][info ][gc ] GC(13) Pause Young (Concurrent Start) (G1 Periodic Collection) 37M->36M(78M) 1.786ms (2) [9.087s][debug][gc,periodic ] Checking for periodic GC. [9.088s][info ][gc ] GC(15) Pause Young (Prepare Mixed) (G1 Periodic Collection) 9M->9M(32M) 0.722ms (3) [12.089s][debug][gc,periodic ] Checking for periodic GC. [12.091s][info ][gc ] GC(16) Pause Young (Mixed) (G1 Periodic Collection) 9M->5M(32M) 1.776ms (4) [15.092s][debug][gc,periodic ] Checking for periodic GC. [15.097s][info ][gc ] GC(17) Pause Young (Mixed) (G1 Periodic Collection) 5M->1M(32M) 4.142ms (5) [18.098s][debug][gc,periodic ] Checking for periodic GC. [18.100s][info ][gc ] GC(18) Pause Young (Concurrent Start) (G1 Periodic Collection) 1M->1M(32M) 1.685ms (6) [21.101s][debug][gc,periodic ] Checking for periodic GC. [21.102s][info ][gc ] GC(20) Pause Young (Concurrent Start) (G1 Periodic Collection) 1M->1M(32M) 0.868ms (7) [24.104s][debug][gc,periodic ] Checking for periodic GC. [24.104s][info ][gc ] GC(22) Pause Young (Concurrent Start) (G1 Periodic Collection) 1M->1M(32M) 0.778ms Understood? Me not. In JEP there is a detailed sign language translation of each line of the log, and how the algorithm works, and everything else.
"So what, why did I find out?" - you ask. Now we have two additional handles: G1PeriodicGCInterval and G1PeriodicGCSystemLoadThreshold , which can be turned when it becomes bad. After all, bad things will definitely be, this is Java, baby!
Results
As a result, we have a strong release in our hands - not a revolution, but an evolution focused on improving performance. Exactly half of the improvements relate to performance: three JEPs about GC and one about CDS, which promise to turn on by themselves, once you upgrade to JDK 12. In addition, we received one language feature (switch expressions), two new tools for JDK developers ( Constants API and tests for JMH), and now the community can better focus on a single 64-bit port on ARM.
In general, go to JDK 12 now, and may the Force be with you. You will need it.
Minute advertising. Very soon, on April 5-6, the JPoint conference will take place, which will bring together a huge number of people who know a lot about JDK and all sorts of new features. For example, there will definitely be Simon Ritter from Azul with the report "JDK 12: Pitfalls for the unwary" . The right place to discuss the latest release! More information about the JPoint can be found on the official website .
')
Source: https://habr.com/ru/post/444434/
All Articles