As one configuration change, PostgreSQL improved the performance of slow queries 50 times.
Hello, habrovchane! I bring to your attention a translation of the article “How a single PostgreSQL config change improved slow query performance by 50x” by Pavan Patibandla. It helped me a lot to improve PostgreSQL performance.
At Amplitude, our goal is to provide easy-to-use interactive product analytics so that everyone can find answers to their product questions. To ensure usability, Amplitude must provide these answers quickly. Therefore, when one of our clients complained about how long it took to load the drop-down list of event properties in the Amplitude user interface, we began to study the problem in detail.
By tracking the delay at different levels, we realized that it took 20 seconds to complete a specific PostgreSQL query. This came as a surprise to us, since both tables have indices in the joined column.
')
Slow request

The PostgreSQL execution plan for this query was unexpected for us. Although there are indexes in both tables, PostgreSQL decided to perform a Hash Join with sequential scanning of a large table. Sequential scanning of a large table took most of the time of the query.
Slow request execution plan

I initially suspected that this might be due to fragmentation. But after checking the data, I realized that the data in this table is only added and practically not removed from there. Since clearing a place with VACUUM doesn’t help much here, I started digging further. Then I tried the same request on another client with a good response time. To my surprise, the query plan looked completely different!
Execution plan for the same query on another client
Interestingly, application A only gained access to 10 times more data than application B, but the response time was 3,000 times longer.
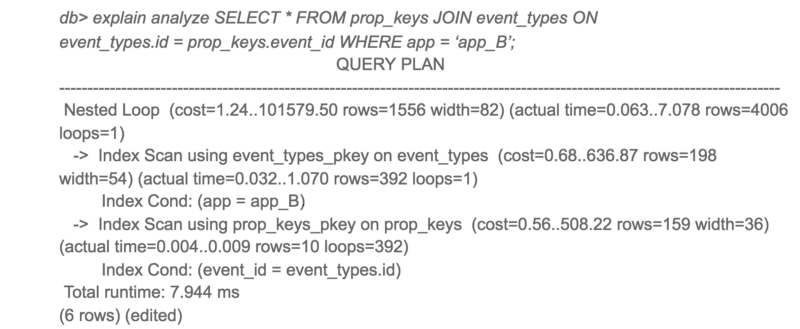
To see alternative PostgreSQL query plans, I turned off the hash connection and restarted the query.
Alternative execution plan for slow query

Here you go! The same request is completed 50 times faster when using a nested loop instead of a hash join. So why did PostgreSQL choose the worst plan for application A?
With a closer look at the estimated cost and actual execution time for both plans, the estimated cost-to-actual execution times were very different. The main culprit for this discrepancy was the cost estimate of a sequential scan. PostgreSQL calculated that sequential scans would be better than 4000+ index scans, but in reality, index scans were 50 times faster.
This led me to the configuration parameters random_page_cost and seq_page_cost . PostgreSQL default values 4 and 1 for random_page_cost , seq_page_cost , which are configured for HDD, where random disk access is more expensive than sequential access. However, these costs were inaccurate for our deployment using the gp2 EBS volume, which are solid-state drives. For our deployment, random and sequential access is almost the same.
I changed the value of random_page_cost to 1 and repeated the request. This time, PostgreSQL used Nested Loop, and the query ran 50 times faster. After the change, we also noticed a significant decrease in the maximum response time from PostgreSQL.
Overall slow query performance has improved significantly.

If you are using an SSD and are using PostgreSQL with a default configuration, I advise you to try setting up random_page_cost and seq_page_cost . You may be surprised by the strong performance improvements.
From myself I’ll add that I set the minimum parameters seq_page_cost = random_page_cost = 0.1 to give priority to data in memory (cache) over processor operations, since I have allocated a large amount of RAM for PostgreSQL (the size of RAM exceeds the size of the database on the disk). It's not very clear why the postgres community still uses the default settings that are relevant for a server with a small amount of RAM and HDD drives, and not for modern servers. I hope this will be fixed soon.
At Amplitude, our goal is to provide easy-to-use interactive product analytics so that everyone can find answers to their product questions. To ensure usability, Amplitude must provide these answers quickly. Therefore, when one of our clients complained about how long it took to load the drop-down list of event properties in the Amplitude user interface, we began to study the problem in detail.
By tracking the delay at different levels, we realized that it took 20 seconds to complete a specific PostgreSQL query. This came as a surprise to us, since both tables have indices in the joined column.
')
Slow request
The PostgreSQL execution plan for this query was unexpected for us. Although there are indexes in both tables, PostgreSQL decided to perform a Hash Join with sequential scanning of a large table. Sequential scanning of a large table took most of the time of the query.
Slow request execution plan
I initially suspected that this might be due to fragmentation. But after checking the data, I realized that the data in this table is only added and practically not removed from there. Since clearing a place with VACUUM doesn’t help much here, I started digging further. Then I tried the same request on another client with a good response time. To my surprise, the query plan looked completely different!
Execution plan for the same query on another client
Interestingly, application A only gained access to 10 times more data than application B, but the response time was 3,000 times longer.
To see alternative PostgreSQL query plans, I turned off the hash connection and restarted the query.
Alternative execution plan for slow query
Here you go! The same request is completed 50 times faster when using a nested loop instead of a hash join. So why did PostgreSQL choose the worst plan for application A?
With a closer look at the estimated cost and actual execution time for both plans, the estimated cost-to-actual execution times were very different. The main culprit for this discrepancy was the cost estimate of a sequential scan. PostgreSQL calculated that sequential scans would be better than 4000+ index scans, but in reality, index scans were 50 times faster.
This led me to the configuration parameters random_page_cost and seq_page_cost . PostgreSQL default values 4 and 1 for random_page_cost , seq_page_cost , which are configured for HDD, where random disk access is more expensive than sequential access. However, these costs were inaccurate for our deployment using the gp2 EBS volume, which are solid-state drives. For our deployment, random and sequential access is almost the same.
I changed the value of random_page_cost to 1 and repeated the request. This time, PostgreSQL used Nested Loop, and the query ran 50 times faster. After the change, we also noticed a significant decrease in the maximum response time from PostgreSQL.
Overall slow query performance has improved significantly.
If you are using an SSD and are using PostgreSQL with a default configuration, I advise you to try setting up random_page_cost and seq_page_cost . You may be surprised by the strong performance improvements.
From myself I’ll add that I set the minimum parameters seq_page_cost = random_page_cost = 0.1 to give priority to data in memory (cache) over processor operations, since I have allocated a large amount of RAM for PostgreSQL (the size of RAM exceeds the size of the database on the disk). It's not very clear why the postgres community still uses the default settings that are relevant for a server with a small amount of RAM and HDD drives, and not for modern servers. I hope this will be fixed soon.
Source: https://habr.com/ru/post/444018/
All Articles