How to delegate simple reports to the robot. Writing a bot in Python and Google BigQuery

Do you have tasks that are repeated from day to day, from week to week? For example, writing reports. You request data, analyze, visualize (make graphs, charts), and then send to the boss. But what if all this is automated?
In this tutorial, we will create a bot for Telegram, which will help automate reporting. And the cool thing is that the whole program will consist of only 50 lines of code! If you are creating a Telegram bot for the first time, then this post is also worth reading.
Skillbox recommends: Practical course Python-developer from scratch .
')
We remind: for all readers of "Habr" - a discount of 10,000 rubles when recording for any Skillbox course on the promotional code "Habr".
Getting started
Installing libraries
We will use google-cloud-bigquery to retrieve data from Google BigQuery. matplotlib , numpy and pandas help visualize the data. The python-telegram-bot will send the finished data to the Telegram.
pip3 install google-cloud-bigquery matplotlib numpy pandas python-telegram-bot
We connect Google BigQuery API
If we want to use the service, we need to connect the Google BigQuery API. To do this, go to the Google Developers Console and create a new project (or choose an existing one).
In the control panel, select ENABLE APIS AND SERVICES and look for the BigQuery API.
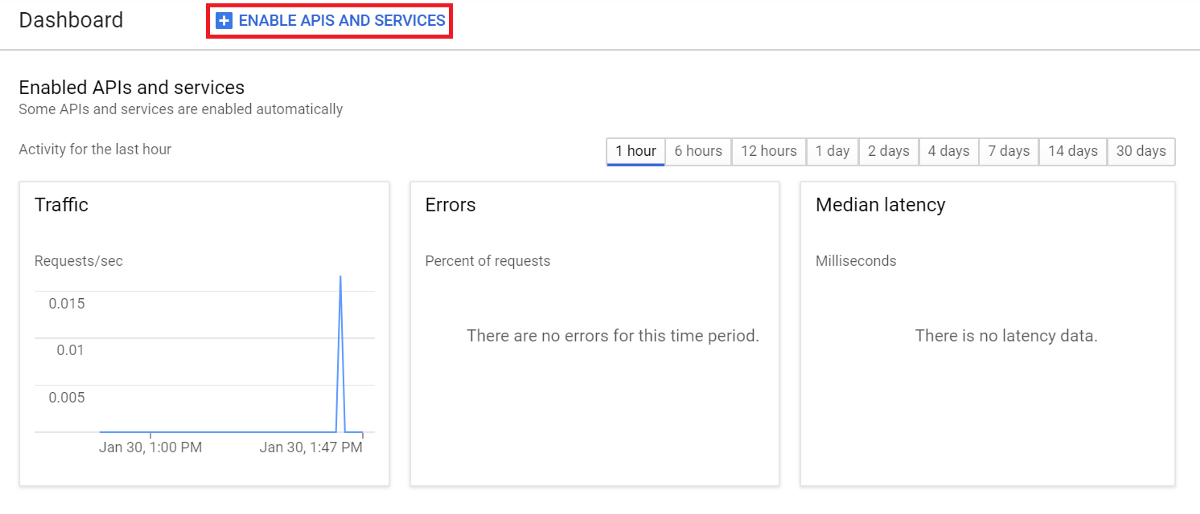
Select Enable to connect the API.

Create an account key
Go back to the Google Developers Console , select the Credentials tab, Create credentials and Service account key.
Then - New service account, and in the field Service account name enter a name.
From the Role drop-down list, select Project> Owner, then Create.
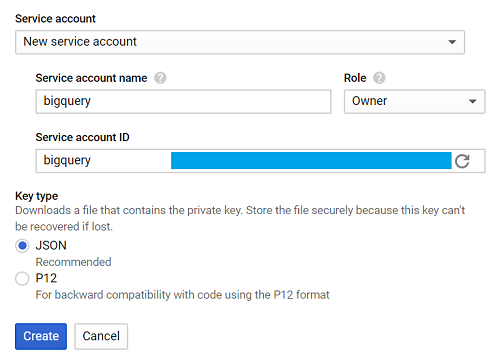
The file that will be automatically loaded is called creds.json.
Expose GOOGLE_APPLICATION_CREDENTIALS, indicating the path to creds.json in the terminal.
export GOOGLE_APPLICATION_CREDENTIALS = '[PATH_TO_CREDS.JSON]'
If everything went well, it's time to start writing a program.
Create application
For the tutorial we will use data from bigquery-public-data.stackoverflow, for our report we will select the number of daily publications.
Everything is quite simple.
Query the table -> Visualize the data -> Save the visualization -> Send the image
Let's create one function to define each stream.
Query to BigQuery
First we import the library.
from google.cloud import bigquery
Create a function called query_to_bigquery, where the parameter is query.
def query_to_bigquery(query): client = bigquery.Client() query_job = client.query(query) result = query_job.result() dataframe = result.to_dataframe() return dataframe This function will return the query as a data frame.
Visualize the data
To solve this problem, choose matplotlib.
import matplotlib.pyplot as plt
We need five parameters, where x is the data on the x axis, x_label is the name for the axis, y is the data of the y axis, y_label is the name for the axis, and title is the title of the entire visualization.
def visualize_bar_chart(x, x_label, y, y_label, title): plt.title(title) plt.xlabel(x_label) plt.ylabel(y_label) index = np.arange(len(x)) plt.xticks(index, x, fontsize=5, rotation=30) plt.bar(index, y) return plt Save the image
Now let's use two functions to create a visualization and save it.
We will send the number of daily published posts. At first we write request.
query = """ SELECT DATE(creation_date) date, COUNT(*) total_posts FROM `bigquery-public-data.stackoverflow.post_history` GROUP BY 1 HAVING date > DATE_SUB('2018-12-02', INTERVAL 14 DAY) ORDER BY 1 """ The query helps collect data for two weeks starting December 2, 2018.
We use this date because 2018-12-02 is the latest data recorded in bigquery-public-data.stackoverflow.post_history, otherwise you can use CURRENT_DATE () to get the most recent data.
Call the query_to_bigquery function to get the data.
dataframe = query_to_bigquery (query)
Then we use the date data column for the x axis, and the total_posts column for the y axis.
x = dataframe ['date']. tolist ()
y = dataframe ['total_posts']. tolist ()
Visualize with the visualize_bar_chart function and save as an image.
plt = visualize_bar_chart (x = x, x_label = 'Date', y = y, y_label = 'Total Posts', title = 'Daily Posts')
plt.savefig ('viz.png')
Wrap this code in a function called get_and_save_image.
def get_and_save_image(): query = """ SELECT DATE(creation_date) date, COUNT(*) total_posts FROM `bigquery-public-data.stackoverflow.post_history` GROUP BY 1 HAVING date > DATE_SUB('2018-12-02', INTERVAL 14 DAY) ORDER BY 1 """ dataframe = query_to_bigquery(query) x = dataframe['date'].tolist() y = dataframe['total_posts'].tolist() plt = visualize_bar_chart(x=x, x_label='Date', y=y, y_label='Total Posts', title='Daily Posts') plt.savefig('viz.png') We send the image
In order to send a report to the addressee, you need to know the chat_id parameter.
Use userinfobot and type / start. The bot responds with the necessary information, the chat_id is contained in the id field.
Now we create the send_image function. It will use the get_and_save_image function to get and save the image. And then we send everything to the right contact.
def send_image(bot, update): get_and_save_image() chat_id = 'CHAT_ID_RECEIVER' bot.send_photo(chat_id=chat_id, photo=open('viz.png','rb')) Main program
Finally, create another function, main, to run the application. Do not forget to change YOUR_TOKEN for a bot.
Remember: this program will send the image automatically at the time you specified. For example, we will send a report at nine in the morning every day.
def main(): updater = Updater('YOUR_TOKEN') updater.job_queue.run_daily(send_image, time=datetime.datetime.strptime('9:00AM', '%I:%M%p').time(), days=(0,1,2,3,4,5,6)) updater.start_polling() updater.idle() if __name__ == '__main__': main() As a result, our application will look like this:
from google.cloud import bigquery from telegram.ext import Updater import matplotlib.pyplot as plt import numpy as np import datetime def query_to_bigquery(query): client = bigquery.Client() query_job = client.query(query) result = query_job.result() dataframe = result.to_dataframe() return dataframe def visualize_bar_chart(x, x_label, y, y_label, title): plt.title(title) plt.xlabel(x_label) plt.ylabel(y_label) index = np.arange(len(x)) plt.xticks(index, x, fontsize=5, rotation=30) plt.bar(index, y) return plt def get_and_save_image(): query = """ SELECT DATE(creation_date) date, COUNT(*) total_posts FROM `bigquery-public-data.stackoverflow.post_history` GROUP BY 1 HAVING date > DATE_SUB('2018-12-02', INTERVAL 14 DAY) ORDER BY 1 """ dataframe = query_to_bigquery(query) x = dataframe['date'].tolist() y = dataframe['total_posts'].tolist() plt = visualize_bar_chart(x=x, x_label='Date', y=y, y_label='Total Posts', title='Daily Posts') plt.savefig('viz.png') def send_image(bot, update): get_and_save_image() chat_id = 'CHAT_ID_RECEIVER' bot.send_photo(chat_id=chat_id, photo=open('viz.png', 'rb')) def main(): updater = Updater('YOUR_TOKEN') updater.job_queue.run_daily(send_image, time=datetime.datetime.strptime('9:00AM', '%I:%M%p').time(), days=(0,1,2,3,4,5,6)) updater.start_polling() updater.idle() if __name__ == '__main__': main() Save the file and call it main.py.
We start the application by entering the following command in the terminal:
python3 main.py
All is ready. Now we have a robot consisting of 50 lines of code that generates reports without our intervention.
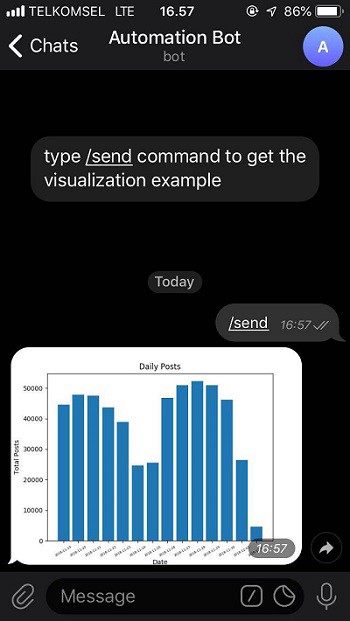
Check the bot from here by selecting the / send command.
You can get the finished code in my github .
Skillbox recommends:
- Two-year practical course "I am a web developer PRO" .
- Online course "C # developer with 0" .
- Practical annual course "PHP developer from 0 to PRO" .
Source: https://habr.com/ru/post/443702/
All Articles