Setting up a Kubernetes HA cluster on bare metal, monitoring, logs and usage examples. Part 3/3

Part 1/3 here .
Part 2/3 here .
Hello! And here is the third part of the Kubernetes leadership on bare metal! I will focus on monitoring the cluster and collecting logs, and we will also launch a test application to use pre-configured cluster components. Then we will conduct several stress tests and check the stability of this cluster scheme.
The Kubernetes Dashboard is the most popular tool that the Kubernetes community offers to provide a web interface and obtain cluster statistics. In fact, it is still at the development stage, but even now it can provide some additional data for troubleshooting applications and managing cluster resources.
The topic is somewhat controversial. Is it true that a web interface is needed to manage the cluster, or is it enough to use the kubectl console tool? Well, sometimes the options mentioned complement each other.
Let's turn our Kubernetes Dashboard and see. With standard Deploy, this dashboard will start only at the local host address. Thus, for disclosure, you must use the kubectl proxy command, but it is still available only on your local kubectl control device. Not bad from a security point of view, but I want to have access in the browser, outside the cluster, and I am ready to take a certain risk (after all, ssl with an effective token is used)
To apply my method, you need to slightly change the standard deployment file in the service section. To reveal this dashboard to an open address, use our load balancer.
We log into the machine system with the kubectl utility configured and create:
control# vi kube-dashboard.yaml # Copyright 2017 The Kubernetes Authors. # # Licensed under the Apache License, Version 2.0 (the "License"); # you may not use this file except in compliance with the License. # You may obtain a copy of the License at # # http://www.apache.org/licenses/LICENSE-2.0 # # Unless required by applicable law or agreed to in writing, software # distributed under the License is distributed on an "AS IS" BASIS, # WITHOUT WARRANTIES OR CONDITIONS OF ANY KIND, either express or implied. # See the License for the specific language governing permissions and # limitations under the License. # ------------------- Dashboard Secret ------------------- # apiVersion: v1 kind: Secret metadata: labels: k8s-app: kubernetes-dashboard name: kubernetes-dashboard-certs namespace: kube-system type: Opaque --- # ------------------- Dashboard Service Account ------------------- # apiVersion: v1 kind: ServiceAccount metadata: labels: k8s-app: kubernetes-dashboard name: kubernetes-dashboard namespace: kube-system --- # ------------------- Dashboard Role & Role Binding ------------------- # kind: Role apiVersion: rbac.authorization.k8s.io/v1 metadata: name: kubernetes-dashboard-minimal namespace: kube-system rules: # Allow Dashboard to create 'kubernetes-dashboard-key-holder' secret. - apiGroups: [""] resources: ["secrets"] verbs: ["create"] # Allow Dashboard to create 'kubernetes-dashboard-settings' config map. - apiGroups: [""] resources: ["configmaps"] verbs: ["create"] # Allow Dashboard to get, update and delete Dashboard exclusive secrets. - apiGroups: [""] resources: ["secrets"] resourceNames: ["kubernetes-dashboard-key-holder", "kubernetes-dashboard-certs"] verbs: ["get", "update", "delete"] # Allow Dashboard to get and update 'kubernetes-dashboard-settings' config map. - apiGroups: [""] resources: ["configmaps"] resourceNames: ["kubernetes-dashboard-settings"] verbs: ["get", "update"] # Allow Dashboard to get metrics from heapster. - apiGroups: [""] resources: ["services"] resourceNames: ["heapster"] verbs: ["proxy"] - apiGroups: [""] resources: ["services/proxy"] resourceNames: ["heapster", "http:heapster:", "https:heapster:"] verbs: ["get"] --- apiVersion: rbac.authorization.k8s.io/v1 kind: RoleBinding metadata: name: kubernetes-dashboard-minimal namespace: kube-system roleRef: apiGroup: rbac.authorization.k8s.io kind: Role name: kubernetes-dashboard-minimal subjects: - kind: ServiceAccount name: kubernetes-dashboard namespace: kube-system --- # ------------------- Dashboard Deployment ------------------- # kind: Deployment apiVersion: apps/v1 metadata: labels: k8s-app: kubernetes-dashboard name: kubernetes-dashboard namespace: kube-system spec: replicas: 1 revisionHistoryLimit: 10 selector: matchLabels: k8s-app: kubernetes-dashboard template: metadata: labels: k8s-app: kubernetes-dashboard spec: containers: - name: kubernetes-dashboard image: k8s.gcr.io/kubernetes-dashboard-amd64:v1.10.1 ports: - containerPort: 8443 protocol: TCP args: - --auto-generate-certificates # Uncomment the following line to manually specify Kubernetes API server Host # If not specified, Dashboard will attempt to auto discover the API server and connect # to it. Uncomment only if the default does not work. # - --apiserver-host=http://my-address:port volumeMounts: - name: kubernetes-dashboard-certs mountPath: /certs # Create on-disk volume to store exec logs - mountPath: /tmp name: tmp-volume livenessProbe: httpGet: scheme: HTTPS path: / port: 8443 initialDelaySeconds: 30 timeoutSeconds: 30 volumes: - name: kubernetes-dashboard-certs secret: secretName: kubernetes-dashboard-certs - name: tmp-volume emptyDir: {} serviceAccountName: kubernetes-dashboard # Comment the following tolerations if Dashboard must not be deployed on master tolerations: - key: node-role.kubernetes.io/master effect: NoSchedule --- # ------------------- Dashboard Service ------------------- # kind: Service apiVersion: v1 metadata: labels: k8s-app: kubernetes-dashboard name: kubernetes-dashboard namespace: kube-system spec: type: LoadBalancer ports: - port: 443 targetPort: 8443 selector: k8s-app: kubernetes-dashboard Then run:
control# kubectl create -f kube-dashboard.yaml control# kubectl get svc --namespace=kube-system kubernetes-dashboard LoadBalancer 10.96.164.141 192.168.0.240 443:31262/TCP 8h Well, as you can see, our BN added IP 192.168.0.240 for this service. Now try opening https://192.168.0.240 to view the Kubernetes Dashboard.
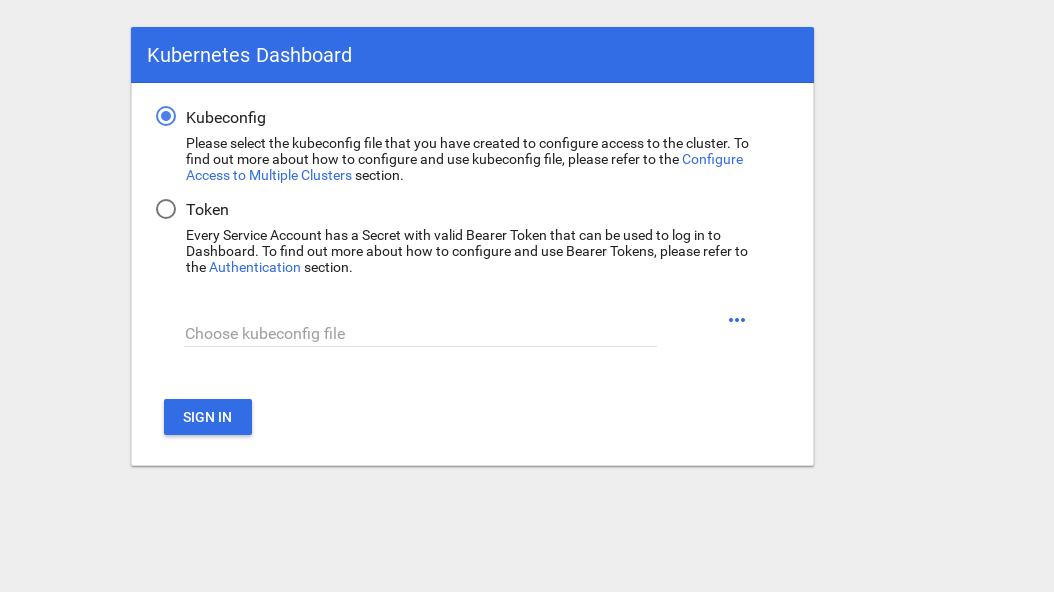
To gain access, there are 2 ways: use the admin.conf file from our master node, which we used earlier when setting up kubectl, or creating a special service account with a security token.
Let's create an admin user:
control# vi kube-dashboard-admin.yaml apiVersion: v1 kind: ServiceAccount metadata: name: admin-user namespace: kube-system --- apiVersion: rbac.authorization.k8s.io/v1beta1 kind: ClusterRoleBinding metadata: name: admin-user roleRef: apiGroup: rbac.authorization.k8s.io kind: ClusterRole name: cluster-admin subjects: - kind: ServiceAccount name: admin-user namespace: kube-system control# kubectl create -f kube-dashboard-admin.yaml serviceaccount/admin-user created clusterrolebinding.rbac.authorization.k8s.io/admin-user created Now you need a token to log in:
control# kubectl -n kube-system describe secret $(kubectl -n kube-system get secret | grep admin-user | awk '{print $1}') Name: admin-user-token-vfh66 Namespace: kube-system Labels: <none> Annotations: kubernetes.io/service-account.name: admin-user kubernetes.io/service-account.uid: 3775471a-3620-11e9-9800-763fc8adcb06 Type: kubernetes.io/service-account-token Data ==== ca.crt: 1025 bytes namespace: 11 bytes token: erJhbGciOiJSUzI1NiIsImtpZCI6IiJ9.eyJpc3MiOiJrdWJlcm5ldGVzL3NlcnZpY2VhY2NvdW50Iiwna3ViZXJuZXRlcy5pby9zZXJ2aWNlYWNjb3VudC9uYW1lc3BhY2UiOiJr dWJlLXN5c3RlbSIsImt1YmVybmV0ZXMuaW8vc2VydmljZWFjY291bnQvc2VjcmV0Lm5hbWUiOiJhZG1pbi11c2VmLXRva2VuLXZmaDY2Iiwia3ViZXJuZXRlcy5pby9zZXJ2aWNlYWNjb3VudC9zZ XJ2aWNlLWFjY291bnQubmFtZSI6ImFkbWluLXVzZXIiLCJrdWJlcm5ldGVzLmlvL3NlcnZpY2VhY2NvdW50L3NlcnZpY2UtYWNjb3VudC51aWQiOiIzNzc1NDcxYS0zNjIwLTExZTktOTgwMC03Nj NmYzhhZGNiMDYiLCJzdWIiOiJzeXN0ZW06c2VydmljZWFjY291bnQ6a3ViZS1zeXN0ZW06YWRtaW4tdXNlciJ9.JICASwxAJHFX8mLoSikJU1tbij4Kq2pneqAt6QCcGUizFLeSqr2R5x339ZR8W4 9cIsbZ7hbhFXCATQcVuWnWXe2dgXP5KE8ZdW9uvq96rm_JvsZz0RZO03UFRf8Exsss6GLeRJ5uNJNCAr8No5pmRMJo-_4BKW4OFDFxvSDSS_ZJaLMqJ0LNpwH1Z09SfD8TNW7VZqax4zuTSMX_yVS ts40nzh4-_IxDZ1i7imnNSYPQa_Oq9ieJ56Q-xuOiGu9C3Hs3NmhwV8MNAcniVEzoDyFmx4z9YYcFPCDIoerPfSJIMFIWXcNlUTPSMRA-KfjSb_KYAErVfNctwOVglgCISA Copy the token and paste it into the token field on the login screen.
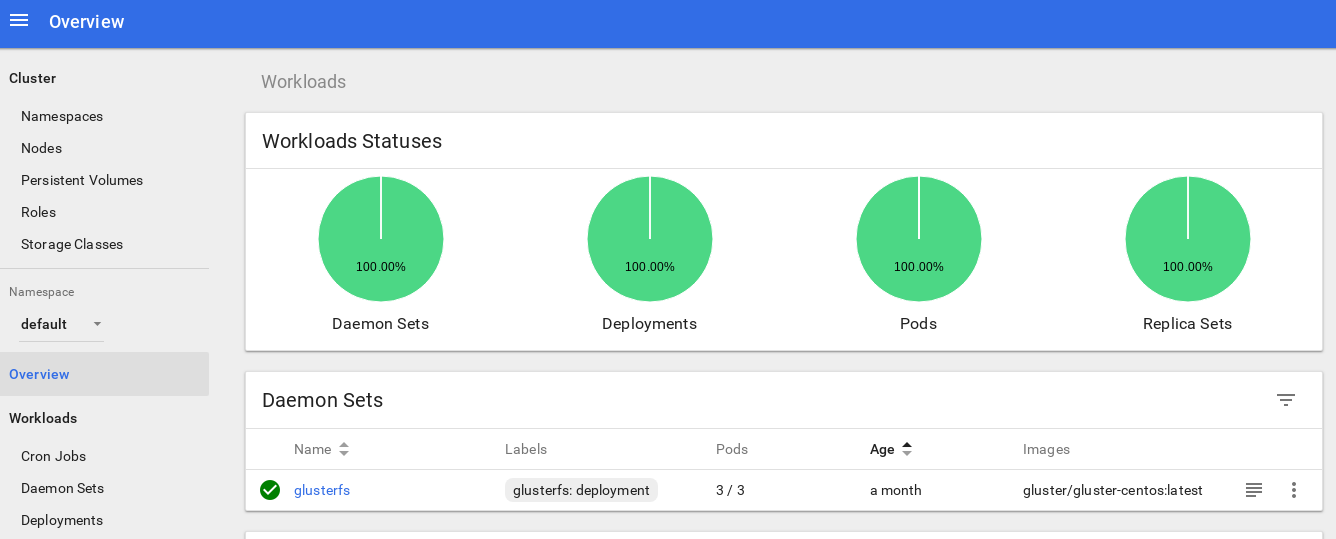
After logging in, you can explore the cluster a little deeper - I like this tool.
The next step towards deepening the monitoring system of our cluster is installing heapster .
Heapster allows you to monitor container cluster and analyze performance for Kubernetes (version v1.0.6 and higher). He offers the appropriate platforms.
This tool offers statistics on cluster usage through the console, and also adds more information about node and sub-resources to the Kubernetes Dashboard.
With its installation on “bare iron” there is a small complexity, and I needed to carry out some investigation: why the tool does not work in the original version - but I found the solution.
So let's continue and complement this addition:
control# vi heapster.yaml apiVersion: v1 kind: ServiceAccount metadata: name: heapster namespace: kube-system --- apiVersion: extensions/v1beta1 kind: Deployment metadata: name: heapster namespace: kube-system spec: replicas: 1 template: metadata: labels: task: monitoring k8s-app: heapster spec: serviceAccountName: heapster containers: - name: heapster image: gcr.io/google_containers/heapster-amd64:v1.4.2 imagePullPolicy: IfNotPresent command: - /heapster - --source=kubernetes.summary_api:''?useServiceAccount=true&kubeletHttps=true&kubeletPort=10250&insecure=true --- apiVersion: v1 kind: Service metadata: labels: task: monitoring # For use as a Cluster add-on (https://github.com/kubernetes/kubernetes/tree/master/cluster/addons) # If you are NOT using this as an addon, you should comment out this line. kubernetes.io/cluster-service: 'true' kubernetes.io/name: Heapster name: heapster namespace: kube-system spec: ports: - port: 80 targetPort: 8082 selector: k8s-app: heapster --- kind: ClusterRoleBinding apiVersion: rbac.authorization.k8s.io/v1beta1 metadata: name: heapster roleRef: apiGroup: rbac.authorization.k8s.io kind: ClusterRole name: system:heapster subjects: - kind: ServiceAccount name: heapster namespace: kube-system This is the most common standard deployment file from the Heapster community, with only a small difference: in order for it to work on our cluster, the string “ source = ” in the heapster section is changed as follows:
--source=kubernetes.summary_api:''?useServiceAccount=true&kubeletHttps=true&kubeletPort=10250&insecure=true In this description you will find all these options. I changed the kubelet port to 10250 and turned off ssl certificate verification (there was a slight problem with it).
We also need to add permissions to get node statistics for the Heapster RBAC role; add these few lines at the end of the role:
control# kubectl edit clusterrole system:heapster ...... ... - apiGroups: - "" resources: - nodes/stats verbs: - get As a result, your RBAC role should look like this:
# Please edit the object below. Lines beginning with a '#' will be ignored, # and an empty file will abort the edit. If an error occurs while saving this file will be # reopened with the relevant failures. # apiVersion: rbac.authorization.k8s.io/v1 kind: ClusterRole metadata: annotations: rbac.authorization.kubernetes.io/autoupdate: "true" creationTimestamp: "2019-02-22T18:58:32Z" labels: kubernetes.io/bootstrapping: rbac-defaults name: system:heapster resourceVersion: "6799431" selfLink: /apis/rbac.authorization.k8s.io/v1/clusterroles/system%3Aheapster uid: d99065b5-36d3-11e9-a7e6-763fc8adcb06 rules: - apiGroups: - "" resources: - events - namespaces - nodes - pods verbs: - get - list - watch - apiGroups: - extensions resources: - deployments verbs: - get - list - watch - apiGroups: - "" resources: - nodes/stats verbs: - get Well, now we will execute the command to make sure that the heapster deployment was successfully launched.
control# kubectl top node NAME CPU(cores) CPU% MEMORY(bytes) MEMORY% kube-master1 183m 9% 1161Mi 60% kube-master2 235m 11% 1130Mi 59% kube-worker1 189m 4% 1216Mi 41% kube-worker2 218m 5% 1290Mi 44% kube-worker3 181m 4% 1305Mi 44% Well, if you got some data at the output, then everything is done correctly. Go back to our dashboard page and check out the new graphs that are now available.
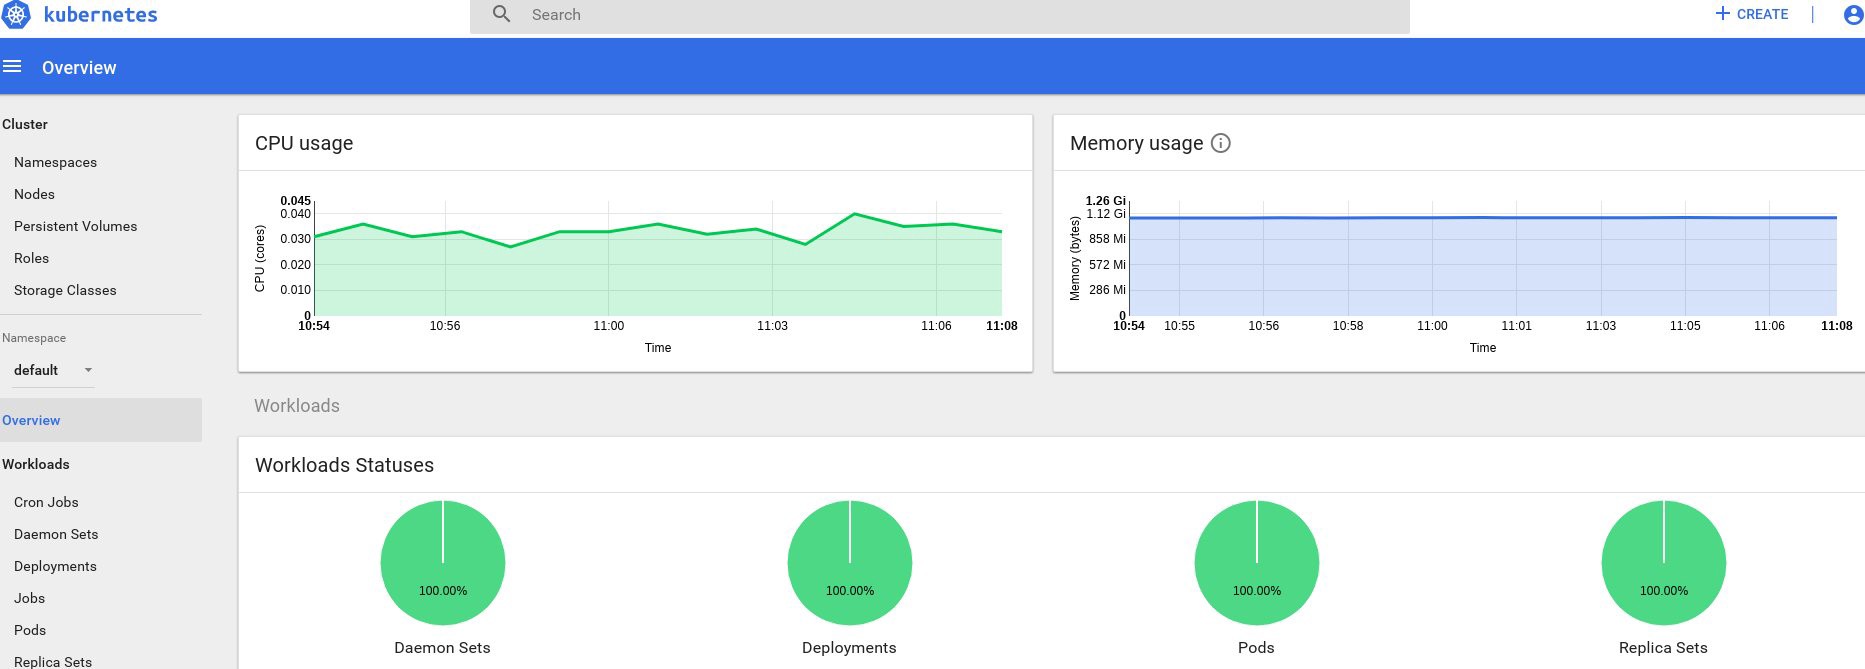

From this point on, we can also track the actual use of resources for the nodes of the cluster, pods, etc.
If this is not enough, you can further improve the statistics by adding InfluxDB + Grafana. This will add the ability to draw your own Grafana panels.
We will use this version of the InfluxDB + Grafana installation from the Heapster Git page, but, as usual, we will make corrections. Since we previously configured the heapster deploy, we only need to add Grafana and InfluxDB, and then modify the existing heapster so that it also enters the metrics in Influx.
Well, let's create InfluxDB and Grafana deployments:
control# vi influxdb.yaml apiVersion: extensions/v1beta1 kind: Deployment metadata: name: monitoring-influxdb namespace: kube-system spec: replicas: 1 template: metadata: labels: task: monitoring k8s-app: influxdb spec: containers: - name: influxdb image: k8s.gcr.io/heapster-influxdb-amd64:v1.5.2 volumeMounts: - mountPath: /data name: influxdb-storage volumes: - name: influxdb-storage emptyDir: {} --- apiVersion: v1 kind: Service metadata: labels: task: monitoring # For use as a Cluster add-on (https://github.com/kubernetes/kubernetes/tree/master/cluster/addons) # If you are NOT using this as an addon, you should comment out this line. kubernetes.io/cluster-service: 'true' kubernetes.io/name: monitoring-influxdb name: monitoring-influxdb namespace: kube-system spec: ports: - port: 8086 targetPort: 8086 selector: k8s-app: influxdb Next is Grafana, and don't forget to change the service setting to enable the MetaLB load balancer and get an external IP address for the Grafana service.
control# vi grafana.yaml apiVersion: extensions/v1beta1 kind: Deployment metadata: name: monitoring-grafana namespace: kube-system spec: replicas: 1 template: metadata: labels: task: monitoring k8s-app: grafana spec: containers: - name: grafana image: k8s.gcr.io/heapster-grafana-amd64:v5.0.4 ports: - containerPort: 3000 protocol: TCP volumeMounts: - mountPath: /etc/ssl/certs name: ca-certificates readOnly: true - mountPath: /var name: grafana-storage env: - name: INFLUXDB_HOST value: monitoring-influxdb - name: GF_SERVER_HTTP_PORT value: "3000" # The following env variables are required to make Grafana accessible via # the kubernetes api-server proxy. On production clusters, we recommend # removing these env variables, setup auth for grafana, and expose the grafana # service using a LoadBalancer or a public IP. - name: GF_AUTH_BASIC_ENABLED value: "false" - name: GF_AUTH_ANONYMOUS_ENABLED value: "true" - name: GF_AUTH_ANONYMOUS_ORG_ROLE value: Admin - name: GF_SERVER_ROOT_URL # If you're only using the API Server proxy, set this value instead: # value: /api/v1/namespaces/kube-system/services/monitoring-grafana/proxy value: / volumes: - name: ca-certificates hostPath: path: /etc/ssl/certs - name: grafana-storage emptyDir: {} --- apiVersion: v1 kind: Service metadata: labels: # For use as a Cluster add-on (https://github.com/kubernetes/kubernetes/tree/master/cluster/addons) # If you are NOT using this as an addon, you should comment out this line. kubernetes.io/cluster-service: 'true' kubernetes.io/name: monitoring-grafana name: monitoring-grafana namespace: kube-system spec: # In a production setup, we recommend accessing Grafana through an external Loadbalancer # or through a public IP. # type: LoadBalancer # You could also use NodePort to expose the service at a randomly-generated port # type: NodePort type: LoadBalancer ports: - port: 80 targetPort: 3000 selector: k8s-app: grafana And create them:
control# kubectl create -f influxdb.yaml deployment.extensions/monitoring-influxdb created service/monitoring-influxdb created control# kubectl create -f grafana.yaml deployment.extensions/monitoring-grafana created service/monitoring-grafana created It's time to change the heapster deploy and add the InfluxDB connection to it; you need to add just one line:
- --sink=influxdb:http://monitoring-influxdb.kube-system.svc:8086 Edit the heapster patch:
control# kubectl get deployments --namespace=kube-system NAME READY UP-TO-DATE AVAILABLE AGE coredns 2/2 2 2 49d heapster 1/1 1 1 2d12h kubernetes-dashboard 1/1 1 1 3d21h monitoring-grafana 1/1 1 1 115s monitoring-influxdb 1/1 1 1 2m18s control# kubectl edit deployment heapster --namespace=kube-system ... beginning bla bla bla spec: containers: - command: - /heapster - --source=kubernetes.summary_api:''?useServiceAccount=true&kubeletHttps=true&kubeletPort=10250&insecure=true - --sink=influxdb:http://monitoring-influxdb.kube-system.svc:8086 image: gcr.io/google_containers/heapster-amd64:v1.4.2 imagePullPolicy: IfNotPresent .... end Now we’ll find the external IP address of the Grafana service and log in to the system inside it:
control# kubectl get svc --namespace=kube-system NAME TYPE CLUSTER-IP EXTERNAL-IP PORT(S) AGE ..... some other services here monitoring-grafana LoadBalancer 10.98.111.200 192.168.0.241 80:32148/TCP 18m Open http://192.168.0.241 in the browser, for the first time use the admin / admin credentials:

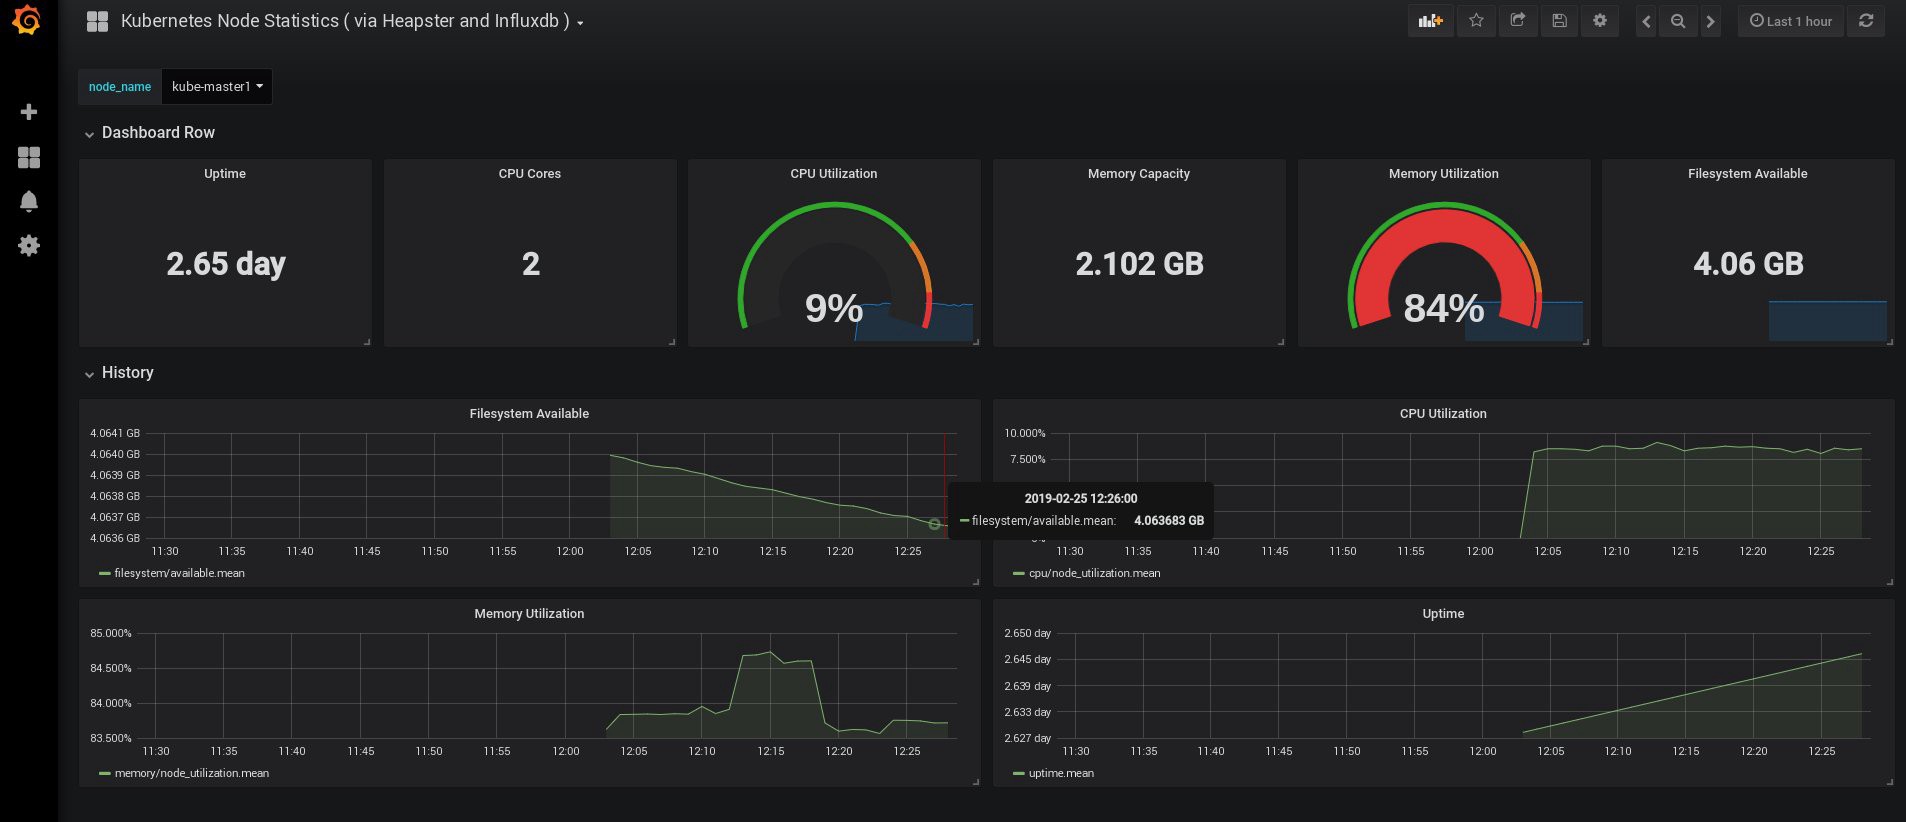
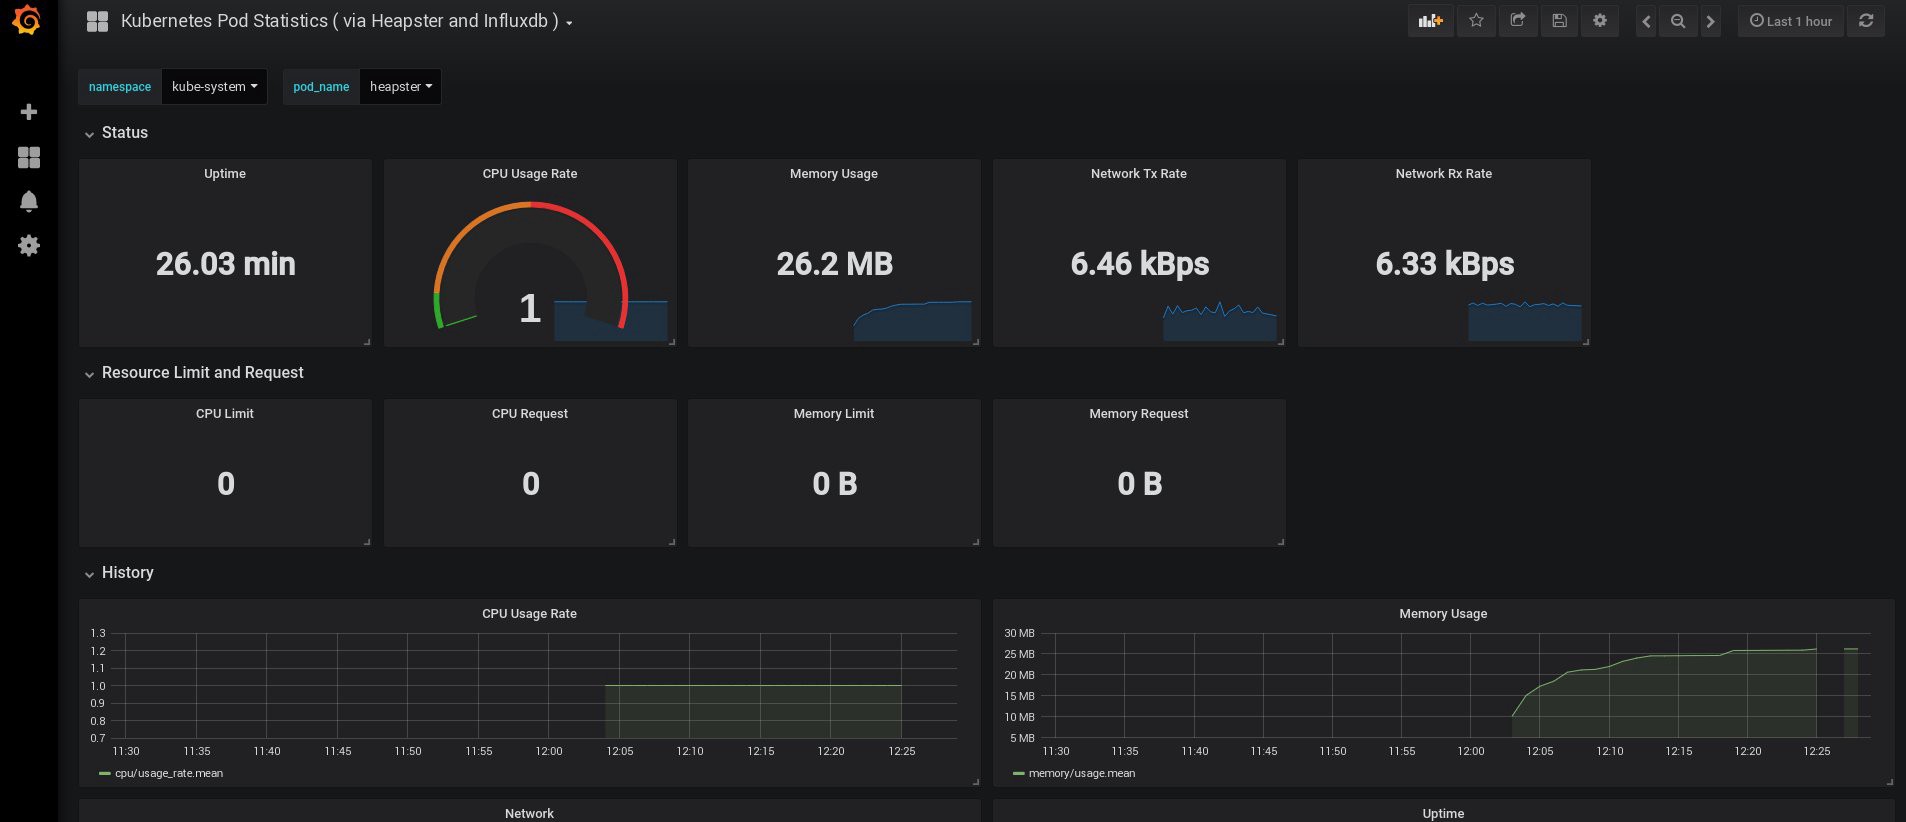
When I logged in, my Grafana was empty, but fortunately, we can get all the necessary dashboards from grafana.com . You need to import panels No. 3649 and 3646. When importing, select the correct data source.
After that, monitor the use of resources of nodes and hearths and, of course, create your own unique dashboard.
Well, on it we will finish with monitoring now; The following elements that we may need are the logs of the storage of our applications and cluster. There are several ways to do this, and they are all described in the Kubernetes documentation . Based on my own experience, I prefer to use external installations of the Elasticsearch and Kibana services, as well as only the registration agents that run on each Kubernetes work node. This will protect the cluster from overloads associated with a large number of logs and other problems, and will allow you to receive logs, even if the cluster becomes completely non-functional.
The most popular stack for collecting logs for Kubernetes fans is Elasticsearch, Fluentd and Kibana (EFK stack). In this example, we will run Elasticsearch and Kibana on the external node (you can use the existing ELK stack), and also Fluentd inside our cluster as a daemonset for each node as a log collection agent.
I’ll skip the part about creating a VM with Elasticsearch and Kibana; This is quite a popular topic, so you can find a lot of materials on how best to do it. For example, in my own article . Simply remove the fragment of the logstash configuration from the docker-compose.yml file , and also remove 127.0.0.1 from the ports section of elasticsearch.
After that, you should have a working elasticsearch connected to the VM-IP port: 9200. For additional security, configure login: pass or security keys between fluentd and elasticsearch. However, I often protect them simply by using iptables rules.
All that is left to do is to create a fluentd daemonset in Kubernetes and specify the external address of the elasticsearch node: port in the configuration.
We use the official Kubernetes supplement with the yaml configuration from here , with a few modifications:
control# vi fluentd-es-ds.yaml apiVersion: v1 kind: ServiceAccount metadata: name: fluentd-es namespace: kube-system labels: k8s-app: fluentd-es kubernetes.io/cluster-service: "true" addonmanager.kubernetes.io/mode: Reconcile --- kind: ClusterRole apiVersion: rbac.authorization.k8s.io/v1 metadata: name: fluentd-es labels: k8s-app: fluentd-es kubernetes.io/cluster-service: "true" addonmanager.kubernetes.io/mode: Reconcile rules: - apiGroups: - "" resources: - "namespaces" - "pods" verbs: - "get" - "watch" - "list" --- kind: ClusterRoleBinding apiVersion: rbac.authorization.k8s.io/v1 metadata: name: fluentd-es labels: k8s-app: fluentd-es kubernetes.io/cluster-service: "true" addonmanager.kubernetes.io/mode: Reconcile subjects: - kind: ServiceAccount name: fluentd-es namespace: kube-system apiGroup: "" roleRef: kind: ClusterRole name: fluentd-es apiGroup: "" --- apiVersion: apps/v1 kind: DaemonSet metadata: name: fluentd-es-v2.4.0 namespace: kube-system labels: k8s-app: fluentd-es version: v2.4.0 kubernetes.io/cluster-service: "true" addonmanager.kubernetes.io/mode: Reconcile spec: selector: matchLabels: k8s-app: fluentd-es version: v2.4.0 template: metadata: labels: k8s-app: fluentd-es kubernetes.io/cluster-service: "true" version: v2.4.0 # This annotation ensures that fluentd does not get evicted if the node # supports critical pod annotation based priority scheme. # Note that this does not guarantee admission on the nodes (#40573). annotations: scheduler.alpha.kubernetes.io/critical-pod: '' seccomp.security.alpha.kubernetes.io/pod: 'docker/default' spec: priorityClassName: system-node-critical serviceAccountName: fluentd-es containers: - name: fluentd-es image: k8s.gcr.io/fluentd-elasticsearch:v2.4.0 env: - name: FLUENTD_ARGS value: --no-supervisor -q resources: limits: memory: 500Mi requests: cpu: 100m memory: 200Mi volumeMounts: - name: varlog mountPath: /var/log - name: varlibdockercontainers mountPath: /var/lib/docker/containers readOnly: true - name: config-volume mountPath: /etc/fluent/config.d terminationGracePeriodSeconds: 30 volumes: - name: varlog hostPath: path: /var/log - name: varlibdockercontainers hostPath: path: /var/lib/docker/containers - name: config-volume configMap: name: fluentd-es-config-v0.2.0 Then we make a specific configuration of fluentd:
control# vi fluentd-es-configmap.yaml kind: ConfigMap apiVersion: v1 metadata: name: fluentd-es-config-v0.2.0 namespace: kube-system labels: addonmanager.kubernetes.io/mode: Reconcile data: system.conf: |- <system> root_dir /tmp/fluentd-buffers/ </system> containers.input.conf: |- @id fluentd-containers.log @type tail path /var/log/containers/*.log pos_file /var/log/es-containers.log.pos tag raw.kubernetes.* read_from_head true <parse> @type multi_format <pattern> format json time_key time time_format %Y-%m-%dT%H:%M:%S.%NZ </pattern> <pattern> format /^(?<time>.+) (?<stream>stdout|stderr) [^ ]* (?<log>.*)$/ time_format %Y-%m-%dT%H:%M:%S.%N%:z </pattern> </parse> # Detect exceptions in the log output and forward them as one log entry. <match raw.kubernetes.**> @id raw.kubernetes @type detect_exceptions remove_tag_prefix raw message log stream stream multiline_flush_interval 5 max_bytes 500000 max_lines 1000 </match> # Concatenate multi-line logs <filter **> @id filter_concat @type concat key message multiline_end_regexp /\n$/ separator "" </filter> # Enriches records with Kubernetes metadata <filter kubernetes.**> @id filter_kubernetes_metadata @type kubernetes_metadata </filter> # Fixes json fields in Elasticsearch <filter kubernetes.**> @id filter_parser @type parser key_name log reserve_data true remove_key_name_field true <parse> @type multi_format <pattern> format json </pattern> <pattern> format none </pattern> </parse> </filter> output.conf: |- <match **> @id elasticsearch @type elasticsearch @log_level info type_name _doc include_tag_key true host 192.168.1.253 port 9200 logstash_format true <buffer> @type file path /var/log/fluentd-buffers/kubernetes.system.buffer flush_mode interval retry_type exponential_backoff flush_thread_count 2 flush_interval 5s retry_forever retry_max_interval 30 chunk_limit_size 2M queue_limit_length 8 overflow_action block </buffer> </match> The configuration is elementary, but it is quite enough for a quick launch; it will collect system and application logs. If you need something more complicated, you can read the official documentation about fluentd plugins and Kubernetes configurations.
Now let's create a fluentd daemonset in our cluster:
control# kubectl create -f fluentd-es-ds.yaml serviceaccount/fluentd-es created clusterrole.rbac.authorization.k8s.io/fluentd-es created clusterrolebinding.rbac.authorization.k8s.io/fluentd-es created daemonset.apps/fluentd-es-v2.4.0 created control# kubectl create -f fluentd-es-configmap.yaml configmap/fluentd-es-config-v0.2.0 created Make sure that all fluentd and other resources are successfully launched, then open Kibana. In Kibana, find and add a new index from fluentd. If you find something, then everything is done correctly, if not - check the previous steps and re-create the daemonset or edit the configmap:

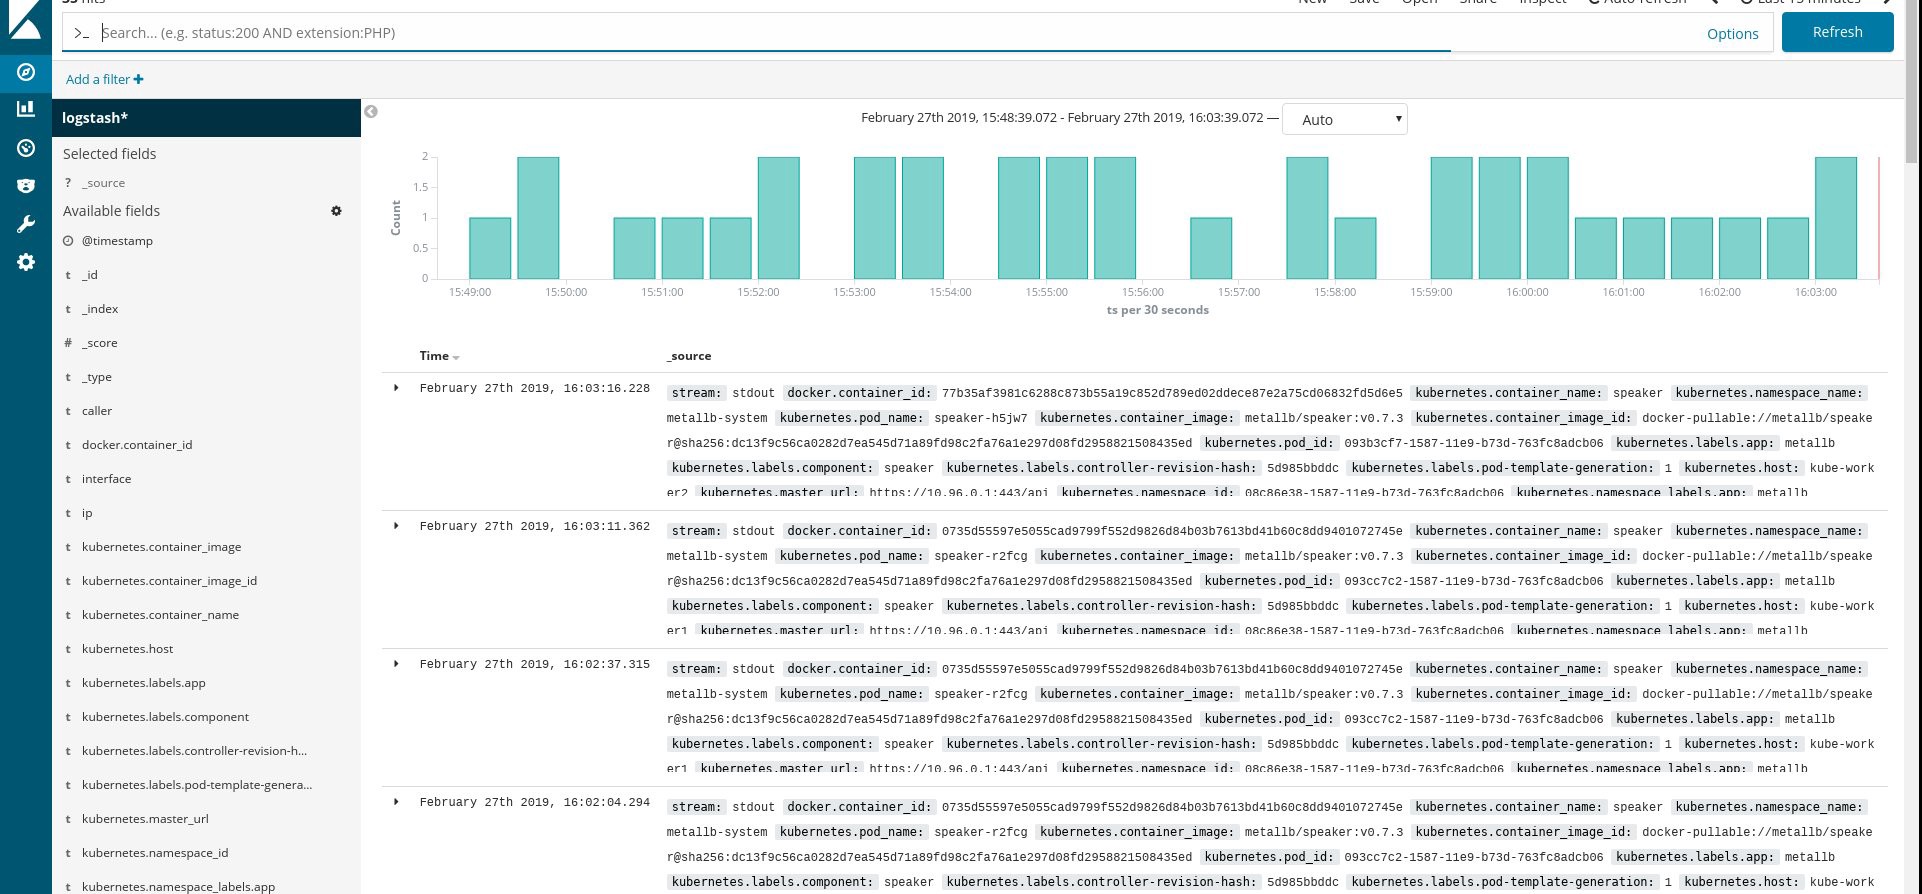
Great, now that we get logs from the cluster, you can create any dashboard. Of course, the configuration is the simplest, so it should probably be changed for you. The main goal was to show how this is done.
After completing all the previous steps, we got a really good Kubernetes cluster ready for work. It's time to put some test application into it and see what happens.
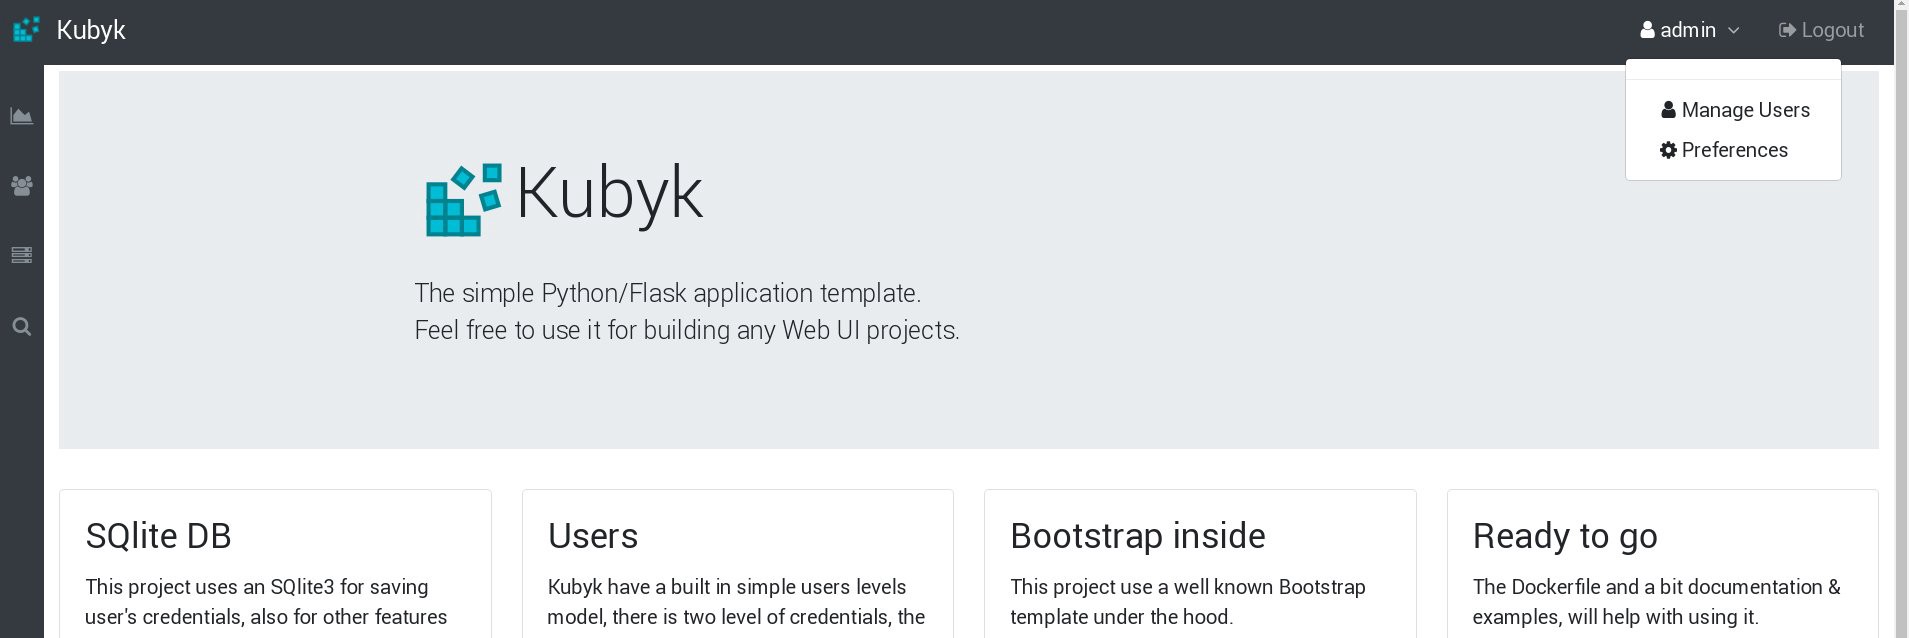
For this example, let's take my small Python / Flask Kubyk application, which already has a Docker container, so take it from the open docker registry. Now we will add an external database file to this application - for this we use the configured GlusterFS repository.
First, create a new pvc volume (permanent volume request) for this application, where we will store the SQLite database with user credentials. You can use the previously created memory class from part 2 of this manual.
control# mkdir kubyk && cd kubyk control# vi kubyk-pvc.yaml kind: PersistentVolumeClaim apiVersion: v1 metadata: name: kubyk annotations: volume.beta.kubernetes.io/storage-class: "slow" spec: accessModes: - ReadWriteOnce resources: requests: storage: 1Gi control# kubectl create -f kubyk-pvc.yaml Having created a new PVC for the application, we are ready to deploy.
control# vi kubyk-deploy.yaml apiVersion: apps/v1 kind: Deployment metadata: name: kubyk-deployment spec: selector: matchLabels: app: kubyk replicas: 1 template: metadata: labels: app: kubyk spec: containers: - name: kubyk image: ratibor78/kubyk ports: - containerPort: 80 volumeMounts: - name: kubyk-db mountPath: /kubyk/sqlite volumes: - name: kubyk-db persistentVolumeClaim: claimName: kubyk control# vi kubyk-service.yaml apiVersion: v1 kind: Service metadata: name: kubyk spec: type: LoadBalancer selector: app: kubyk ports: - port: 80 name: http Now, let's create the deployment and service:
control# kubectl create -f kubyk-deploy.yaml deployment.apps/kubyk-deployment created control# kubectl create -f kubyk-service.yaml service/kubyk created Check the new IP address assigned to the service, as well as the status of the submission:
control# kubectl get po NAME READY STATUS RESTARTS AGE glusterfs-2wxk7 1/1 Running 1 2d1h glusterfs-5dtdj 1/1 Running 1 41d glusterfs-zqxwt 1/1 Running 0 2d1h heketi-b8c5f6554-f92rn 1/1 Running 0 8d kubyk-deployment-75d5447d46-jrttp 1/1 Running 0 11s control# kubectl get svc NAME TYPE CLUSTER-IP EXTERNAL-IP PORT(S) AGE ... some text.. kubyk LoadBalancer 10.109.105.224 192.168.0.242 80:32384/TCP 10s So, it seems that we have successfully launched a new application; If we open the browser's IP address http://192.168.0.242 , we should see the login page of this application. You can use the admin / admin credentials to log in to the system, but if we try to log in at this stage, we will get an error, because there is no available database yet.
Here is an example of a log error message from the pod on the Kubernetes dashboard:
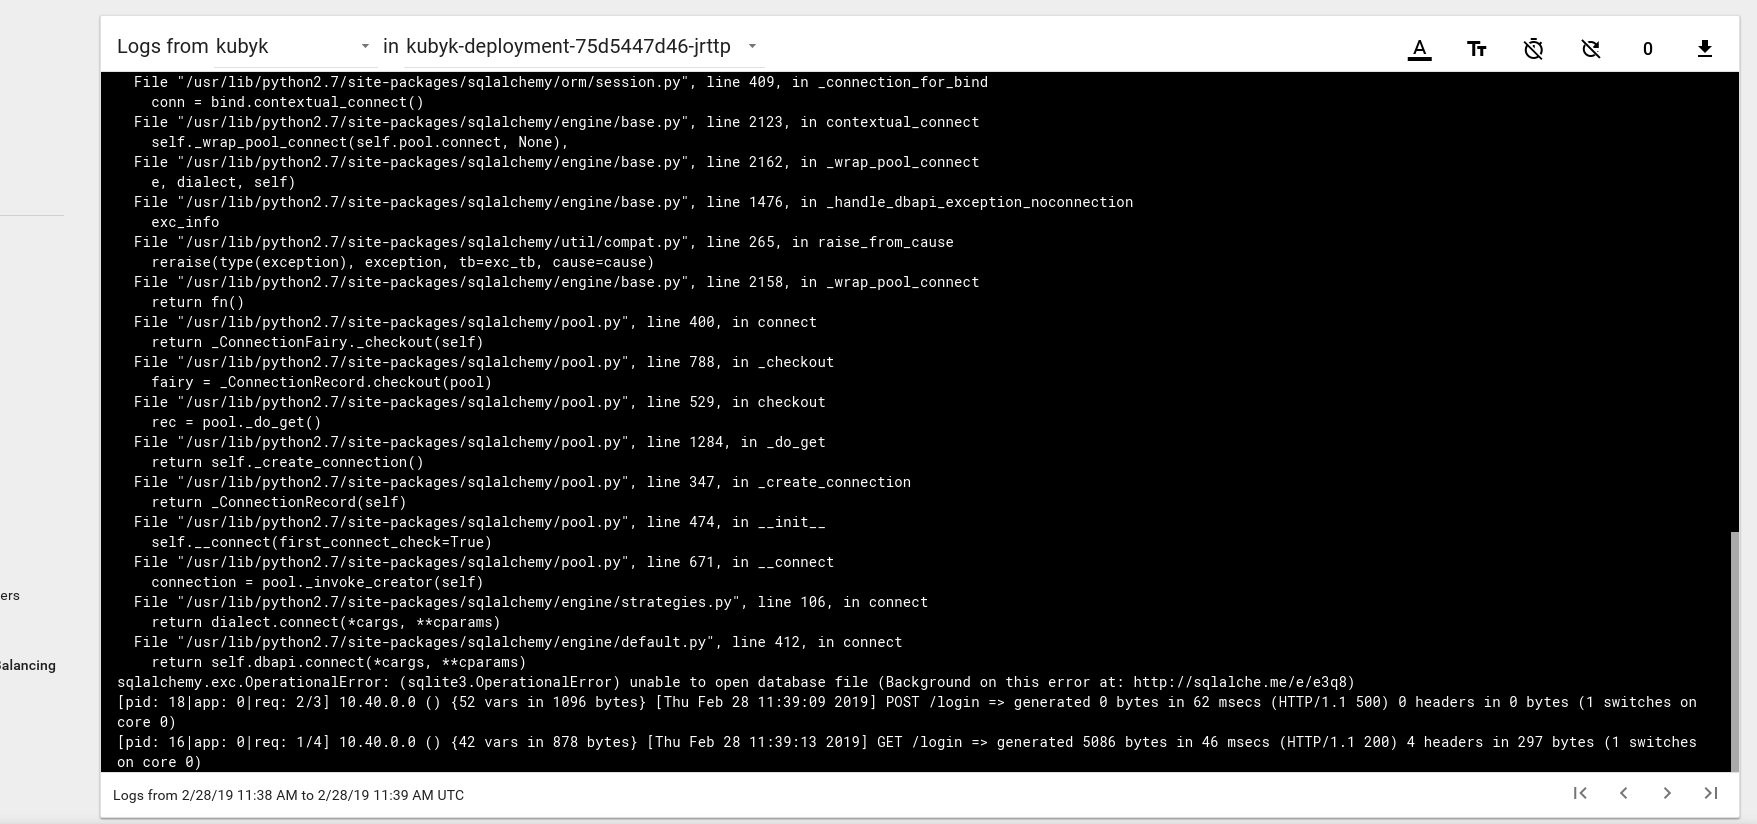
To fix this, you need to copy the SQlite DB file from my git repository to the previously created pvc volume. The application will start using this database.
control# git pull https://github.com/ratibor78/kubyk.git control# kubectl cp ./kubyk/sqlite/database.db kubyk-deployment-75d5447d46-jrttp:/kubyk/sqlite We use the kubectl cp command from under the application to copy this file into the volume.
You must also give the nginx user access to this directory with write access; My application is launched through the user nginx using supervisord .
control# kubectl exec -ti kubyk-deployment-75d5447d46-jrttp -- chown -R nginx:nginx /kubyk/sqlite/ Try to log in again:
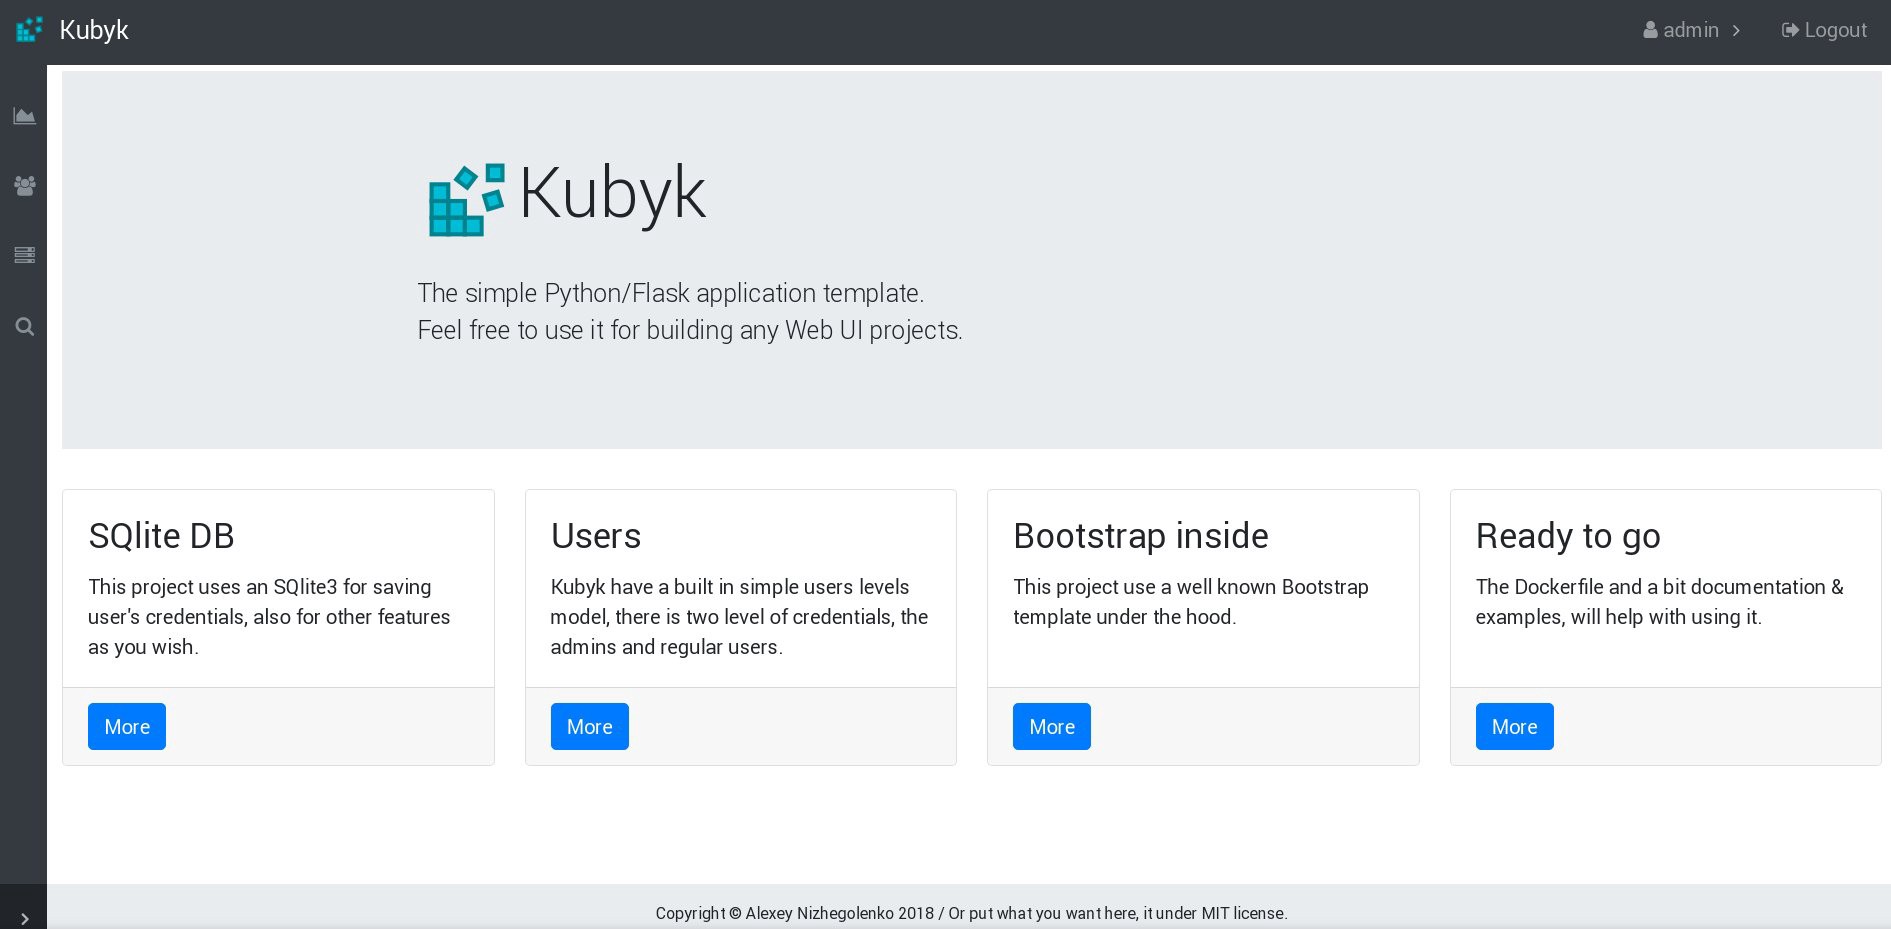
Great, now our application works correctly, and we can scale kubyk deploy to 3 replicas, for example, to put one copy of the application in one working node. Since we previously created a pvc volume, all our scams with application replicas will use the same database, and the service will thus distribute the traffic between replicas in a round-robin fashion.
control# kubectl get deployments NAME READY UP-TO-DATE AVAILABLE AGE heketi 1/1 1 1 39d kubyk-deployment 1/1 1 1 4h5m control# kubectl scale deployments kubyk-deployment --replicas=3 deployment.extensions/kubyk-deployment scaled control# kubectl get po NAME READY STATUS RESTARTS AGE glusterfs-2wxk7 1/1 Running 1 2d5h glusterfs-5dtdj 1/1 Running 21 41d glusterfs-zqxwt 1/1 Running 0 2d5h heketi-b8c5f6554-f92rn 1/1 Running 0 8d kubyk-deployment-75d5447d46-bdnqx 1/1 Running 0 26s kubyk-deployment-75d5447d46-jrttp 1/1 Running 0 4h7m kubyk-deployment-75d5447d46-wz9xz 1/1 Running 0 26s 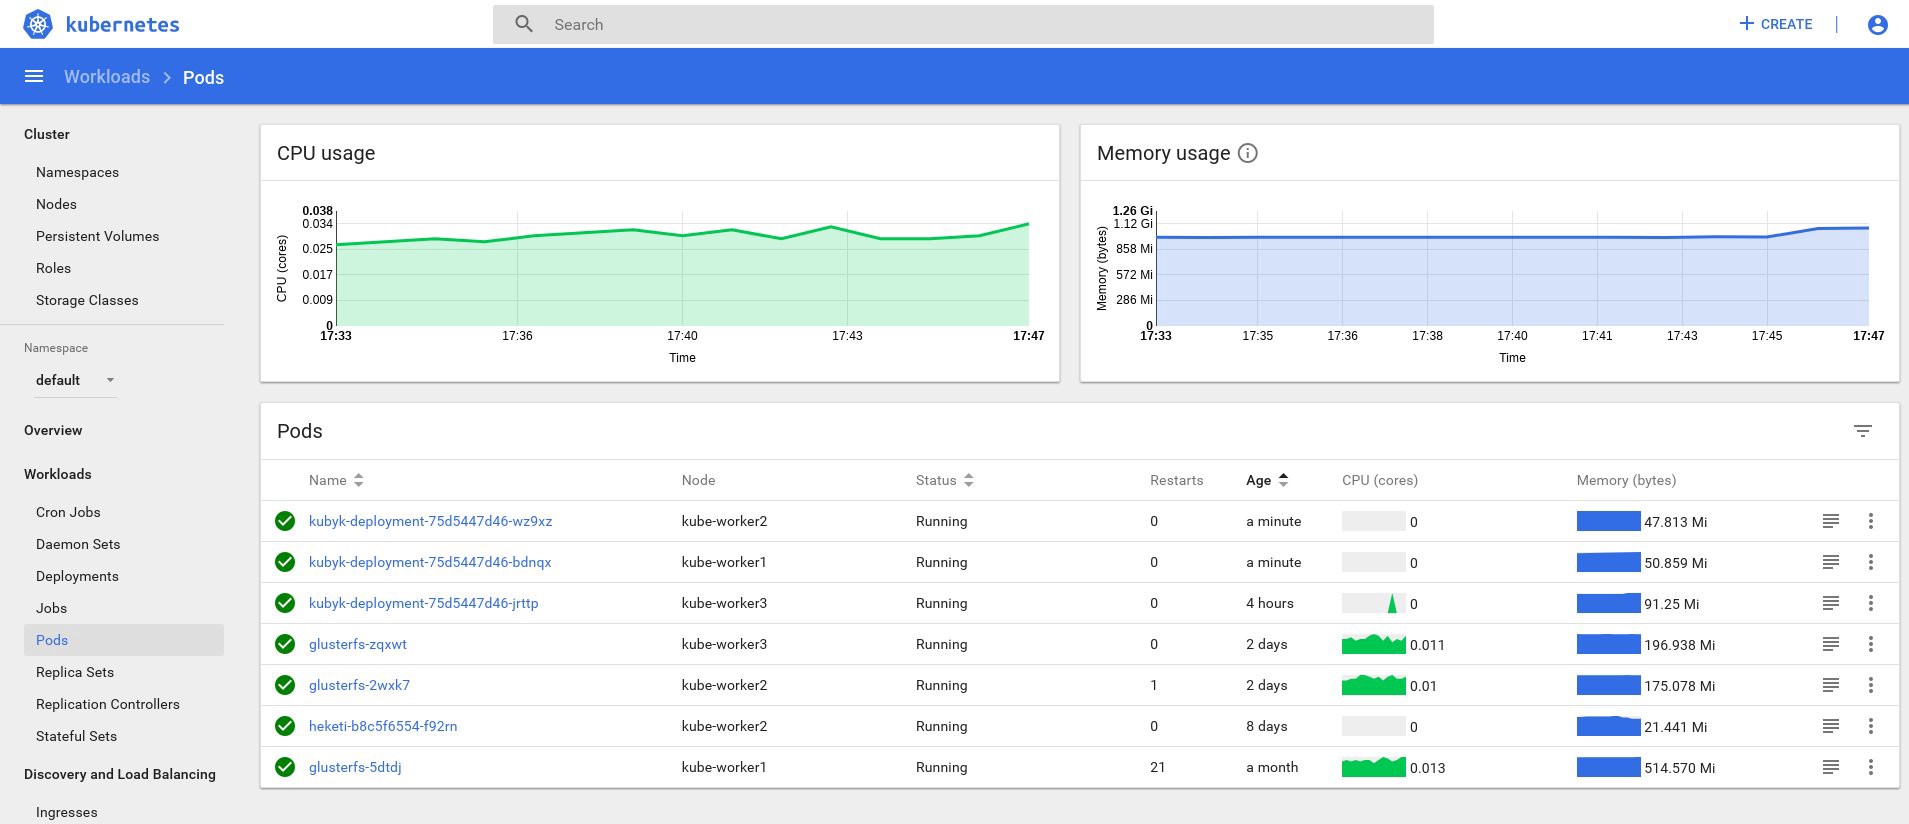
Now we have application replicas for each working node, so the application, if it loses some nodes, will not stop working. In addition, we get a simple way to load balance, as I said earlier. Not bad for a start.
Let's create a new user in our application:
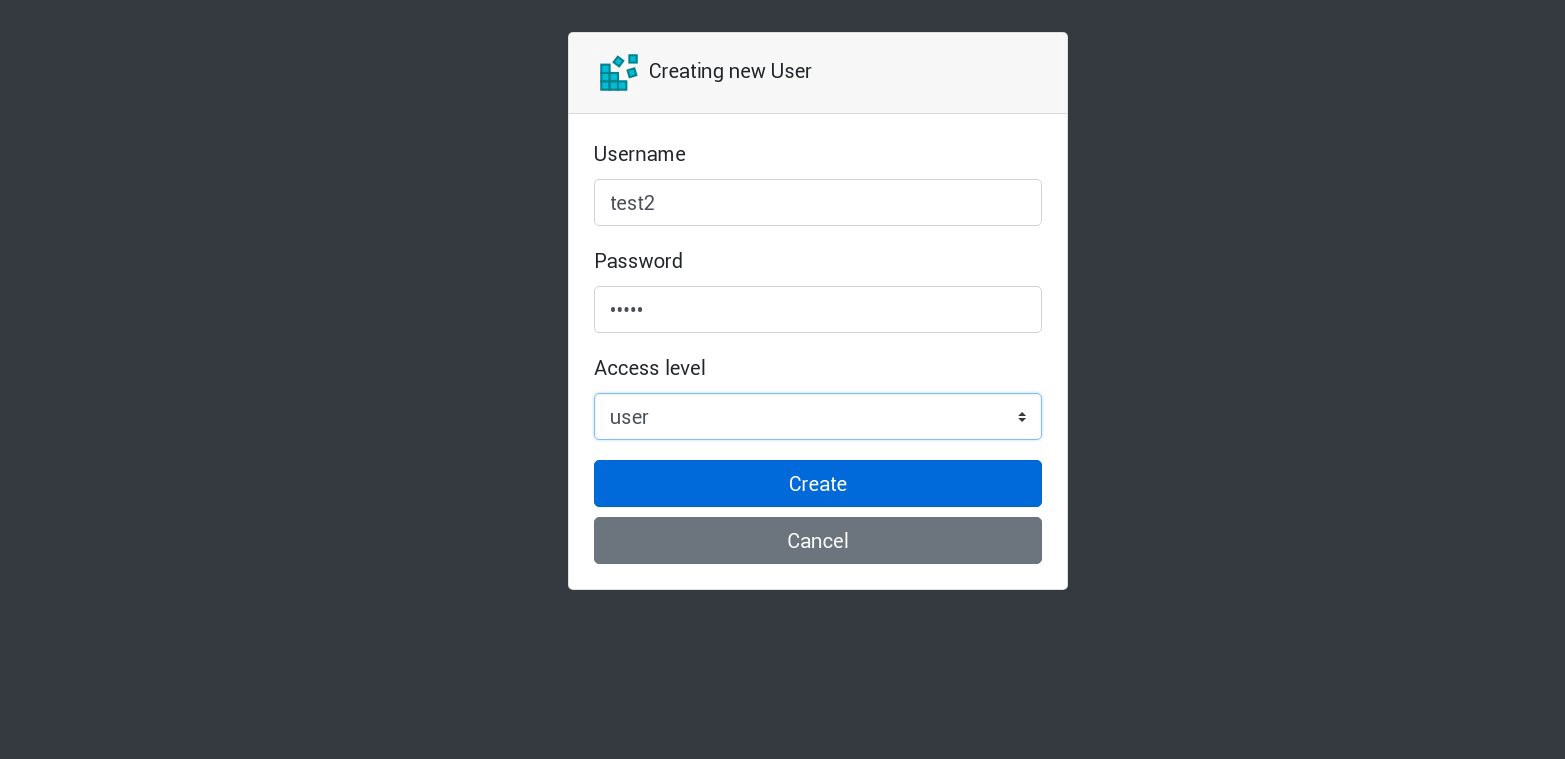
All new requests will be processed in the following list. This can be checked on the logs of the hearth. For example, a new user is created by the application in one subsea, then the next one responds to the next request, and so on. Since this application uses a single persistent volume to store the database, all data will be safe even if all replicas are lost.
In large and complex applications, you will need not just a designated volume for the database, but various volumes to accommodate permanent information and many other elements.
Well, we are almost done. You can add many more aspects, because Kubernetes is a voluminous topic and it is developing dynamically, but we will stop at this. The main purpose of this series of articles was to show how to create your own Kubernetes cluster, and I hope this information was useful to you.
PS
Stability check and stress tests, of course.
The cluster scheme from our example works without 2 working nodes, 1 master node and 1 etcd node. If you want to - disable them and check whether the test application will function.
By compiling these guides, I prepared a cluster of a nearly analogous scheme for production. Once, having created a cluster and having appended it, I ran into a major power failure; absolutely all the servers of the cluster were crashed - a lively nightmare of the system administrator. Some servers shut down for a long time, and after they have file system errors. But the restart surprised me a lot: the Kubernetes cluster was fully recovered. All volumes of GlusterFS and Deploy were launched. As for me, this is a demonstration of the great potential of this technology.
All the best and hopefully see you soon!
')
Source: https://habr.com/ru/post/443658/
All Articles