35% stock returns on alternative data
Trading on alternative (non-standard) data becomes fashionable and promising. A few days ago, a curious dataset from the Moscow Exchange on popular stocks fell into the hands. After a superficial study, we managed to get an attractive result with good yields. Details under the cut
Dataset content
Dataset contains three pv30, pv70, pv100 values for each day and shows the difference between purchases and sales of the group from the top 30, 70 and 100 largest traders for the current day. Those. answers the question, what did the big players do today? More bought or sold? For example, pv100 = 500 means that a group of the top 100 traders in the aggregate bought 500 units. more than sold.
On the website of the exchange you can see a full description of the dataset and get historical values.
')
Data Coverage:
- 10 shares: SBER, GAZP, LKOH, GMKN, MGNT, ALRS, AFLT, ROSN, SBERP, VTBR
- 4 years: 2014 - 2017 (open data on the exchange website)
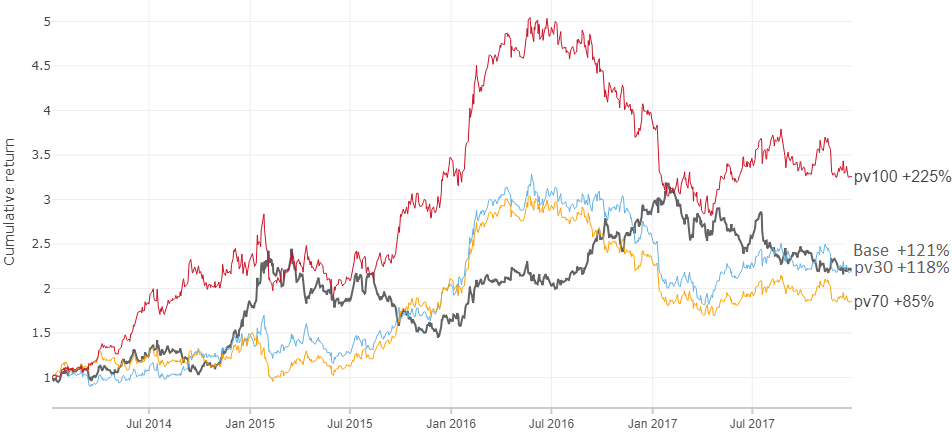
Further, we will consider the data only on SBER , the results of the remaining 9 stocks in the appendix below.
Data overview
Statistical description of pv values for SBER:

Dynamic data and their distribution:

All three values of pv30, pv70 and pv100 are strongly correlated (> 0.95) among themselves and are distributed close to normal with a center near zero. The largest interquartile range is in pv30.
SBER price and cumulative amount of pv100:

Yield today correlates strongly with pv values for today ~ 0.8. Thus, it can be assumed that the price is moved by the participants gaining a large position. The correlation between the price movement tomorrow and the pv value for today is ~ 0.1, which means that there is a weak relationship between them and we can try to predict the direction of the price movement of tomorrow according to pv data for today.
Trading model
Let's build a simple model, if today the value of pv> 0, we assume that the price will rise tomorrow, otherwise it will fall. The pv values are compared with zero, since the mean and median pv values are distributed around zero. To put it simply, if today the big players bought (pv> 0) the next day we also buy and vice versa.
Features of the model:
- The model uses only pv values, and does not use asset pricing information.
- We will open a position at 18:40 - 18:50 at the closing auction and close the next day, at the same time. Position opening time is chosen as such, as pv values are published at 18:30
- If pv> 0, open a long position (buy). If pv <0, open a short position (sell)
- If two or more days in a row pv value is positive / negative, do nothing (hold). Thus, the size of an open position is always constant.
- Commission for the transaction will take equal to 0.025%
- We will take daily returns from close to close (close to close)
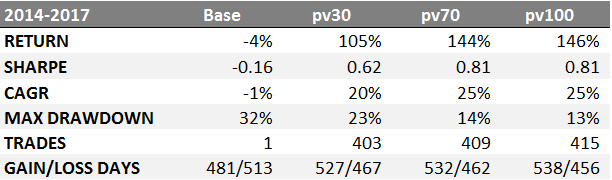
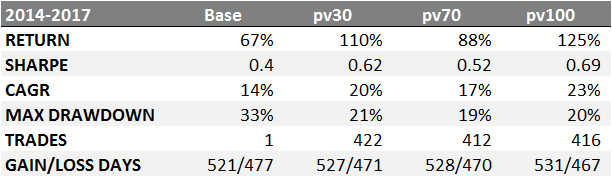
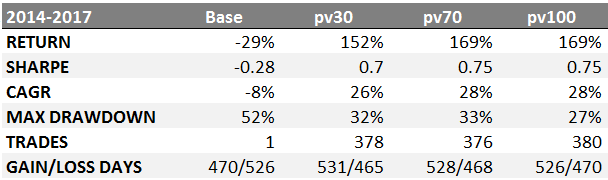
Results of the trading model
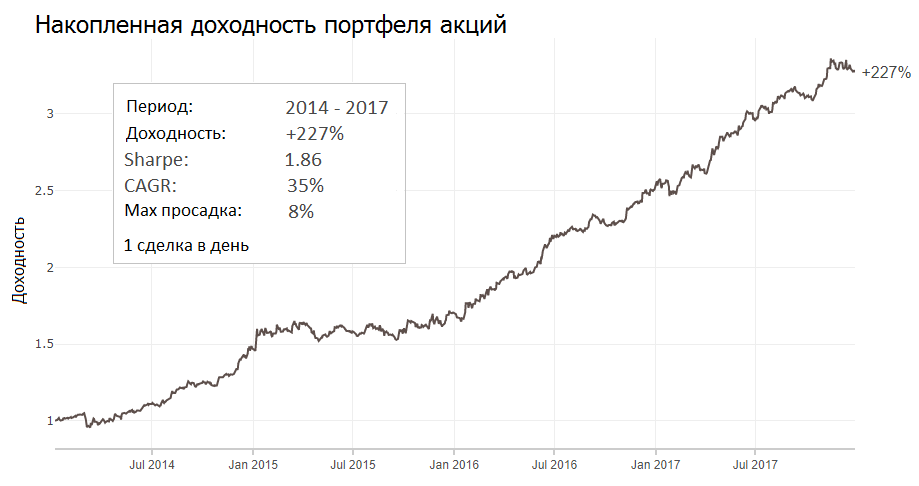
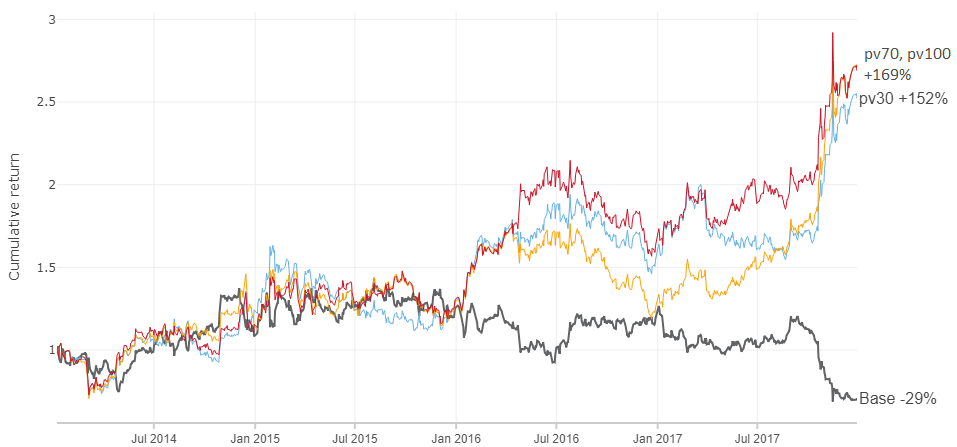
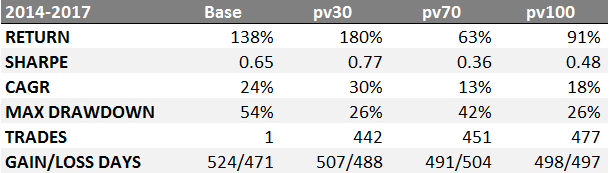
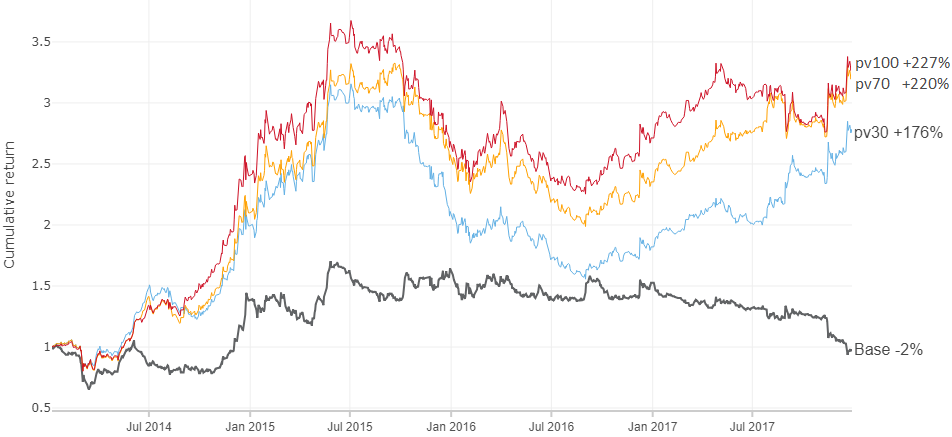
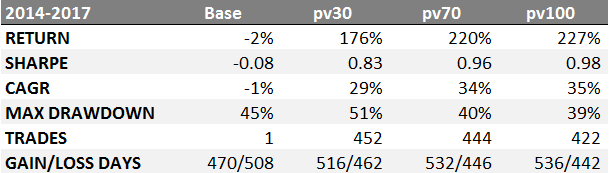
Let us compare the profitability of the “buy and hold” strategy (Base) and the strategies for the values of pv30, pv70 and pv100 on a 4-year interval by SBER:
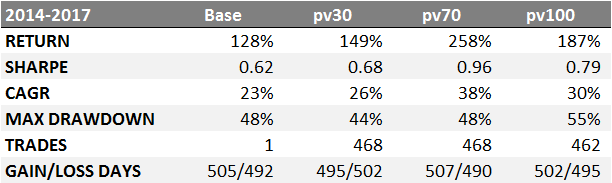
RETURN - model yield for 4 yearsComparison of models in dynamics:
SHARPE - Sharpe Ratio, risk free return rf = 6%
CAGR - average annual growth rate
MAX DRAWDOWN - maximum drawdown
TRADES - the number of transactions
GAIN / LOSS DAYS - the number of days when you guessed and did not guess the price movement.
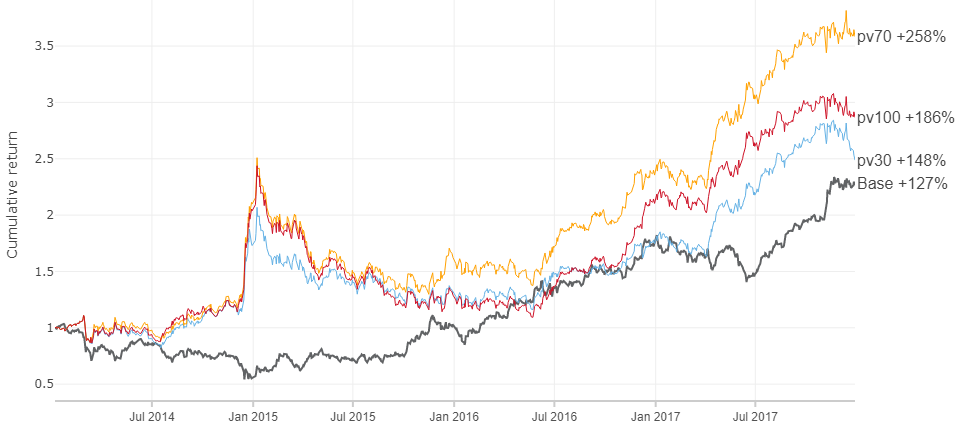
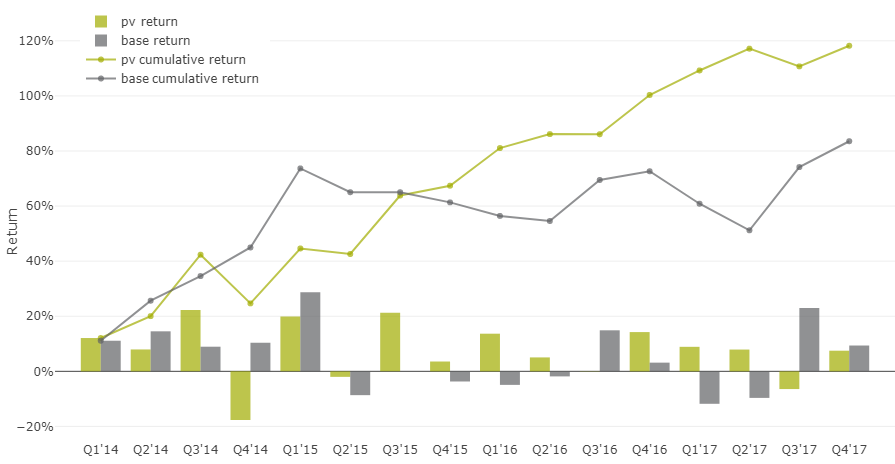
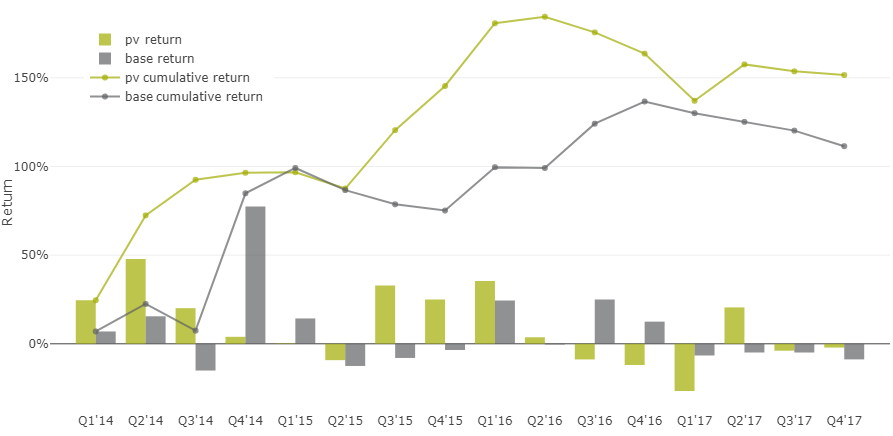
Quarterly comparison of the “buy and hold” base model returns against the pv indicator

Similar results for the other nine instruments can be found in the appendix below.
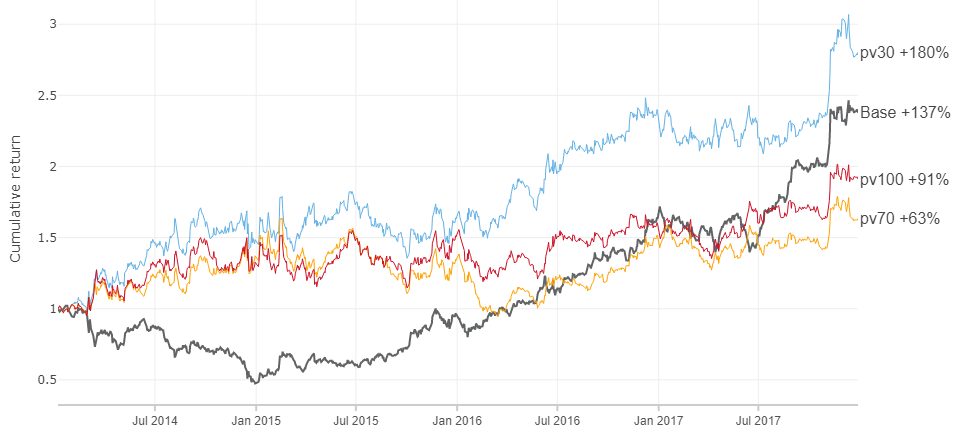
Stock portfolio
On the example of SBER, we obtained a high yield relative to the asset itself, but nonetheless we observe a large drawdown for the entire 2015 year. This picture is also observed for other stocks at different times (see the appendix). And what if you scatter money for all ten shares? Then we can probably avoid large drawdowns.
You can scatter equally, but you can also in proportion to the corresponding liquidity and capacity of the instrument.
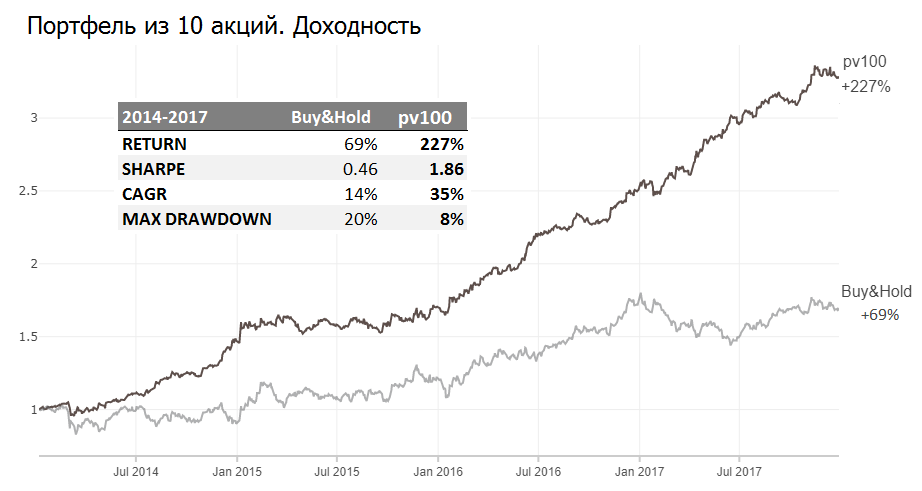
The portfolio of 10 securities managed by pv100 showed a yield of 35% per annum and a smaller drawdown than the buy-and-hold strategy.
Going through the weight, you can get both 15% and 50%, but what is important is that by throwing money across multiple assets, we avoid large drawdowns in our trading model.
Observations left out of this material
- Derivative values based on pv also show good yield (good = above the market): sma with short periods, impulses, rationing for volume, and other similar techniques from technical analysis
- In periods of low volatility, the impulses of pv values are better manifested.
- Values of pv have good sensitivity to rare strong price movements, i.e. the percentage of guessing price movements of more than 3% reaches ~ 75%, while the total percentage of guessing is ~ 50%
- The distribution of pv by days of the week varies, especially Mon from Fri. Probably, at the beginning of the week a position is being recruited, and by the end the closing
- In the trading model discussed above, the pv value was compared to 0, although 0 is not the most optimal point while maximizing profitability.
- Each of the 10 stocks has its own peculiarities in terms of pv values.
My findings
The hypothesis of following large players in terms of pv with a lag of one day showed a result higher than the market in the period 2014-2017. To assert that it will always be like this would be presumptuous. What will happen to the new data? On the one hand, there is no compelling reason why everything can break, but on the other, who knows :) For greater certainty, more points and fresh data are needed.
The model could be made more complex and get fantastic returns, adjusting to the available data, but then the risk of overfit is high.
A couple of questions in the hall, what do you think:
- Why this data can work?
- Why this data may not work?
application


application
Gazp
Lkoh
GMKN
MGNT
ROSN
Alrs
SBERP
AFLT
VTBR
Source: https://habr.com/ru/post/443616/
All Articles