Data Science: predicting business events to improve service
Algorithms of recommendations, prediction of events or risk assessment are a trend decision in banks, insurance companies and many other business sectors. For example, these programs help, based on data analysis, to suggest when a client returns a bank loan, what will be the demand in retail, what is the probability of an insured event or an outflow of customers in a telecom, etc. For business, this is a valuable opportunity to optimize your expenses, increase your speed of work and, in general, improve service.
At the same time, traditional approaches — classification and regression — are not suitable for building such programs. Consider this problem on the example of a case dedicated to the prediction of medical episodes: analyze the nuances in the nature of the data and possible approaches to modeling, build a model and analyze its quality.
We predict episodes based on an analysis of historical data. Dataset consists of two parts. The first is data on services previously provided to the patient. This part of the dataset includes socio-demographic data about the patient, such as age and gender, as well as diagnoses made in ICD10-CM [1] and different HCPCS procedures [2] performed at different points in time. These data form sequences in time, which allow you to get an idea of the patient's condition at the moment of interest. For training models, as well as for work in production, personalized data is enough.
')
The second part of the dataset is the list of episodes arising for the patient. For each episode, we indicate its type and date of occurrence, as well as the time period, included services and other information. Target variables for prediction are formed from this data.
In the problem being solved, the time aspect is important: we are only interested in episodes that may arise in the near future. On the other hand, the data at our disposal was collected for a limited period of time, beyond which there is no data. Thus, we cannot say whether episodes occur outside of the observation period, what episodes are, at what point in time they occur. This situation is called right censoring.
In the same way, left censoring occurs in the same way: for some patients, the episode may begin to develop earlier than is available to our observation. For us it will look like an episode that arose without any history.
There is another type of data censoring - interruption of observation (if the observation period is not over and the event has not come). For example, due to patient relocation, failure of the data collection system, and so on.
In fig. 1 shows schematically different types of data censoring. All of them distort the statistics and make it difficult to build a model.
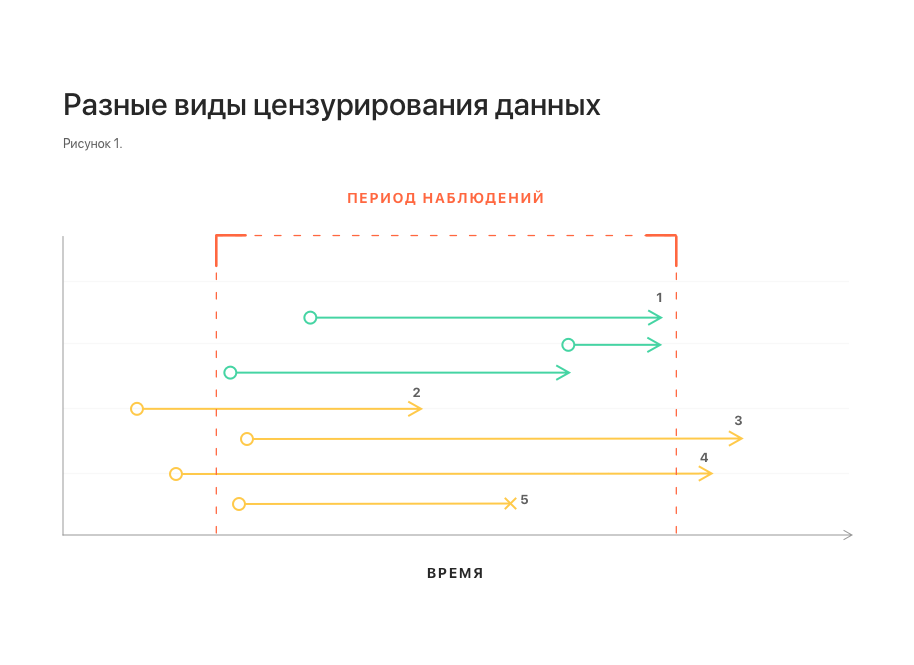
Notes: 1 - uncensored observations; 2, 3 - left and right censoring, respectively; 4 - left and right censoring at the same time;
5 - interruption of observation.
Another important feature of dataset is related to the nature of data flow in real life. Some data may come late, in which case they are not available at the time of the prediction. To take into account this feature, it is necessary to add datasets, throwing out several elements from the tail of each of the sequences.
Naturally, the first thought would be to reduce the task to a well-known classification and regression. However, these approaches encounter serious difficulties.
Why regression does not suit us is clear from the considered phenomena of right and left censoring: the distribution of the time of the occurrence of an episode in a dataset can be shifted. In this case, the magnitude and the fact of the presence of this offset cannot be determined using the dataset itself. The constructed model can show arbitrarily good results with any approach to validation, but with its suitability for forecasting on production-data this most likely will have nothing in common.
At first glance, an attempt to reduce the task to classification looks more promising: to set a certain period of time and determine the episode that will arise during this period. The main difficulty here is the binding of the time interval of interest to us. Reliably, it can only be tied to the time of the last update of the patient's history. At the same time, the request for prediction of the episode is not tied to time at all and can come at any time, both within this period (and then the effective period of interest is reduced) and beyond it - and then the prediction loses its meaning at all (see. 2). This naturally induces an increase in the period of interest, which ultimately reduces the value of the prediction.

Notes: 1 - patient history updates; 2 - the last update and the time span associated with it; 3, 4 - requests for prediction of episodes received during this period. It is seen that the effective prediction gap for them is smaller; 5 - request received outside the gap. For him, prediction is impossible.
Alternatively, you can consider an approach in the Russian-language literature called survival analysis (survival analysis, or time-to-event analysis) [3]. This is a family of models created specifically for working with censored data. It is based on the approximation of the risk function (hazard function, intensity of the occurrence of events), which estimates the probability distribution of the occurrence of an event over time. This approach allows you to correctly take into account the presence of different types of censoring.
For the problem being solved, such an approach additionally allows one to combine both aspects of the problem in one model: determining the type of episode and predicting the time of its occurrence. To do this, it is enough to build a separate model for each type of episode, similar to the one-vs-all approach in the classification. Then the occurrence of a untargeted episode can be interpreted as the exclusion of an object from the observed sample without the occurrence of an event, which is another type of data censoring and is also correctly taken into account by the model. This interpretation is also correct from the point of view of business logic: if a patient has a cataract underwent surgery, this does not exclude other episodes for him in the future.
Among the family of models for the analysis of survival can be distinguished two varieties: analytical and regression. Analytical models are purely descriptive, they are built for the population as a whole, do not take into account the characteristics of its individual members, and therefore, they can only predict the occurrence of an event for some typical member of the population. In contrast to the analytical, regression models are constructed taking into account the characteristics of individual members of the population and allow you to build forecasts for individual members, taking into account their characteristics. In the problem to be solved, it was precisely this variety that was used, and more specifically, the Cox's Proportional Hazard model (hereinafter referred to as CoxPH).
The simplest approach will be the same as the usual regression: as an output, take the expectation of the time of the event. Since CoxPH accepts input as a numerical vector, and our dataset is essentially a sequence of diagnostic codes and procedures (categorical data), a preliminary transformation of the data is required:
We then use the obtained feature vectors for training the model and its validation. The resulting model shows the following values of the concordance index (c-index or c-statistic) [5]:
This is comparable to the usual level of 0.6-0.7 for such models [6].
However, if you look at the mean absolute error between the predicted expected time of the episode and the actual, it turns out that the error is 5 days. The reason for such a large error is that optimization under c-index guarantees only the correctness of the order of values: if one event should occur before another, then the predicted values of the expected time before the events will be one less than the other, respectively. At the same time, no statements are made regarding the predicted values themselves.
Another possible variant of the output value of the model is a table of values of the risk function at different points in time. This option has a more complex structure, it is more difficult to interpret than the previous one, but at the same time it provides more information.
Changing the output format requires a different way to assess the quality of the model: we need to make sure that for positive examples (when an episode occurs) the risk level is higher than for negative examples (when an episode does not occur). To do this, for each predicted distribution of the risk function on a delayed sample, we move from a table of values to a single value — the maximum. Considering the median values for positive and negative examples, we will see that they reliably differ: 0.13 versus 0.04, respectively.
Next, we use these values to build the ROC curve and calculate the area under it - ROC AUC, which is 0.92, which is acceptable for the problem to be solved.
Thus, we saw that the survival analysis is the approach best applied to solving the problem of predicting medical episodes, taking into account all the nuances of the problem and the available data. However, its use suggests a different format of the model output data and a different approach to assessing its quality.
Applying the CoxPH model to predicting episodes of cataract surgery has led to acceptable model quality indicators. A similar approach can be applied to other types of episodes, but specific indicators of model quality can only be assessed directly in the modeling process.
[1] ICD-10 Clinical Modification en.wikipedia.org/wiki/ICD-10_Clinical_Modification
[2] Healthcare Common Procedure Coding System en.wikipedia.org/wiki/Healthcare_Common_Procedure_Coding_System
[3] Survival analysis en.wikipedia.org/wiki/Survival_analysis
[4] GloVe: Global Vectors for Word Representation nlp.stanford.edu/projects/glove
[5] C-Statistic: Definition, Examples, Weighting and Significance www.statisticshowto.datasciencecentral.com/c-statistic
[6] VC Raykar et al. On- line Conclusion : Index of Bills on the Concordance Index papers.nips.cc/paper/3375-on-ranking-in-survival-analysis-bounds-on-the-concordance-index.pdf
At the same time, traditional approaches — classification and regression — are not suitable for building such programs. Consider this problem on the example of a case dedicated to the prediction of medical episodes: analyze the nuances in the nature of the data and possible approaches to modeling, build a model and analyze its quality.
The task of predicting medical episodes
We predict episodes based on an analysis of historical data. Dataset consists of two parts. The first is data on services previously provided to the patient. This part of the dataset includes socio-demographic data about the patient, such as age and gender, as well as diagnoses made in ICD10-CM [1] and different HCPCS procedures [2] performed at different points in time. These data form sequences in time, which allow you to get an idea of the patient's condition at the moment of interest. For training models, as well as for work in production, personalized data is enough.
')
The second part of the dataset is the list of episodes arising for the patient. For each episode, we indicate its type and date of occurrence, as well as the time period, included services and other information. Target variables for prediction are formed from this data.
In the problem being solved, the time aspect is important: we are only interested in episodes that may arise in the near future. On the other hand, the data at our disposal was collected for a limited period of time, beyond which there is no data. Thus, we cannot say whether episodes occur outside of the observation period, what episodes are, at what point in time they occur. This situation is called right censoring.
In the same way, left censoring occurs in the same way: for some patients, the episode may begin to develop earlier than is available to our observation. For us it will look like an episode that arose without any history.
There is another type of data censoring - interruption of observation (if the observation period is not over and the event has not come). For example, due to patient relocation, failure of the data collection system, and so on.
In fig. 1 shows schematically different types of data censoring. All of them distort the statistics and make it difficult to build a model.
Notes: 1 - uncensored observations; 2, 3 - left and right censoring, respectively; 4 - left and right censoring at the same time;
5 - interruption of observation.
Another important feature of dataset is related to the nature of data flow in real life. Some data may come late, in which case they are not available at the time of the prediction. To take into account this feature, it is necessary to add datasets, throwing out several elements from the tail of each of the sequences.
Classification and Regression
Naturally, the first thought would be to reduce the task to a well-known classification and regression. However, these approaches encounter serious difficulties.
Why regression does not suit us is clear from the considered phenomena of right and left censoring: the distribution of the time of the occurrence of an episode in a dataset can be shifted. In this case, the magnitude and the fact of the presence of this offset cannot be determined using the dataset itself. The constructed model can show arbitrarily good results with any approach to validation, but with its suitability for forecasting on production-data this most likely will have nothing in common.
At first glance, an attempt to reduce the task to classification looks more promising: to set a certain period of time and determine the episode that will arise during this period. The main difficulty here is the binding of the time interval of interest to us. Reliably, it can only be tied to the time of the last update of the patient's history. At the same time, the request for prediction of the episode is not tied to time at all and can come at any time, both within this period (and then the effective period of interest is reduced) and beyond it - and then the prediction loses its meaning at all (see. 2). This naturally induces an increase in the period of interest, which ultimately reduces the value of the prediction.
Notes: 1 - patient history updates; 2 - the last update and the time span associated with it; 3, 4 - requests for prediction of episodes received during this period. It is seen that the effective prediction gap for them is smaller; 5 - request received outside the gap. For him, prediction is impossible.
Survival Analysis
Alternatively, you can consider an approach in the Russian-language literature called survival analysis (survival analysis, or time-to-event analysis) [3]. This is a family of models created specifically for working with censored data. It is based on the approximation of the risk function (hazard function, intensity of the occurrence of events), which estimates the probability distribution of the occurrence of an event over time. This approach allows you to correctly take into account the presence of different types of censoring.
For the problem being solved, such an approach additionally allows one to combine both aspects of the problem in one model: determining the type of episode and predicting the time of its occurrence. To do this, it is enough to build a separate model for each type of episode, similar to the one-vs-all approach in the classification. Then the occurrence of a untargeted episode can be interpreted as the exclusion of an object from the observed sample without the occurrence of an event, which is another type of data censoring and is also correctly taken into account by the model. This interpretation is also correct from the point of view of business logic: if a patient has a cataract underwent surgery, this does not exclude other episodes for him in the future.
Among the family of models for the analysis of survival can be distinguished two varieties: analytical and regression. Analytical models are purely descriptive, they are built for the population as a whole, do not take into account the characteristics of its individual members, and therefore, they can only predict the occurrence of an event for some typical member of the population. In contrast to the analytical, regression models are constructed taking into account the characteristics of individual members of the population and allow you to build forecasts for individual members, taking into account their characteristics. In the problem to be solved, it was precisely this variety that was used, and more specifically, the Cox's Proportional Hazard model (hereinafter referred to as CoxPH).
Survival regression and cataract surgery
The simplest approach will be the same as the usual regression: as an output, take the expectation of the time of the event. Since CoxPH accepts input as a numerical vector, and our dataset is essentially a sequence of diagnostic codes and procedures (categorical data), a preliminary transformation of the data is required:
- Translating codes into an embedded representation using a pre-trained GloVe model [4];
- Aggregation of all codes available in the last period of the patient's history into a single vector;
- One-hot coding of the patient's gender and age scaling.
We then use the obtained feature vectors for training the model and its validation. The resulting model shows the following values of the concordance index (c-index or c-statistic) [5]:
- 0.71 per 5-fold validation;
- 0,69 on the delayed sample.
This is comparable to the usual level of 0.6-0.7 for such models [6].
However, if you look at the mean absolute error between the predicted expected time of the episode and the actual, it turns out that the error is 5 days. The reason for such a large error is that optimization under c-index guarantees only the correctness of the order of values: if one event should occur before another, then the predicted values of the expected time before the events will be one less than the other, respectively. At the same time, no statements are made regarding the predicted values themselves.
Another possible variant of the output value of the model is a table of values of the risk function at different points in time. This option has a more complex structure, it is more difficult to interpret than the previous one, but at the same time it provides more information.
Changing the output format requires a different way to assess the quality of the model: we need to make sure that for positive examples (when an episode occurs) the risk level is higher than for negative examples (when an episode does not occur). To do this, for each predicted distribution of the risk function on a delayed sample, we move from a table of values to a single value — the maximum. Considering the median values for positive and negative examples, we will see that they reliably differ: 0.13 versus 0.04, respectively.
Next, we use these values to build the ROC curve and calculate the area under it - ROC AUC, which is 0.92, which is acceptable for the problem to be solved.
Conclusion
Thus, we saw that the survival analysis is the approach best applied to solving the problem of predicting medical episodes, taking into account all the nuances of the problem and the available data. However, its use suggests a different format of the model output data and a different approach to assessing its quality.
Applying the CoxPH model to predicting episodes of cataract surgery has led to acceptable model quality indicators. A similar approach can be applied to other types of episodes, but specific indicators of model quality can only be assessed directly in the modeling process.
Literature
[1] ICD-10 Clinical Modification en.wikipedia.org/wiki/ICD-10_Clinical_Modification
[2] Healthcare Common Procedure Coding System en.wikipedia.org/wiki/Healthcare_Common_Procedure_Coding_System
[3] Survival analysis en.wikipedia.org/wiki/Survival_analysis
[4] GloVe: Global Vectors for Word Representation nlp.stanford.edu/projects/glove
[5] C-Statistic: Definition, Examples, Weighting and Significance www.statisticshowto.datasciencecentral.com/c-statistic
[6] VC Raykar et al. On- line Conclusion : Index of Bills on the Concordance Index papers.nips.cc/paper/3375-on-ranking-in-survival-analysis-bounds-on-the-concordance-index.pdf
Source: https://habr.com/ru/post/443590/
All Articles