Debugging Angular CLI applications in VSCode using Browser Preview
Hi, Habr! In Iponweb, we not only create magic using Kubernetes , but also create complex user interfaces. The main framework we use is Angular (as well as AngularJs for legacy parts), so the usability development is not an empty sound for us. We decided to translate an article by Mark Pieszak, which is designed to improve the convenience of debugging JS-code.
Kenneth Auchnberg, program manager for the VSCode team, recently released an extension that allows you to run and debug any JS application right in the VSCode IDE!

')
In this post we will talk about Angular CLI-related things, but keep in mind that you can use any other framework (or even do without it) and still use the Browser Preview!
For demonstration, we suggest creating an application via Angular CLI from scratch. However, if you already have the Angular application, you can skip this section and use the Browser Preview.
You now have a clean installation of Angular. Let's make sure the necessary extensions for VSCode are installed.


Go to the extension store and download Browser Preview and Debugger for Chrome if you haven’t already installed it.
In the left pane, select the Debug tab and add a new configuration for the Browser Preview plugin.

This action will create a simple Launch.json configuration, but in order for it to work with the Angular application, you need to make a couple of changes.

As you can see, the URL http: // localhost: 3000 is used by default, but since the Angular CLI runs on port 4200 , the URL needs to be fixed to localhost : 4200.
In addition, in VSCode, you must specify where the root folder ( webRoot ) of your application. In the case of Angult CLI, this is $ {workspaceFolder} .
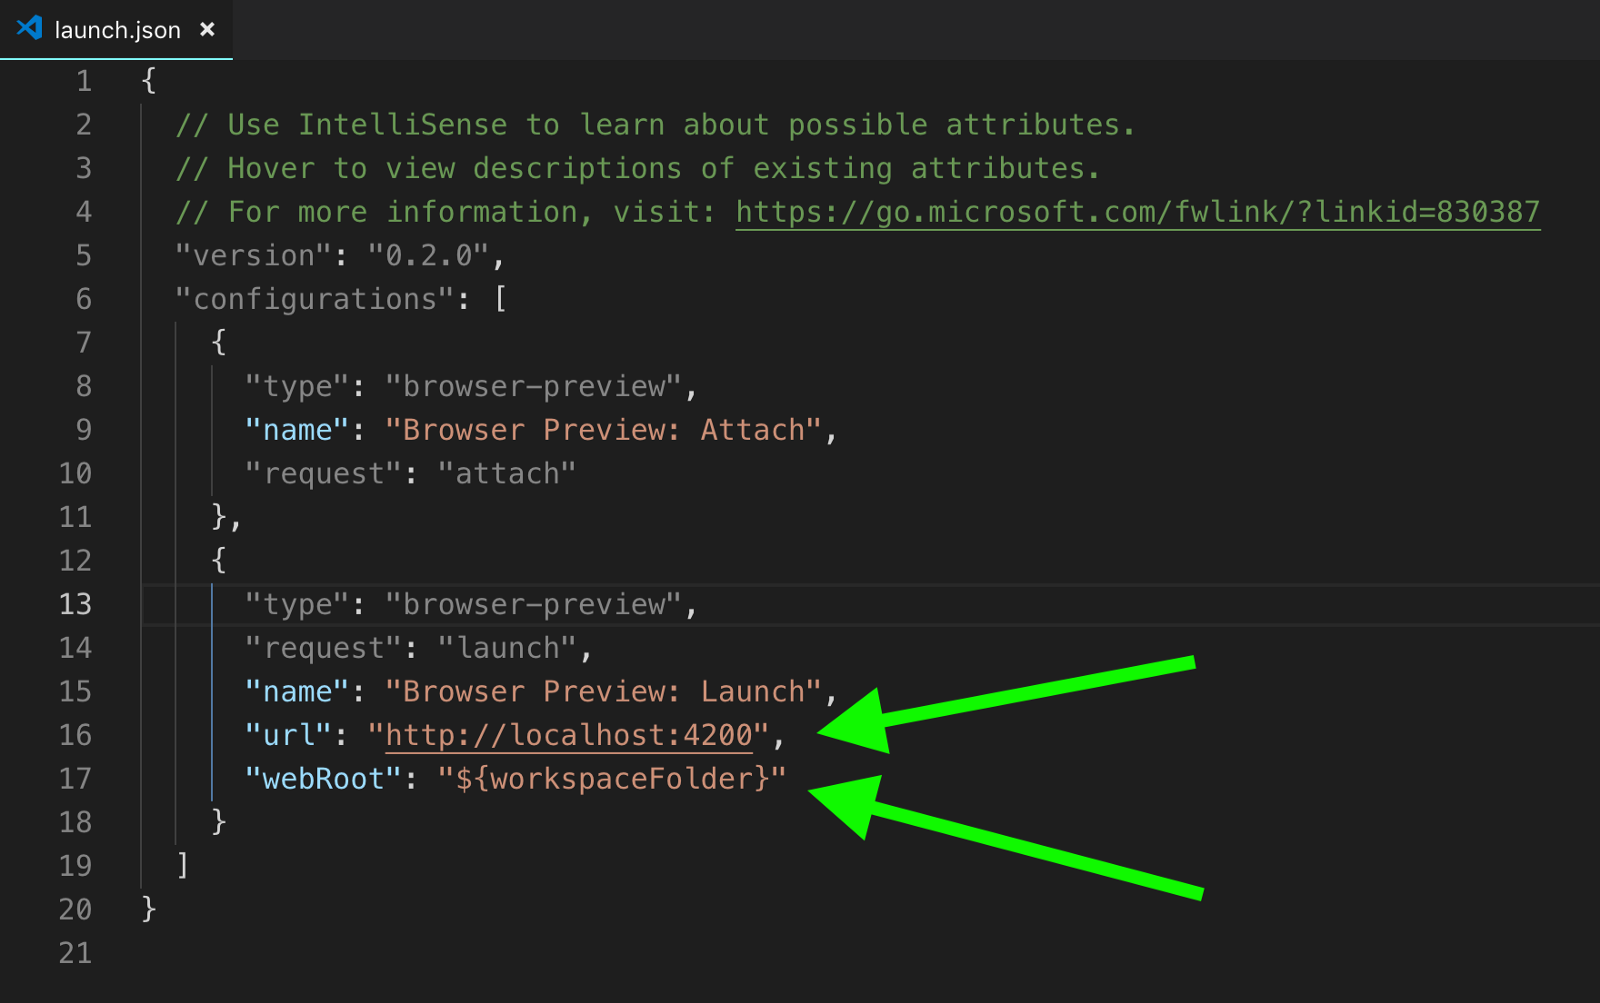
To start it is necessary to perform only these two settings.
Run Browser Preview
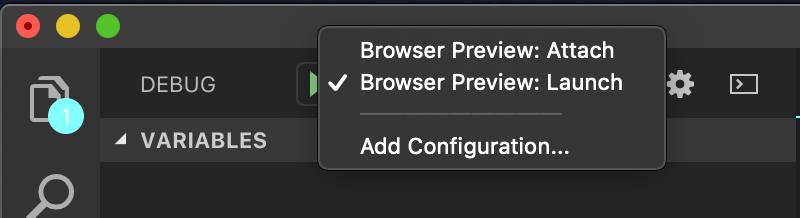
Start your Angular application using the npm start or ng serve commands, then open the Debug tab in VSCode. Make sure that the Browser Preview: Launch configuration you created is selected in the debug sidebar, and click Debug Start (or F5 ).
A window with your Angular application will appear to the right of the code window.

Now that all the presets are done, check out the debugging process.
Add a button and a click event interceptor to the app.component.html template.
Set a breakpoint inside the testDebugging () method.
When the preview window reboots, click the “Click Me” button in it and look at the magic that is happening.

And so, you did it! After clicking on the “Click Me” button, Browser Preview will record a breakpoint.
We hope that this article will help you in developing your application.
Angular demo repo
VSCode Browser Preview Repo
Original article
Kenneth Auchnberg, program manager for the VSCode team, recently released an extension that allows you to run and debug any JS application right in the VSCode IDE!
')
In this post we will talk about Angular CLI-related things, but keep in mind that you can use any other framework (or even do without it) and still use the Browser Preview!
Customization
For demonstration, we suggest creating an application via Angular CLI from scratch. However, if you already have the Angular application, you can skip this section and use the Browser Preview.
# let's get the latest CLI just incase :) npm i -g @angular/cli ng new angularcli-vscode-debug cd angularcli-vscode-debug && code . You now have a clean installation of Angular. Let's make sure the necessary extensions for VSCode are installed.
Installing VSCode Extensions from the App Store
Go to the extension store and download Browser Preview and Debugger for Chrome if you haven’t already installed it.
VSCode configuration Launch.json
In the left pane, select the Debug tab and add a new configuration for the Browser Preview plugin.
This action will create a simple Launch.json configuration, but in order for it to work with the Angular application, you need to make a couple of changes.
As you can see, the URL http: // localhost: 3000 is used by default, but since the Angular CLI runs on port 4200 , the URL needs to be fixed to localhost : 4200.
In addition, in VSCode, you must specify where the root folder ( webRoot ) of your application. In the case of Angult CLI, this is $ {workspaceFolder} .
To start it is necessary to perform only these two settings.
Run Browser Preview
Before you start debugging in VSCode using Browser Preview, make sure that you have already started the Angular application from the terminal.
Start your Angular application using the npm start or ng serve commands, then open the Debug tab in VSCode. Make sure that the Browser Preview: Launch configuration you created is selected in the debug sidebar, and click Debug Start (or F5 ).
A window with your Angular application will appear to the right of the code window.
Debugging with Browser Preview
Now that all the presets are done, check out the debugging process.
Add a button and a click event interceptor to the app.component.html template.
<b>app.component.html</b> <button (click)="testDebugging()">Click Me!</button> <b>app.component.ts</b> testDebugging() { this.title = 'browser preview works!!'; // set a breakpoint here } Since Angular CLI manages rebuilding, any changes you make to the project will automatically restart the preview when saved.
Set a breakpoint inside the testDebugging () method.
When the preview window reboots, click the “Click Me” button in it and look at the magic that is happening.
And so, you did it! After clicking on the “Click Me” button, Browser Preview will record a breakpoint.
We hope that this article will help you in developing your application.
Links and demos
Angular demo repo
VSCode Browser Preview Repo
Original article
Source: https://habr.com/ru/post/443574/
All Articles