Evolution of database infrastructure: from database and application on one server to streaming replication

Hi, Habr!
My name is Anton Markelov, I am an United Traders ops engineer. We are engaged in projects one way or another connected with investments, stock exchanges and other financial affairs. We are not a very large company, about 30 development engineers, the scale is appropriate - a little less than a hundred servers. In the course of the quantitative and qualitative growth of our infrastructure, the classic solution “we keep both the application and its base on the same server” has ceased to suit us both in terms of reliability and speed. On the part of analysts there was a need to create crossbase queries, the operations department was tired of messing with backup and monitoring a large number of database servers. On top of that, storing the state on the same machine as the application itself greatly reduced the flexibility of resource planning and infrastructure resiliency.
')
The transition to the current architecture was evolutionary, various solutions were tested both to provide a convenient interface for developers and analysts, and to improve the reliability and controllability of the entire economy. I want to talk about the main stages of upgrading our DBMS, which rakes we came to and which solutions we arrived at, having in the end obtained a fault-tolerant independent environment, providing convenient ways for interaction between operating engineers, developers and analysts. I hope our experience will be useful to engineers from companies of our scale.
This article is a summary of my report at the UPTIMEDAY conference. Maybe the video format will be more comfortable for someone, although the writer is a little better than the speaker with his mouth.
The Snowflake Man with KDPV was shamelessly borrowed from Maxim Dorofeyev.
Growing diseases
We have a microservice architecture, services are written mainly in Java or Kotlin using the Spring framework. Next to each microservice is the PostgreSQL database, on top everything is covered with nginx to provide access. A typical microservice is an application on Spring Boot, which writes its data to PostgreSQL (some applications are at the same time as ClickHouse), communicates with its neighbors via Kafka and has some REST or GraphQL endpoints to communicate with the outside world.
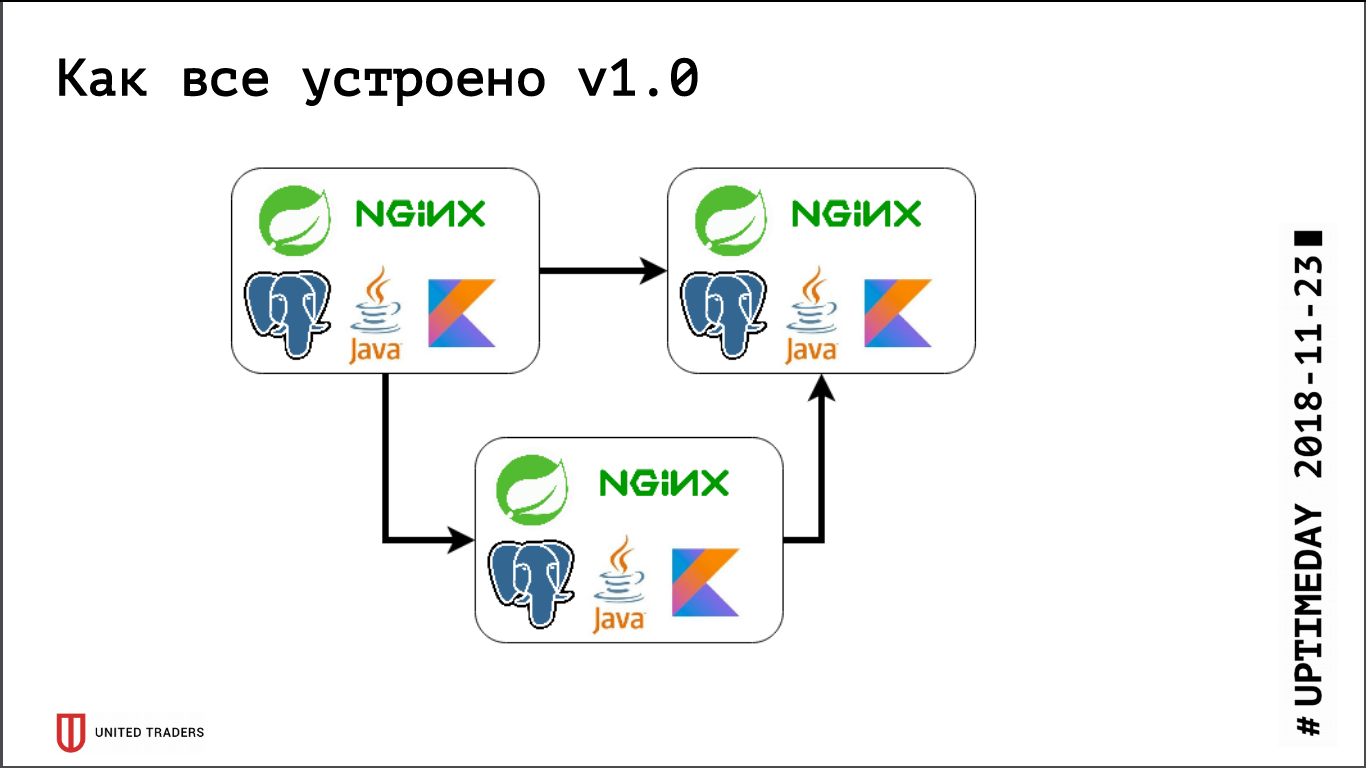
Previously, when we were very small, we just kept several servers in DigitalOcean, Kafka was not there yet, all communication was through REST. That is, we took a droplet, put Java, PostgreSQL, nginx there, started Zabbix there, so that it monitors server resources and the availability of service endpoints. Deploy it all with the help of Ansible, we had unified playbooks, four or five roles rolled out the entire service. So far, we had, conditionally speaking, 6 servers on production and 3 on the test — somehow it was possible to live with this.
Then the active development phase began, the number of applications grew, ten microservices turned into forty, their functionality began to change, plus integration with external systems like CRM, client sites, and the like appeared. We had the first pain. Some applications began to consume more resources, stopped to get on the existing servers, we picked up droplets, dragged applications back and forth, and tinker a lot. It hurt quite badly - no one likes dull mechanical work - I wanted to solve quickly. Therefore, we went "head on" - just took 3 large dedicated servers instead of 10 cloud droplets. This closed the problem for a while, but it became obvious that it was time to work out the options for some kind of orchestration and server rebalancing. We began to look closely at solutions such as DC / OS and Kubernetes, gradually increasing expertise in this direction.
At about the same time, we had an analytical department, which needed to make heavy queries regularly, prepare reports, have beautiful dashboards, and this brought us a second pain. Firstly, analysts heavily loaded the base, and secondly, they needed cross-base queries, since each microservice kept a fairly narrow data slice. We tested several systems, at first we tried to solve this all through table-level replication (it was still in the time of the ninth PostgreSQL, there was no logical replication out of the box), but the resulting crafts based on pglogical, Presto, Slony-I and Bucardo were not at all staged. For example, pglogical did not support migration — a new version of microservice rolled out, the structure of the database changed, Java itself changed the structure using Flyway, and on replicas in pglogical everything had to be changed manually. Otherwise, either something was missing, or it was too difficult.
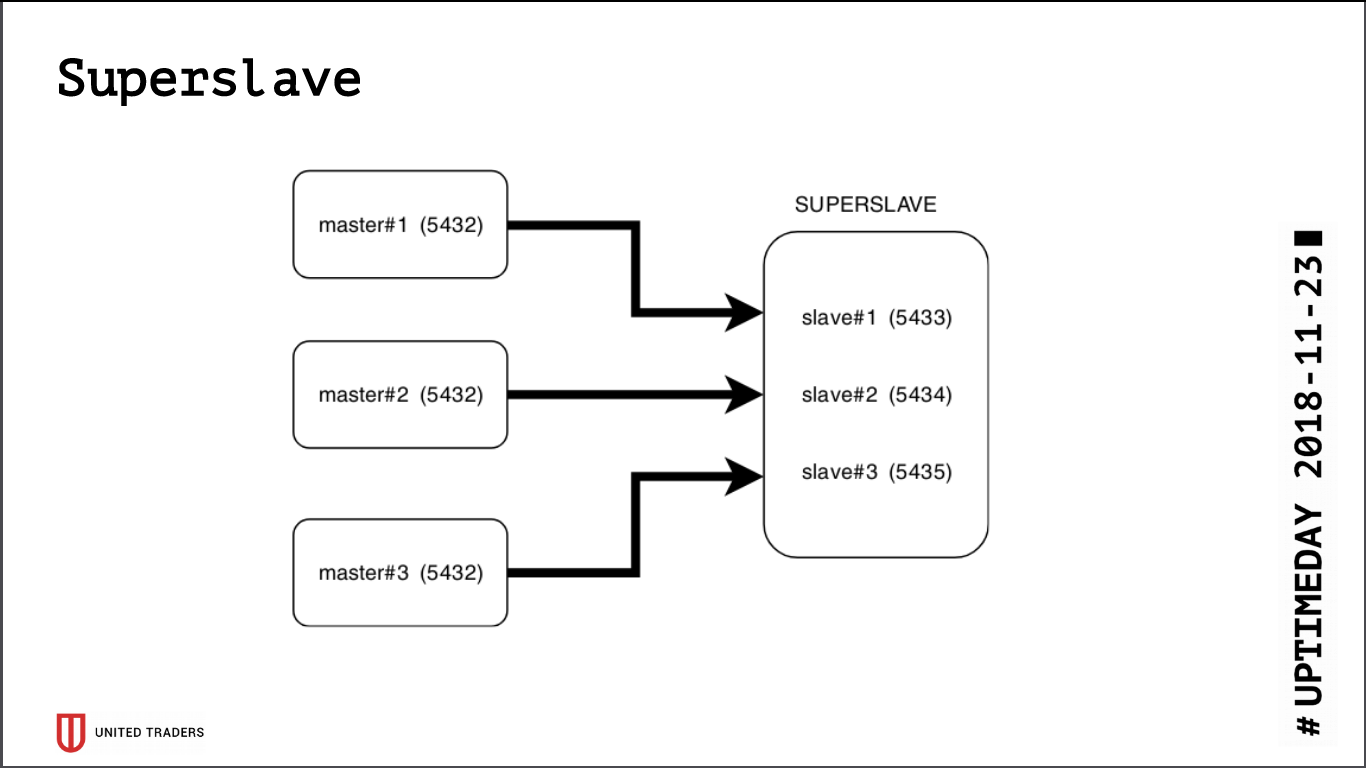
Super slave
As a result of the research, a simple and brutal solution called Superslave was born: we took a separate server, set up a slave for it for each production server at different ports and created a virtual database that combines databases with slaves via postgres_fdw (foreign data wrapper). That is, all this was implemented by standard postgres means without introducing additional entities, simply and reliably: in one request it was possible to obtain data from several databases. We have given this virtual cross-base to analysts. An additional advantage is that the read-only replica, even with an error with access rights, was impossible to write anything there.
They took Redash for visualization, he knows how to draw graphs, execute queries on a schedule, for example, once a day, and has a ragged system of rights, so we let analysts and developers go there.

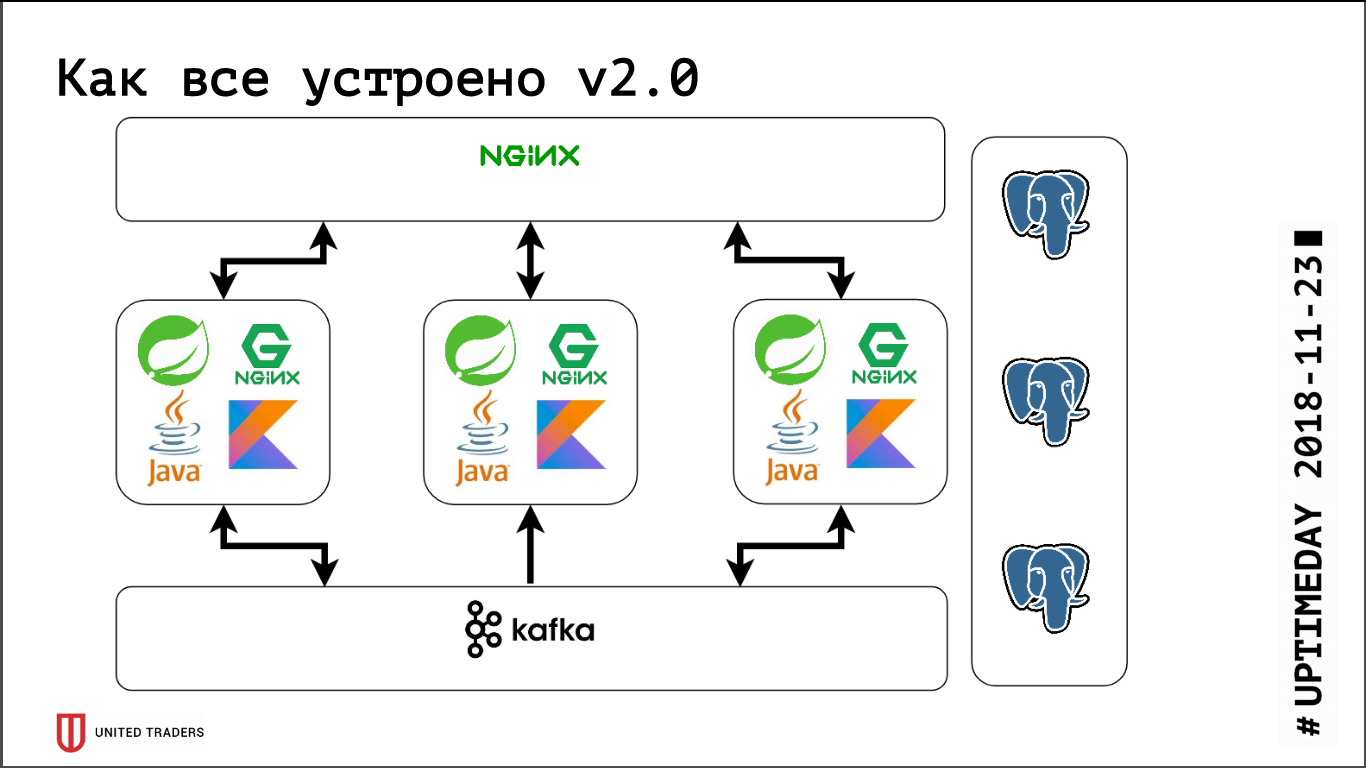
At the same time, growth continued, Kafka as a bus and ClickHouse for analytics storage appeared in the infrastructure. They are easily clustered out of the box, our super-layer on their background looked like a cumbersome fossil. Plus, PostgreSQL, in fact, remained the only state that had to be dragged after the application (if it still had to be transferred to another server), and we really wanted to get a stateless application to come to grips with the experiments with Kubernetes and similar platforms.
We began to look for a solution that meets the following requirements:
- fault tolerance: when N servers fail, the cluster continues;
- for applications, everything should remain as before, no changes in the code;
- ease of deployment and management;
- fewer layers of abstraction over ordinary PostgreSQL;
- ideally, load balancing so that not all requests go to one server;
- Ideally, it is written in a language we know.
There were not very many candidates:
- standard stream replication (repmgr, patroni, stolon);
- trigger based replication (Londiste, Slony);
- request replication in the middle layer (pgpool-II);
- synchronous replication with multiple master servers (Bucardo).
With a significant part, we already had a bad experience during the construction of the cross-base, so that Patroni and Stolon remained. Patroni is written in Python, Stolon on Go, we have enough expertise in both languages. Moreover, they have similar architecture and functionality, so the choice was made for subjective reasons: Patroni is being developed by Zalando, and we once tried to work with their Nakadi project (REST API to Kafka), where we faced a severe lack of documentation.
Stolon
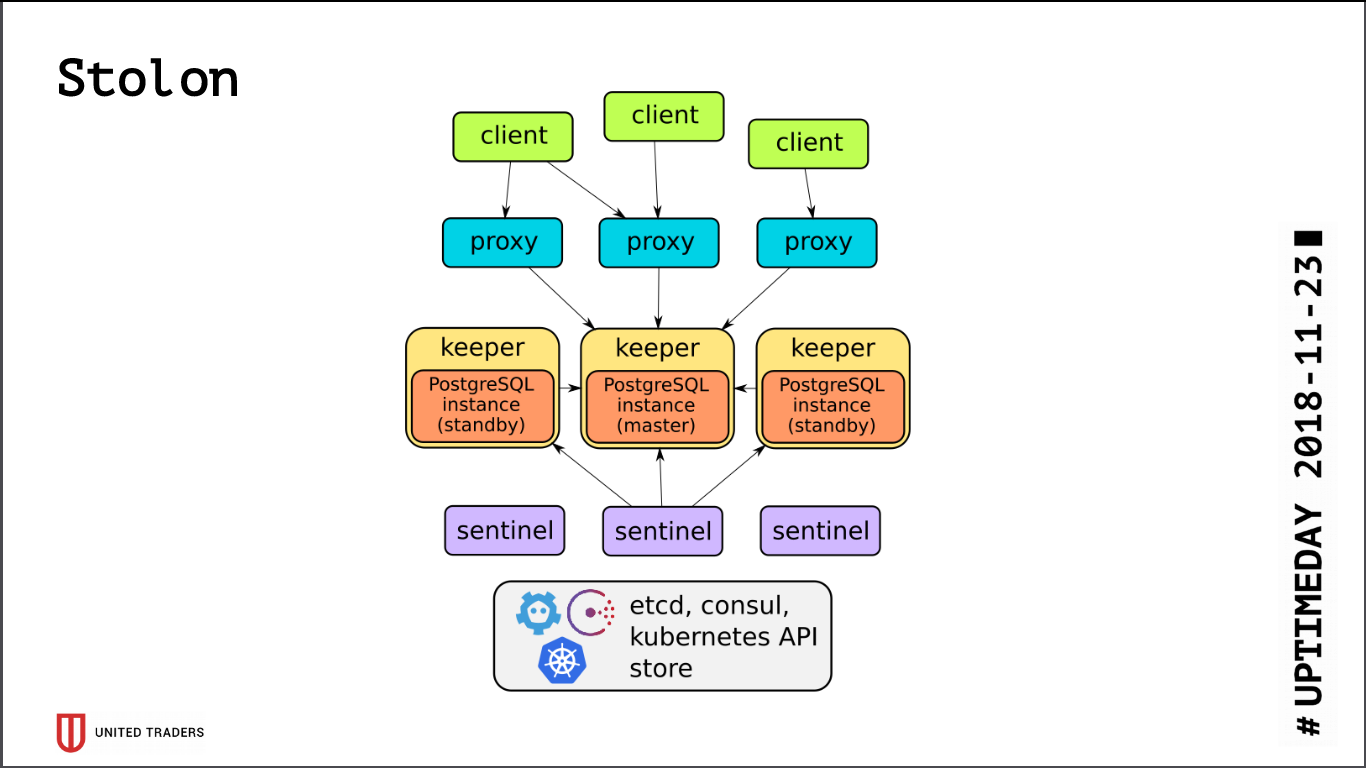
The architecture of Stolon is quite simple: there are N servers, with the help of etcd / consul a leader is selected, PostgreSQL is launched on it in master mode and replicated to other servers. Then in this PostgreSQL-master go stolon-proxy, pretending to be an ordinary postgres application, and clients go to these proxies. In the event of a master's failure, re-election takes place, someone else becomes a master, the rest - a standby. There are few layers of abstraction, PostgreSQL is set as usual, the only nuance is that the PostgreSQL config is stored in etcd, and is configured somewhat differently.
When testing the cluster, we caught quite a few problems:
- Stolon does not know how to work on top of ZooKeeper, only consul or etcd;
- etcd is very sensitive to IO. If you keep PostgreSQL and etcd on the same server, you definitely need fast SSDs;
- even on the SSD, you need to set up timeouts etcd, otherwise it will break everything under load - the cluster will think that the master has fallen off and constantly break connections;
- the default max_connections on PostgreSQL is small (200), you need to increase to fit your needs;
- a cluster of three etcd will survive the death of only one server, ideally you need to have a configuration, for example 5 etcd + 3 Stolon;
- out of the box, all connections go to the master, the slaves are inaccessible to the connection.
Since all connections to PostgreSQL go to the master, we again came up against the problem of heavy queries from analysts. etcd sometimes painfully reacted to the high load on the master and switched it. And master switching is always a disconnection of connections. The request was restarted, it all started over. To bypass, a Python script was written, which requested the stolonctl addresses of the live slaves and generated a config for HAProxy, redirecting requests for them.
The following picture came out: requests from applications go to the stolon-proxy port, which redirects them to the master, and requests from analysts (they are always read-only) to the HAProxy port, which throws them to some slave.
Also, literally today, PR was adopted in Stolon, which allowed to give information about Stolon instances to third-party service discovery.
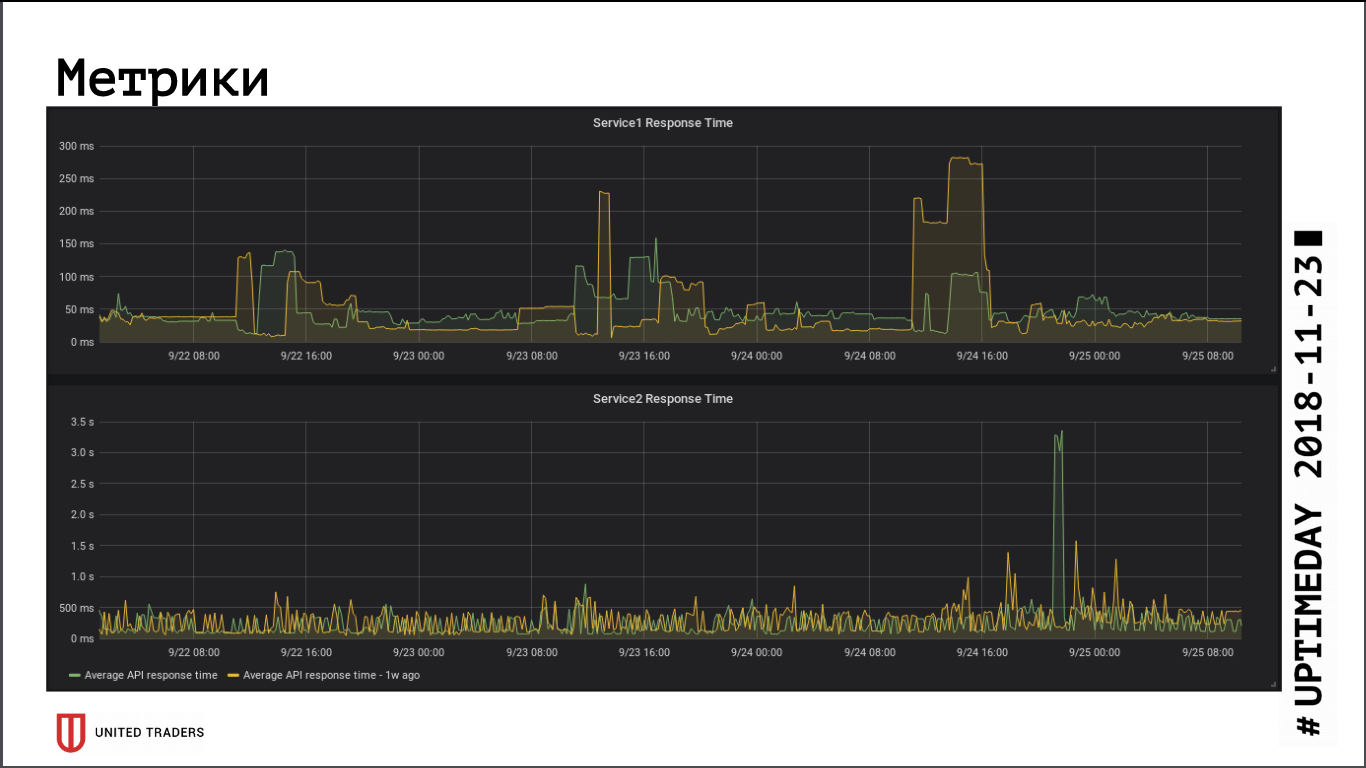
As far as can be judged by the application response rate metrics, the transition to a remote cluster did not have a significant impact on performance, the average response time remained almost unchanged. The resulting network latency was apparently compensated by the fact that the database is now on a dedicated server.
Stolon is experiencing a wizard crash without any problems (server loss, network loss, disk loss) when the server comes to life - he automatically repositions the replica. The weakest point in Stolon is etcd, a cluster fails in it. We had a typical crash: a cluster of three etcd nodes, two got out. Everything, the quorum was violated, etcd moved to unhealthy status, the Stolon cluster does not accept any connections, including requests from stolonctl. Recovery scheme: we turn etcd on a surviving server into a single-node cluster, then we add the members back. Conclusion: to survive the death of two servers, you must have at least 5 etcd instances.
Monitoring and catching mistakes
With the growth of infrastructure and the complexity of microservices, I wanted to collect more information about what is happening inside the application and the Java machine. We failed to adapt Zabbix to the new environment: it is very inconvenient in the context of changing infrastructure. It was necessary either to crush crutches through its API, or to go inside with hands, which is even worse. Its database is poorly adapted to large loads, and in general it is very inconvenient to put all this in a relational database.
In the end, we chose to monitor Prometheus. He has an actuator out of the box for Spring applications to provide metrics, for Kafka they screwed the JMX Exporter, which also provides metrics in a comfortable way. Those exporters that were not found "in the box", we wrote ourselves in Python, there are about ten of them. We visualize Grafana, the logs are collected by Graylog (since he now supports Beats).
To collect errors, use Sentry . He records everything in a structured form, draws graphics, shows what happened more often, and less often. Usually, developers immediately after deploying go to Sentry, see if there is a peak, or if there is an urgent need to roll back. It turns out to quickly catch errors without picking in the logs.
That's all for now, if the format of articles suits the readers, we will continue to talk about our infrastructure further, there is still a lot of fun: Kafka and solutions for analytics of events passing through it, CI / CD path for Windows applications and the adventure with Openshift.
Source: https://habr.com/ru/post/443530/
All Articles