How not to turn into a dragonfly if you have a lot of different databases

The photo is a macro-eye of a dragonfly. They have a faceted structure and consist of approximately 30,000 hexagonal facets, which allows the dragonfly to look almost 360 degrees (with the exception of the “straight back” direction). Useful skill if you are a dragonfly.
When the organization has a zoo of databases, and their unification on the horizon is not even visible, efforts should be made to manage and monitor their work. Look again at the dragonfly.
')
The article describes the Foglight for Databases monitoring tool, which integrates SQL Server monitoring, Oracle, MySQL, PostgreSQL, DB2, SAP ASE, MongoDB, and Cassandra in one console. It also has a light touch of DevOps in terms of logging changes to the database configuration. Everything in order. There are a lot of screenshots under the cut.
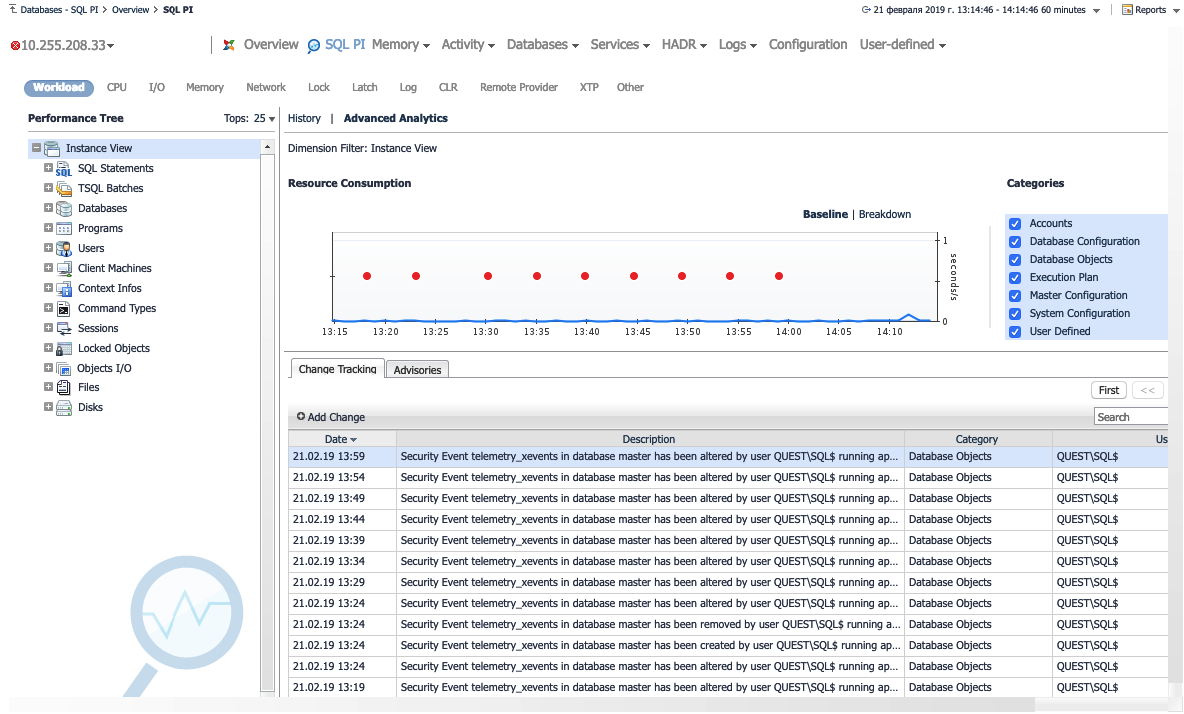
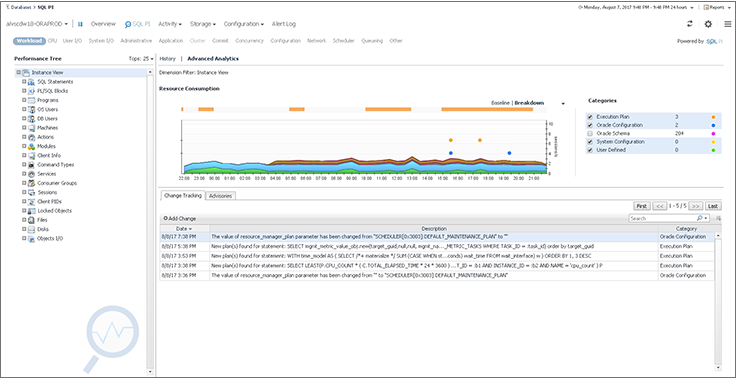
Why did we mention DevOps before katas? One of the vending chips Foglight is the ability to manually release releases and generally any changes on the timeline. Developers themselves can make data about changes and after some time here get feedback in the form of reduced or improved performance. In automatic mode, the tracked changes are also noted: changes in the Execution Plan or database configuration - all this will be present on the chart.
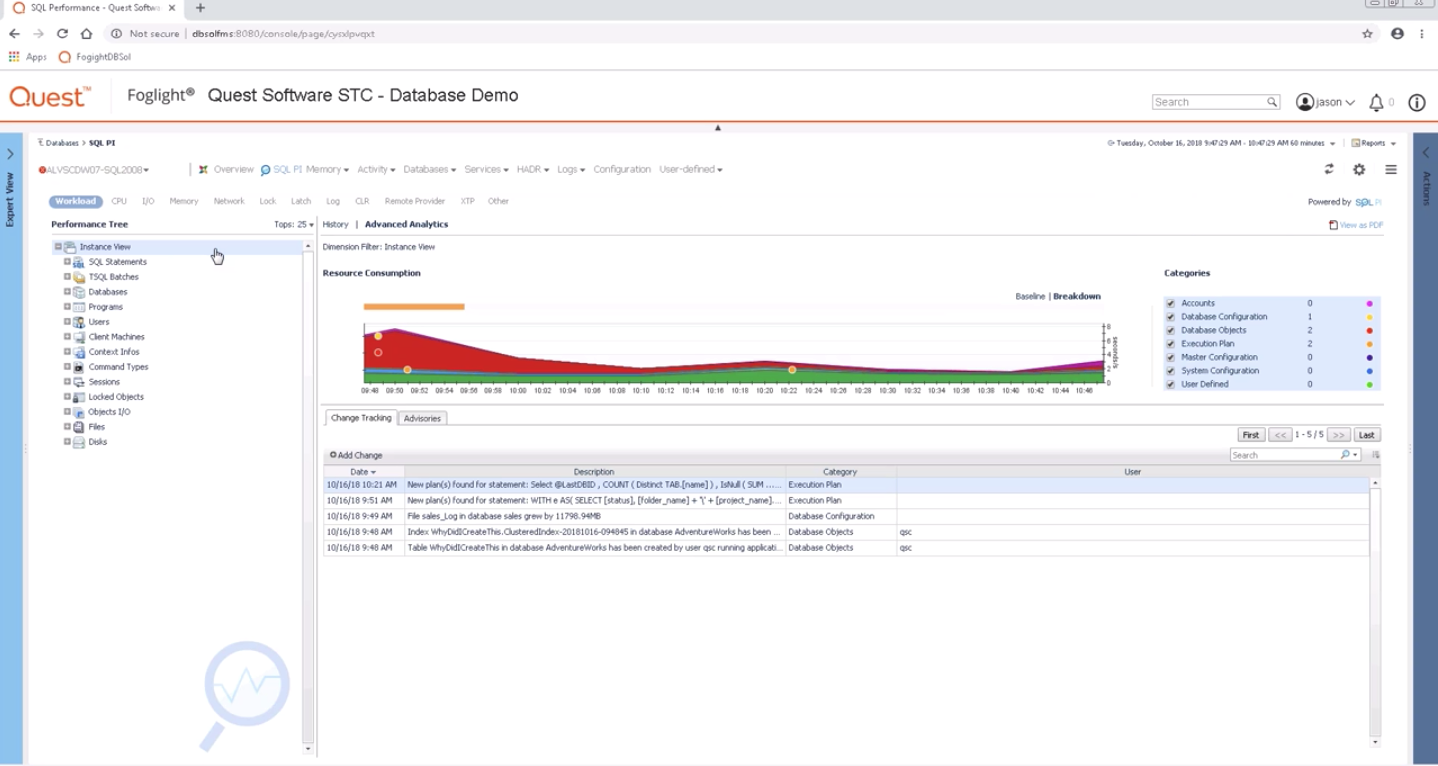
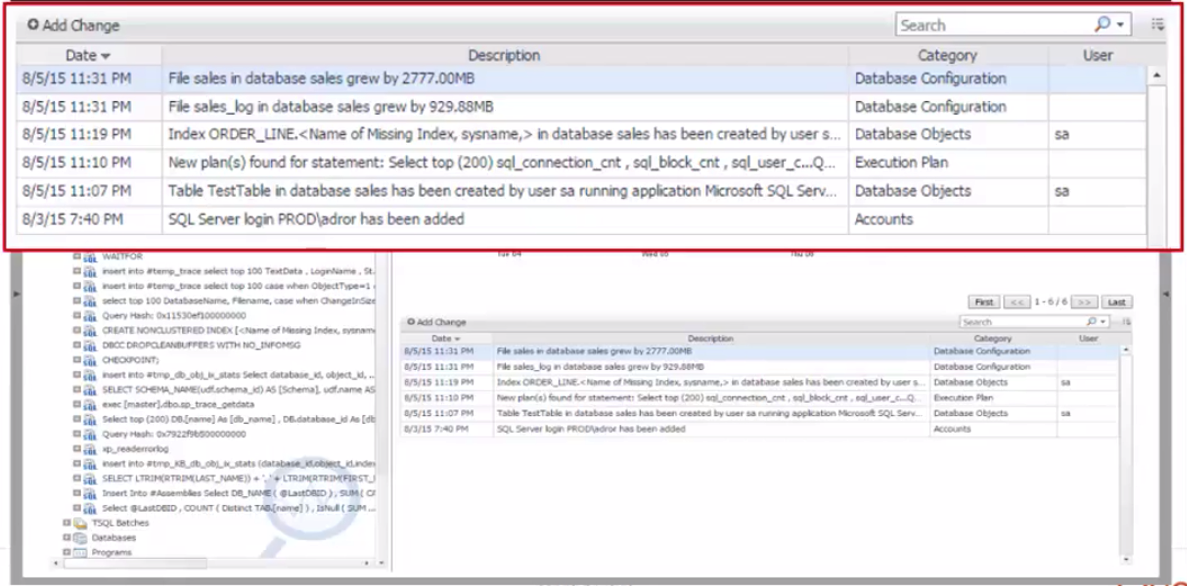
Examples of changes.
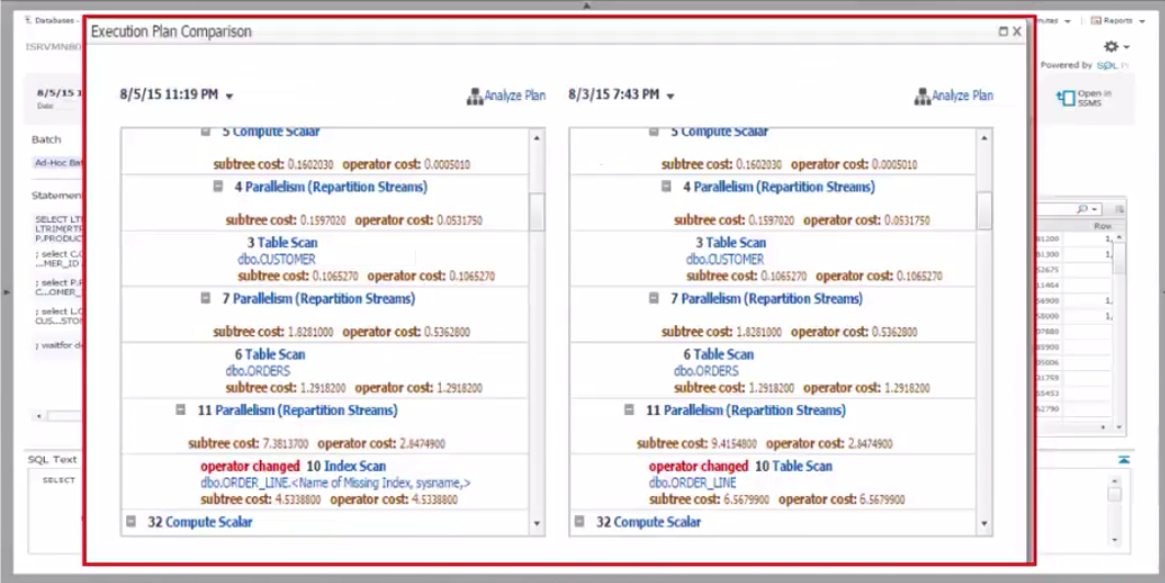
From here you can go to another view and compare the changes in the Execution Plan.
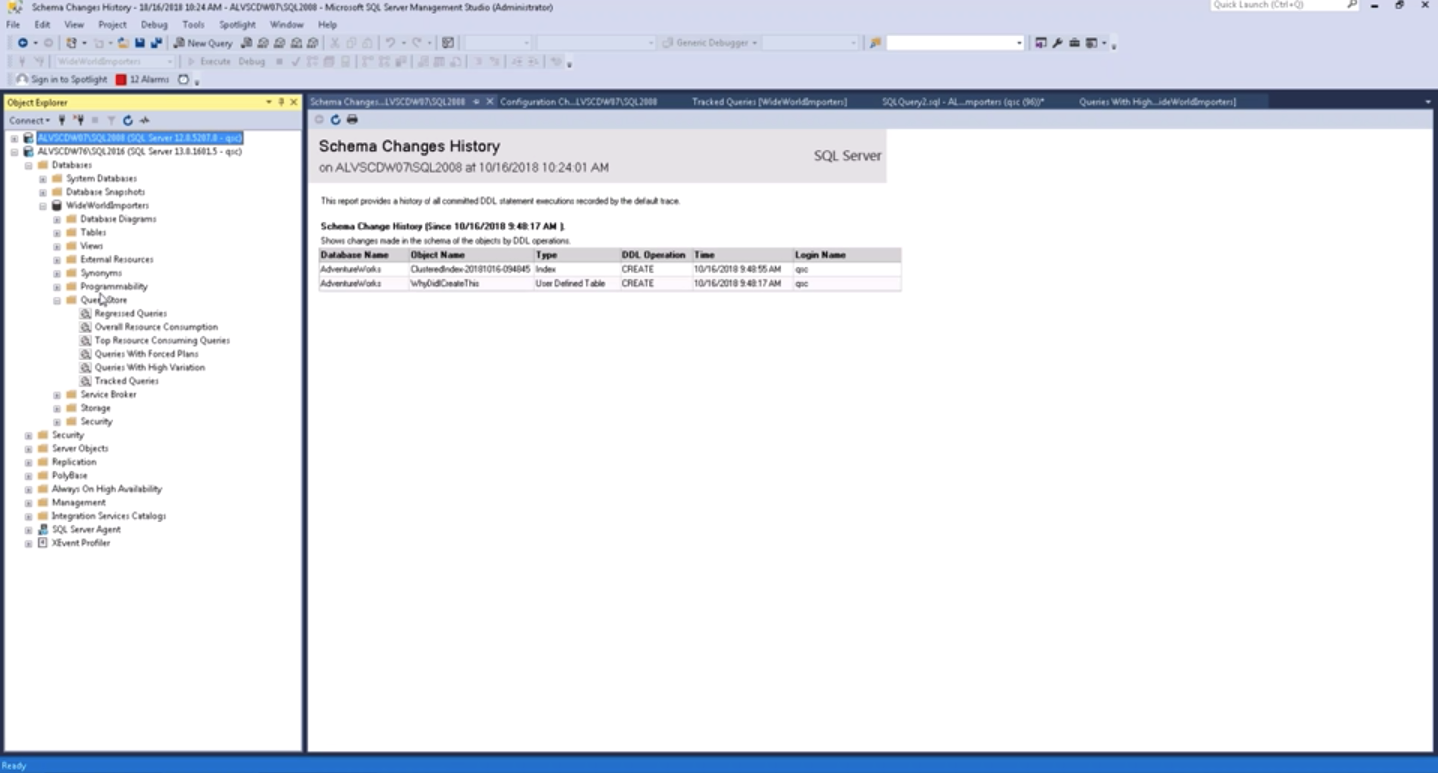
Here are also a couple of good ways to audit changes, but on a regular basis, the execution of such reports is not very convenient.

How well is the communication channel between developers and DBAs? Do colleagues learn about all the changes in time? What if a new release spawned a sporadic problem that began to manifest itself on a regular basis and slows down the application?
We do not want to say that this tool will finally establish contact between the developers and the operation, however, it will add to the developers an additional channel for receiving feedback.
Further in the article we will show the monitoring possibilities for each of the supported databases.
Microsoft SQL Server
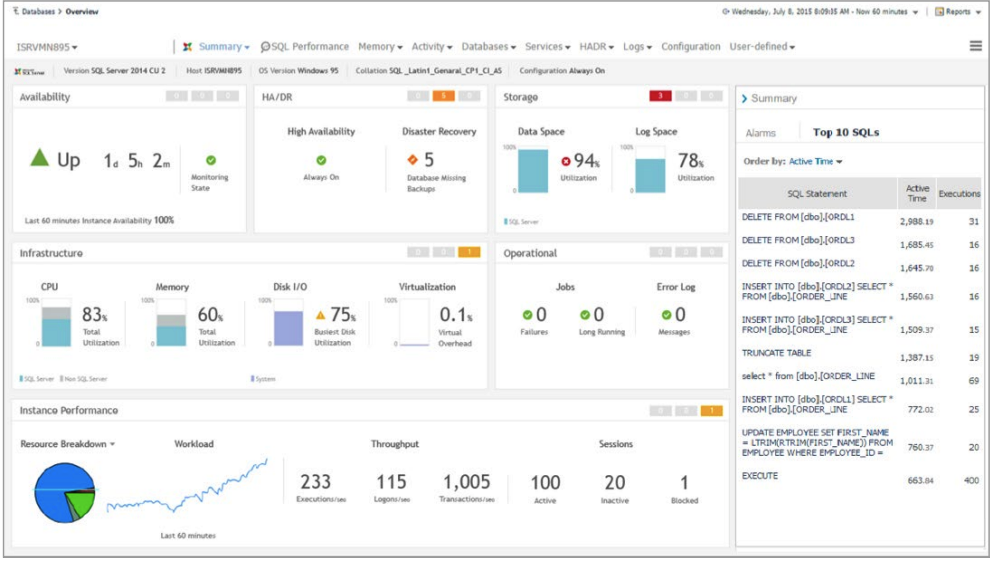
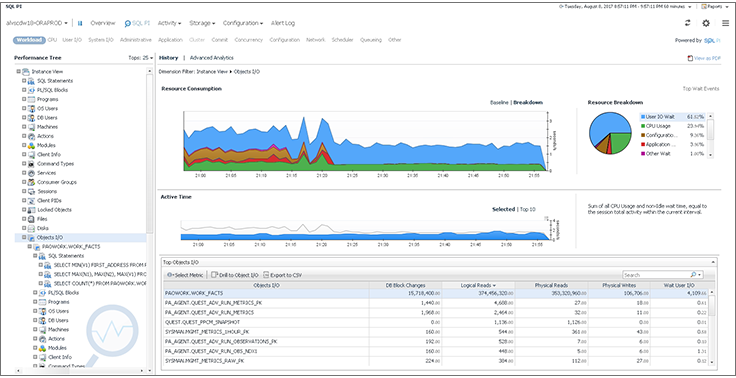
A key feature of SQL Server monitoring in Foglight for Databases is the availability of the Performance Investigator tool, which performs multidimensional analysis of database performance in sections across databases, long queries, sessions, users, executable scripts, workstations, and applications.
Another feature is support for SSIS, SSRS and SSAS technologies. For example, below is an overview with SSIS metrics.
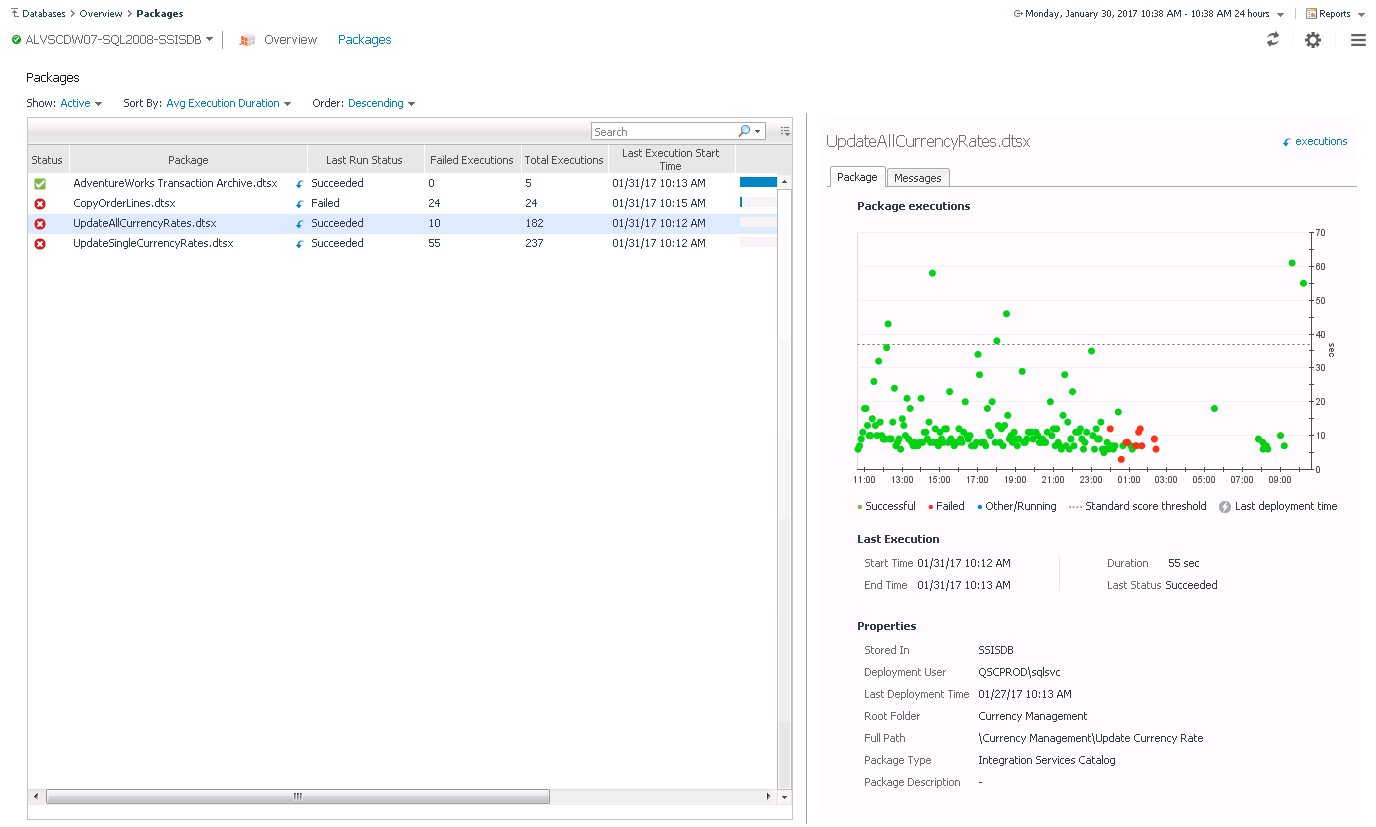
From the presentation above, you can “fall through” to the level with detailing up to the packages and identify problem ones.
Additionally, Foglight has a view with configuration variables, where you can track changes in the value of a particular variable.

Many views duplicate reports that can be built in Management Studio. Monitoring is conducted remotely, and the total overhead projector does not exceed 2%. The current version of Foglight supports SQL Server versions from 2005 to 2017.
Oracle
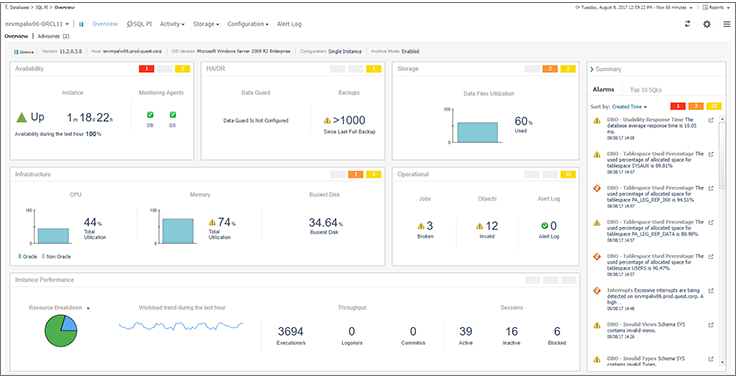
To monitor the Oracle database, Foglight also provides the Performance Investigator tool. The concept of its work is in many respects similar to the approaches for monitoring SQL Server, based on a multidimensional analysis of database performance.
RAC, Exadata, ASM and Data Guard technologies are supported.
My sql
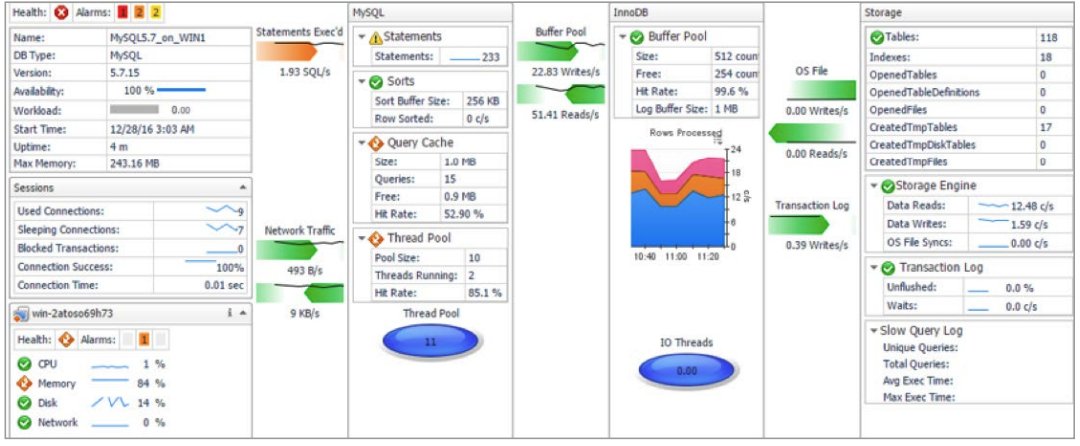
Monitoring My SQL covers the main indicators (including one-to-one and one-to-many replication) and tracks changes in the database configuration similar to SQL Server and Orale. You can create your own configuration templates, compliance with which will also be monitored.
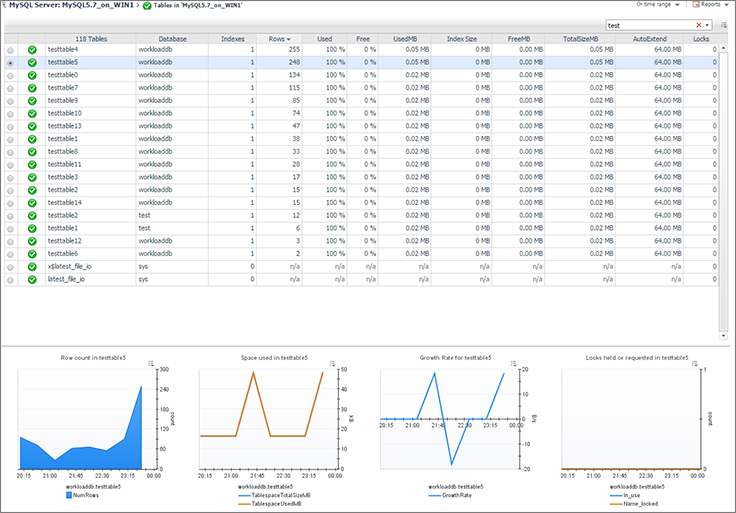
Foglight can control the parameters of query execution in the database. It does this with the explain method. There are special views on the tables of various My SQL databases on a single screen. From a single point you can control hundreds of databases and with a small overhead (no more than 2%).
Postgre sql
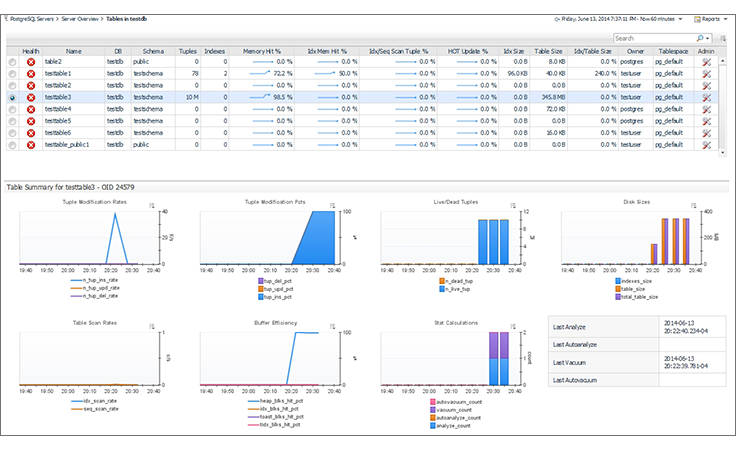
In the module for monitoring Postgre SQL, there are views of a helicopter view for reviewing key database performance indicators, a review of table indicators.
Replication monitoring and WAL (Write-Ahead Logging) execution monitoring are supported on both the sender and receiver side.
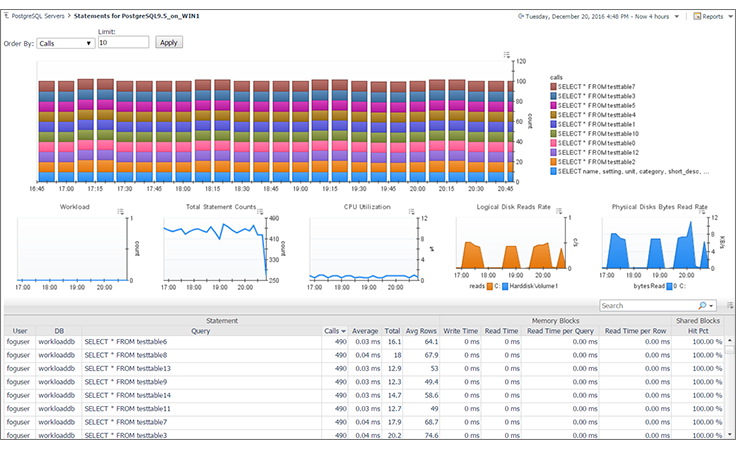
In the Foglight console, you can customize the view with performance metrics for critical queries and compare them with similar ones on a different database on the same screen. For each such request, you can also perform analyze analyze and monitor the relevant indicators.
Monitoring of PostgreSQL databases is also performed remotely, and the overhead does not exceed 2%.
DB2
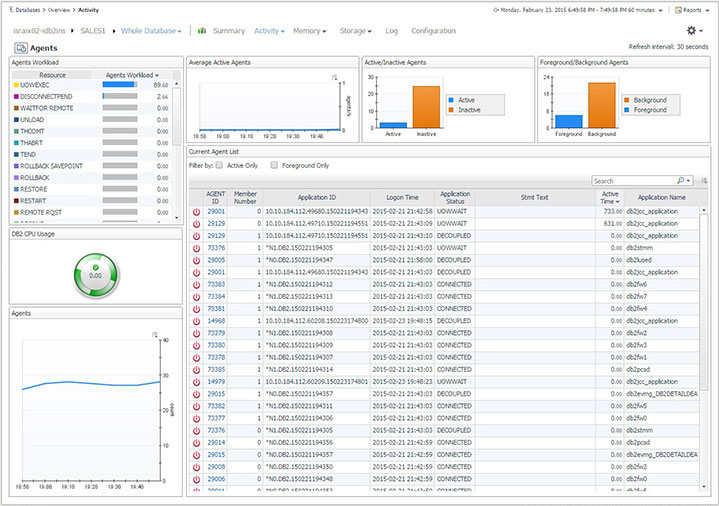
After setting up monitoring, the basic DB2 metrics can be immediately seen on the aggregate dashboard.

DB2 database monitoring is performed non-agently with an overhead, on average not exceeding 2%.
In one of the interfaces, you can control the load on agents by applications that run through these agents.
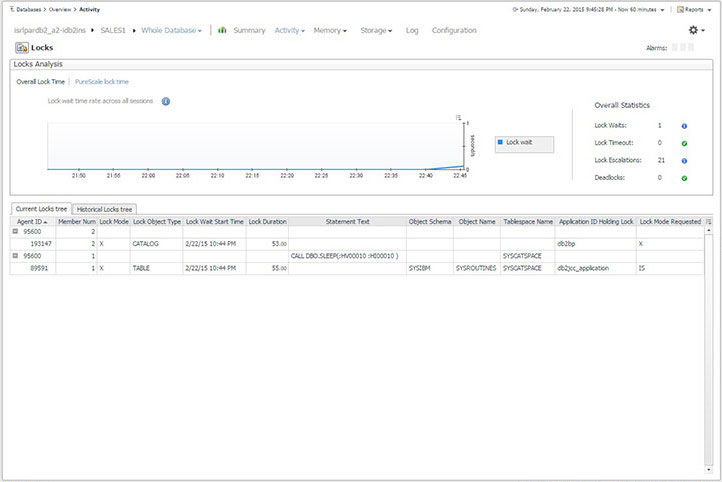
In the screenshot below, dashboards with locks. From each dashboard you can make a report. Including on a regular basis.
If necessary, you can track heavy requests.
With the help of the module for DB2 DBMS, you can control the configuration and perform the automatic launch of new databases on monitoring.
SAP ASE
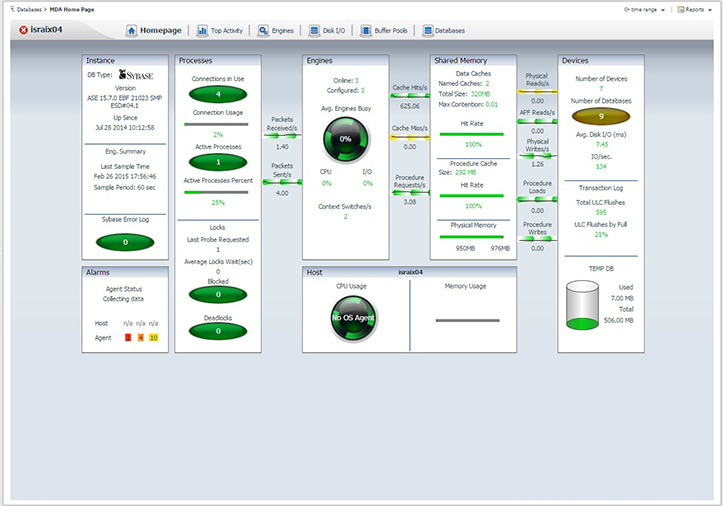
For each SAP ASE database that is being monitored, there is an aggregate view for viewing the main health metrics.
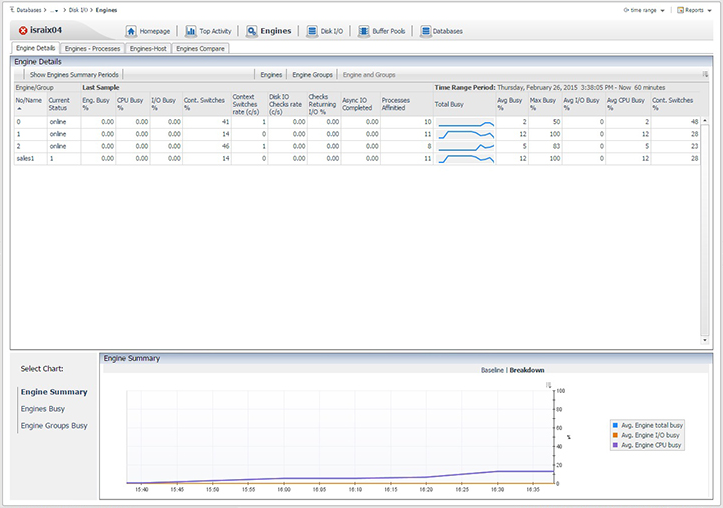
For each database engine more detailed data is available. Switching between tabs, you can view related processes and compare performance.
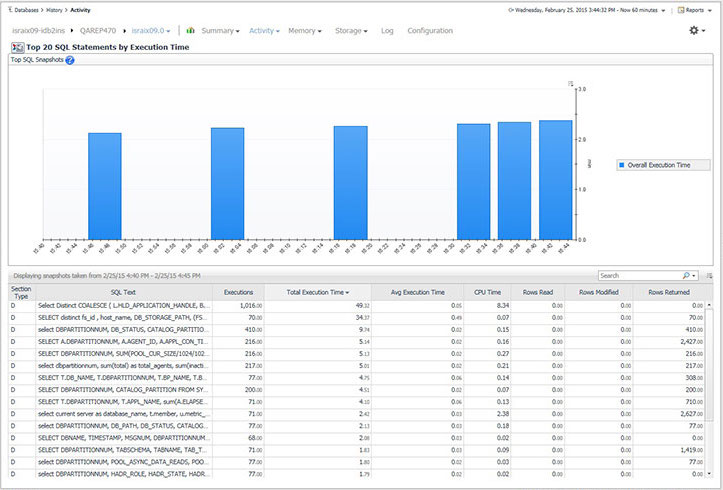
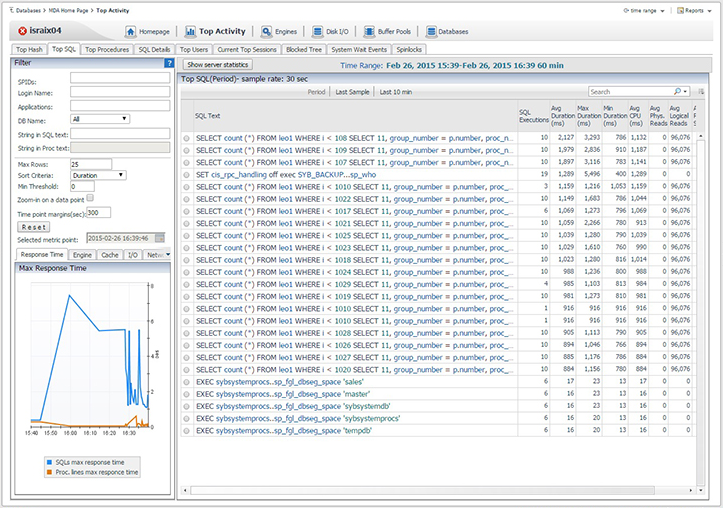
In the corresponding view, you can track performance indicators in a multidimensional form by requests, procedures, users, locks and other related elements.
The module for SAP ASE supports remote monitoring. On the basis of all the collected data, you can create your own dashboards and reports.
MongoDB
As with previous DBMSs, MongoDB is monitored remotely. After setting up the monitoring, an aggregate view will be available with basic monitoring metrics.
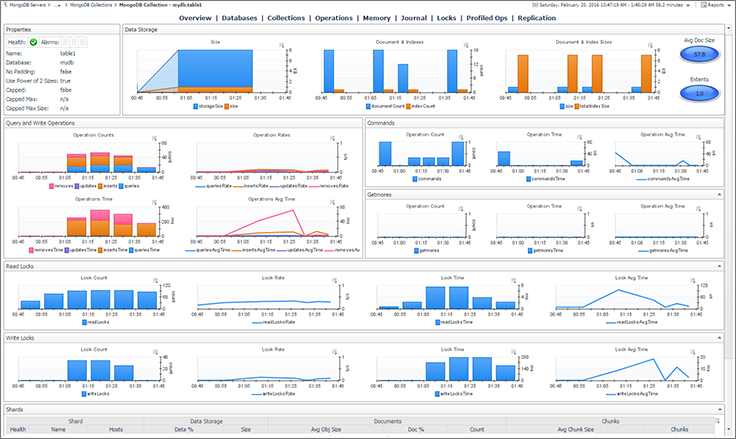
In the upper part of the dashboard there are links to additional views, on which you can view metrics on databases, operations, journals, etc ... For example, below is a presentation on operations.
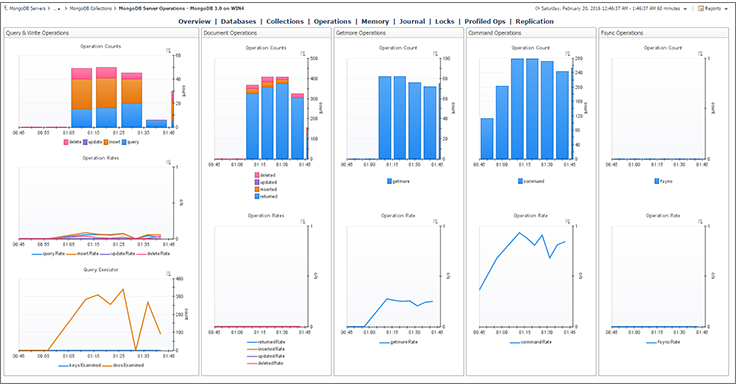
When profiling is enabled in the DBMS settings, you can select and display all relevant metrics on dashboards. If the database has a replica, Foglight will also control things like member status, health, and others.
Additional useful functionality - monitoring the configuration of the node, the comparison with the standard and alert in case of changes.
Cassandra
Installing an agent on the nodes is not required, everything happens remotely and with a minimum overhead. After setting up monitoring Cassandra, a set of dashboards with database performance indicators appears in Foglight.
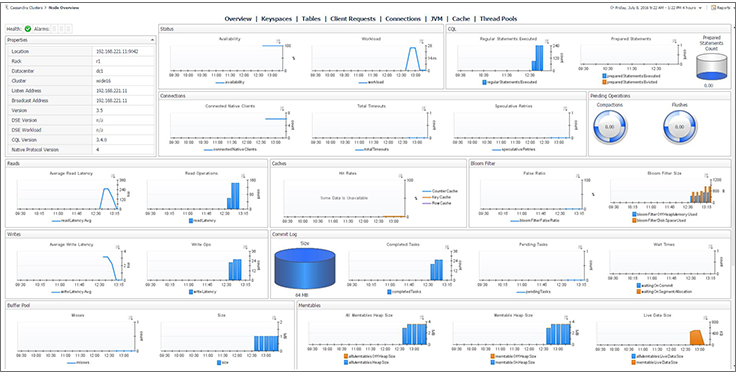
Foglight supports control of the keyspace for nodes in a cluster, their comparison in performance (number of accesses to objects, read / write readings, delay). Nodes can also be compared by configuration, number of processed messages, messages with errors, etc.

In the screenshot below, the Foglight for Cassandra interface and JVM performance view.
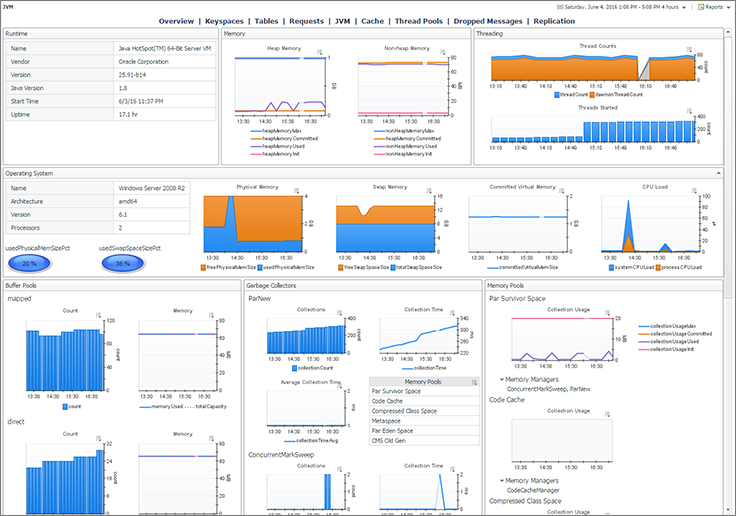
Of all the metrics collected, you can design your own dashboards and reports.
Conclusion
Thank you for reading and inspect this place. To summarize
- Foglight for Databases supports monitoring SQL Server, Oracle, MySQL, PostgreSQL, DB2, SAP ASE, MongoDB, and Cassandra.
- In addition to the performance of the DBs themselves, Foglight also controls their configuration.
- Data on different DBMS can be combined on one dashboard (what if you need it?).
- Monitoring of all DBMS is performed remotely with an overhead monitor not exceeding 2%. From one point you can control all bases.
- Foglight for Databases has a REST API from which you can take metrics or events to external dashboarding, reporting, or alerting. If there is an umbrella monitoring system, it can also be integrated into it.
- In addition to the database Foglight can and virtualization (VMware, Hyper-V, Openstack), storage, servers, AD, Exchange.
You can learn more about Foglight for Databases. You can leave an application for a pilot project or a distribution kit and test licenses (if you want to do everything yourself) via the feedback form on the site .
Source: https://habr.com/ru/post/443238/
All Articles