App-based Kubernetes metrics scaling from Prometheus

A common situation: you have several applications, one of them has a peak load during the daytime, and during other hours no one turns to it (or only rarely turn to it); however, for other applications, the power of the cluster may be useful at night. An example of such applications are web services, some data handlers.
As usual, there is not enough cluster resources at all. We have to invent something to optimize the use of resources, and Kubernetes is perfect for this. It has a Horizontal Pod Autoscaler , which allows you to scale applications based on metrics.
')

Metrics are usually supplied by the server metrics . Then I will talk about replacing the metrics server with Prometheus (because Prometheus realizes the data that is sent to the metrics server and we get rid of one extra link) and how to scale your applications in Kubernetes based on metrics from Prometheus.
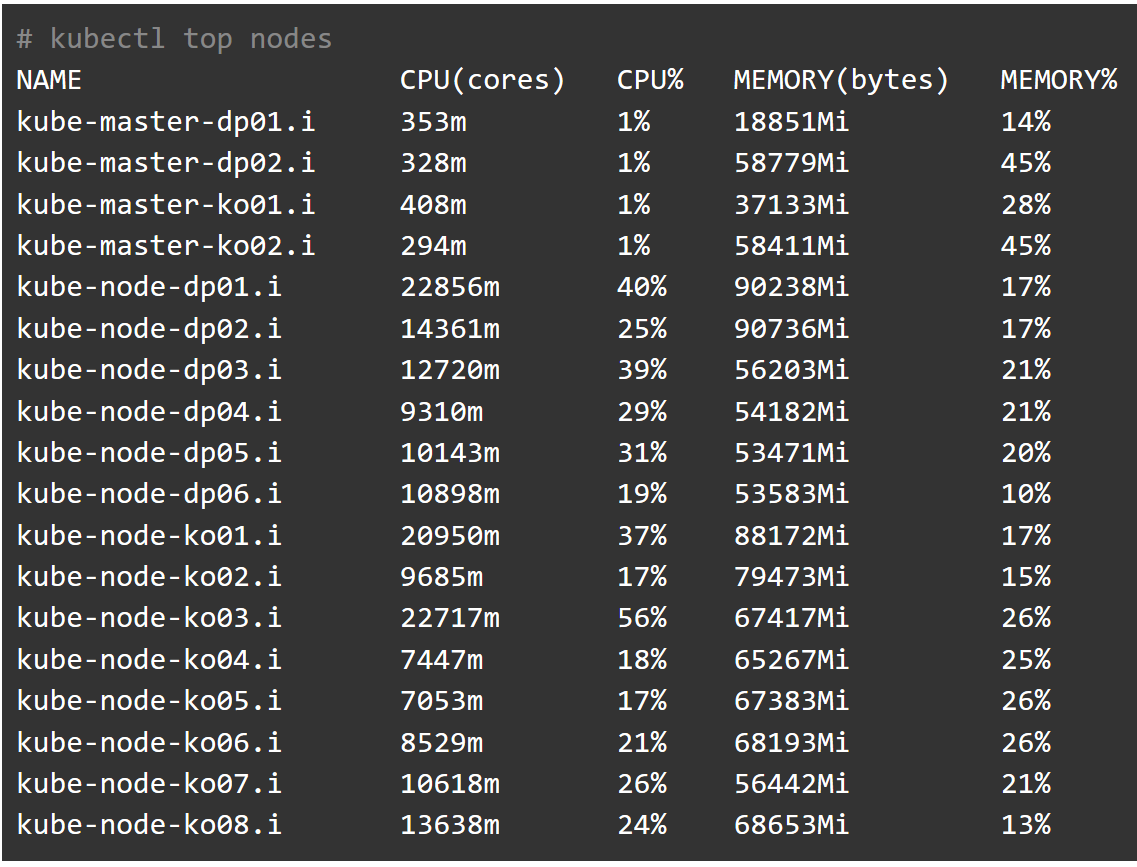
First, install Prometheus operator . Personally, I use ready-made manifestos . You can use the chart for Helm (but I did not check its performance). Also delete the server metrics if you have one. After that, check if everything works as it should.
# kubectl get --raw "/apis/metrics.k8s.io/v1beta1/" | jq { "kind": "APIResourceList", "apiVersion": "v1", "groupVersion": "metrics.k8s.io/v1beta1", "resources": [ { "name": "nodes", "singularName": "", "namespaced": false, "kind": "NodeMetrics", "verbs": [ "get", "list" ] }, { "name": "pods", "singularName": "", "namespaced": true, "kind": "PodMetrics", "verbs": [ "get", "list" ] } ] } Then apply the manifests from this directory . This will install Prometheus-adapter. I found a chart that contains these manifestos, but did not check it. After that, you should correctly execute the command:
kubectl get --raw "/apis/custom.metrics.k8s.io/v1beta1" | jq (there will be a very large list, so I do not cite it here)
The documentation can help you figure out what the metrics.k8s.io URLs and custom.metrics.k8s.io mean.
If something does not work, then look, as usual, in the logs. You can also search for a solution in the issues .
Now set up autoscaling.
I have an application that consumes a lot of CPU resources and serves a queue. As soon as the queue size exceeds a certain threshold, I want to increase the number of pods in the replica set in order to process the queue faster. As soon as its size becomes less than the threshold, the cluster resources should be freed.
To understand how to write rules for Prometheus-adapter, you must carefully read this document and its associated pages. Here's what it looks like from me.
Request to Prometheus
wqueue_tube_total_size{tube="dmload-legacy"} returns me:
wqueue_tube_total_size{endpoint="pprof-port",instance="10.116.2.237:8542",job="wqueue-pprof",namespace="default",pod="wqueue-b9fdd9455-66mwm",service="wqueue-pprof",tube="dmload-legacy"} 32 And I am writing the following rule for Prometheus-adapter:
- seriesQuery: wqueue_tube_total_size{tube="dmload-legacy"} resources: overrides: namespace: resource: namespace tube: resource: service name: {as: "wqueue_tube_total_size_dmload_legacy"} metricsQuery: wqueue_tube_total_size{tube="dmload-legacy"} It should be noted that I have to set the
tube parameter in the service , so that later I can use hpa in the description.Hpa configuration:
--- kind: HorizontalPodAutoscaler apiVersion: autoscaling/v2beta1 metadata: name: dmload-v3-legacy namespace: default spec: scaleTargetRef: apiVersion: apps/v1 kind: Deployment name: dmload-v3-legacy minReplicas: 2 maxReplicas: 20 metrics: - type: Object object: metricName: wqueue_tube_total_size_dmload_legacy target: apiVersion: v1 kind: Service name: dmload-legacy targetValue: 30 Here I indicate that as soon as the number of tasks in the
wqueue_tube_total_size_dmload_legacy queue exceeds 30, you need to add feeds until they are 20, and if targetValue drops below 30, then decrease to 2.Apply and see what happens. The system works for me for several days and at the moment just reduces the number of pods:
# kubectl describe hpa dmload-v3-legacy Name: dmload-v3-legacy Namespace: default Labels: <none> Annotations: kubectl.kubernetes.io/last-applied-configuration: {"apiVersion":"autoscaling/v2beta1","kind":"HorizontalPodAutoscaler","metadata":{"annotations":{},"name":"dmload-v3-legacy","namespace":"d... CreationTimestamp: Thu, 24 Jan 2019 16:16:43 +0300 Reference: Deployment/dmload-v3-legacy Metrics: ( current / target ) "wqueue_tube_total_size_dmload_legacy" on Service/dmload-legacy: 14 / 30 Min replicas: 2 Max replicas: 20 Deployment pods: 15 current / 14 desired Conditions: Type Status Reason Message ---- ------ ------ ------- AbleToScale True SucceededRescale the HPA controller was able to update the target scale to 14 ScalingActive True ValidMetricFound the HPA was able to successfully calculate a replica count from Service metric wqueue_tube_total_size_dmload_legacy ScalingLimited False DesiredWithinRange the desired count is within the acceptable range Events: Type Reason Age From Message ---- ------ ---- ---- ------- Normal SuccessfulRescale 59m (x14 over 40h) horizontal-pod-autoscaler New size: 13; reason: All metrics below target Normal SuccessfulRescale 59m (x13 over 40h) horizontal-pod-autoscaler New size: 12; reason: All metrics below target Normal SuccessfulRescale 57m (x14 over 40h) horizontal-pod-autoscaler New size: 11; reason: All metrics below target Normal SuccessfulRescale 56m (x14 over 40h) horizontal-pod-autoscaler New size: 10; reason: All metrics below target Normal SuccessfulRescale 56m (x11 over 38h) horizontal-pod-autoscaler New size: 8; reason: All metrics below target Normal SuccessfulRescale 55m (x6 over 36h) horizontal-pod-autoscaler New size: 7; reason: All metrics below target Normal SuccessfulRescale 47m (x103 over 40h) horizontal-pod-autoscaler (combined from similar events): New size: 20; reason: Service metric wqueue_tube_total_size_dmload_legacy above target Normal SuccessfulRescale 3m38s (x19 over 41h) horizontal-pod-autoscaler New size: 17; reason: All metrics below target Normal SuccessfulRescale 2m8s (x23 over 41h) horizontal-pod-autoscaler New size: 16; reason: All metrics below target Normal SuccessfulRescale 98s (x20 over 40h) horizontal-pod-autoscaler New size: 15; reason: All metrics below target Normal SuccessfulRescale 7s (x18 over 40h) horizontal-pod-autoscaler New size: 14; reason: All metrics below target Everything described was performed on Kubernetes 1.13.2.
Conclusion
In this short note, I showed how using metrics from Prometheus to automatically scale applications in a Kubernetes cluster.
The Prometheus-operator components have been configured and the necessary manifests have been created.
As a result, based on the metrics from Prometheus about the size of the queue it turned out to increase or decrease the number of pods that process this queue.

(the graph shows how the number of pods varies depending on the size of the queue)
Thanks for attention!
Source: https://habr.com/ru/post/442638/
All Articles