Machine learning in IT monitoring
Introduction

Netcracker is an international company, a developer of integrated IT solutions, including services for the placement and support of client equipment, as well as hosting an established IT system for telecom operators.
These are mainly decisions related to the organization of operating and business activities of telecom operators. More details can be found here .
The continued availability of the solution being developed is very important. If the telecom operator stops billing for at least one hour, this will lead to large financial and reputational losses for both the operator and the software supplier. Therefore, one of the key requirements for a solution is the availability parameter, the value of which varies from 99.995% to 99.95% depending on the type of solution.
')
The solution itself is a complex set of central monolithic IT systems, including complex telecom equipment and service software located in a public cloud, as well as a multitude of microservices integrated with the central core.
Therefore, it is very important for the support team to monitor all hardware and software systems integrated into a single solution. Most often the company uses traditional monitoring. This process is well established: we are able to build a similar monitoring system from scratch and know how to properly organize incident response processes. However, in this approach there are several difficulties that we face from project to project.
- What to monitor
Which metric is important at the moment, and which will be important in the future? There is no unequivocal answer, so we are trying to monitor everything . The number one difficulty is the number of metrics. There are problems with performance, operating deshboards more and more often resemble the control panel of a spacecraft.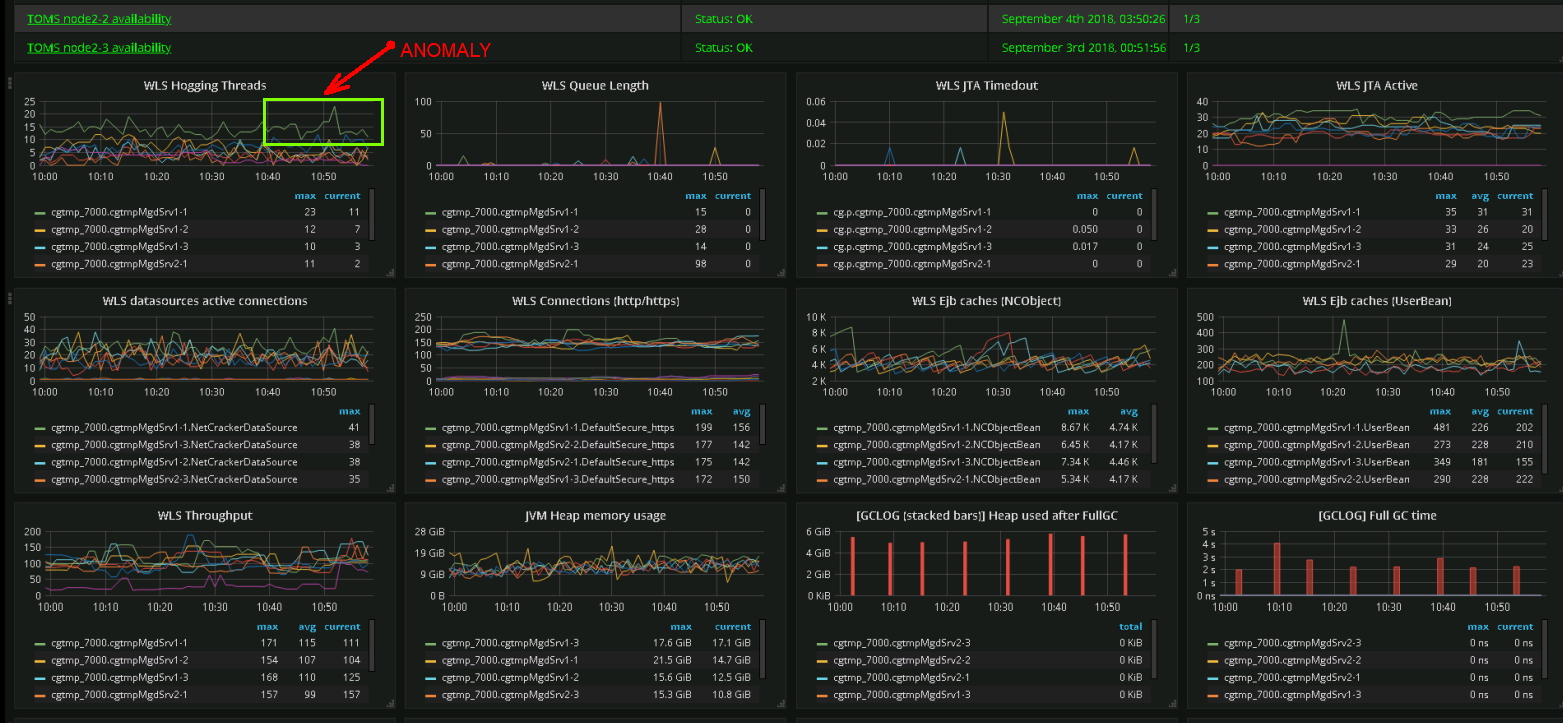
Screenshot real dashboard. Support team engineers can determine abnormalities in the system behavior by their graphical representation. - Alerting / thresholding
Despite the fact that we have experience in operating many large systems, their monitoring is still a daunting task due to the specific equipment used and the software versions of various suppliers. Experience and ready-made rules often cannot be completely transferred from one solution to another. There is a certain basic set, the improvement of which occurs iteratively, as the incidents that occur during the operation of the solution are analyzed.
The complexity of the number two - the lack of clear rules settings. - Interpretation of the result
When an incident occurs, it is very important to locate it quickly. This largely depends on the experience of the support team, since under the shaft of secondary reports of failures one can overlook the main cause of the problems and lose time for prompt response. And this is complexity number three.
With the help of properly organized processes, the team is able to cope with the above complexities, but the modern request for a reactive solution change - when the time to go from idea to implementation is measured in days - makes the task much more difficult. Continuous team training is required. Constant changes lead to the fact that certain rules and cause-and-effect relationships lose their meaning and, as a result, an incident, without being eliminated in time, can turn into an accident.
How machine learning helps us
Predicting the failure of hardware-software complexes becomes a very popular function of a preventive or reactive response to incidents. NEC Corporation, our parent company, invests heavily in the development of the monitoring idea. One of the results of this investment was the patented System Invariant Analysis Technology (SIAT) technology .
SIAT is a machine learning technology that, among a set of sensor data or metrics presented as time series, finds constant functional relationships using ML algorithms and builds a common model — the graph of these relationships. Details can be read here .

Figure illustrating the relationship found between the sensors of physical objects
The idea, originally developed for IT systems, has now become widespread only for monitoring physical complexes, such as plants, factories, nuclear power plants. The company Lockheed Martin , for example, introduces these technologies in its space division. In 2018, Netcracker, in conjunction with NEC, rethought this idea and created a product that can be used to monitor IT systems as a tool for additional analytics. Important : this is only an addition to the monitoring system, but not its replacement.
SIAT applications for IT systems
What is the difference between a physical complex and a software one? In software systems, metrics are used, in physical - sensors. The metrics are used much more, since the physical sensor always costs money and is only placed where it makes sense. Programmatic metrics, being properly organized, cost nothing. In addition, information metrics data systems are much more difficult to properly interpolate to the state of the system. It is easier for a person to understand sensors related to the physical world, whereas specific values of software metrics make sense only in relation to a specific hardware, configuration, and load.
Also, the functional relationship in the model assumes that if we replace the hardware or the software version (for example, OS patches) and all operations become equally faster or slower, then this will not lead to false reports of accidents due to the fact that we have not changed thresholds . If the metrics no longer correlate with each other, this means a deviation from the norm in the behavior of the system. Moreover, the SIAT technology allows to detect even small deviations of behavior in real time, including the so-called silent failures - failures in work that are not accompanied by any error messages. And if this deviation is just a harbinger of a more widespread failure, we have time to respond correctly.
We checked this statement by simulating a small Apache Web Server under load, emulating internal errors using the Fault Injection mechanism in Linux .
The result is presented in the form of the Anomaly Score numerical metric, the value of which is associated with this model. The larger the value, the more serious the failure: the more metrics behave abnormally. The limit value - 100% of metrics are abnormal, the system does not work. In addition, the result indicates those metrics whose behavior at the given moment can be considered abnormal. This significantly speeds up the analysis of the cause and identification of the subsystem, which is currently failing within the framework of the current behavior model.
In general, SIAT allows you to react even to minor changes in behavior that are practically undetectable using traditional or baseline monitoring.
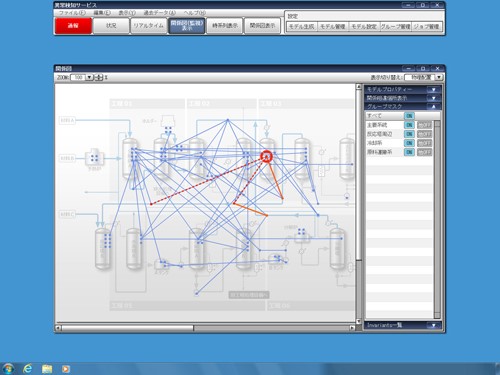
Figure illustrating the violation of the relationship between sensors
An additional advantage of SIAT is the algorithm for constructing a model of behavior that does not require the indication of any business sense of the metrics. The algorithm automatically selects all metrics whose behavior is interconnected with each other, and this relationship is constant. The remaining isolated metrics are either point subsystems that do not affect the IT solution, or metrics that are not important for the state of the solution at the moment. If it makes sense, the monitoring of such metrics is implemented within the framework of the traditional approach based on threshold alerting .
It is very important that creating a model requires data related to the normal functioning of the system, which is much simpler than with the accident training approach.
The model is further refined and rebuilt if the behavior has changed or we have added new metrics to it.
Since the normal behavior of the system is a variable characteristic that depends on the time of day and other business conditions, for a more accurate response it makes sense to create several models that describe the behavior of the system in certain conditions.
What is the process
The monitoring process is as follows.
- We start traditional monitoring. Very important is the correct choice of the name of the metrics. The fact is that the result includes the names of metrics whose behavior is abnormal, which means that the more accurately the metric describes the place and meaning, the faster the result will be obtained. For example, a metric named ncp. erp_netcracker _com.apps.erp. clust4.wls .jdbc. LMSDataSource . ActiveConnectionsCurrentCount indicates that in the Netcracker ERP system , the fourth Weblogic-cluster for the LMSDataSource fails the metric named ActiveConnectionsCurrentCount . For an expert, such information is more than enough to accurately localize the anomaly.
- Next, we integrate with the data storage system of metrics - in our case, ClickHouse - and we obtain data from all metrics for a certain period of normal solution behavior: the best models are built on the basis of 30-day monitoring results. For more accurate models, we use these metrics by the minute without any aggregation.
- Build a model using SIAT based on data from the monitoring system. Within the framework of the constructed model, we filter out functional relationships by the degree of similarity. In short, this is the degree of deviation of behavior from a given one, expressed as a percentage.
- We check the model on the data of previous days, where failures were detected using traditional monitoring and support teams.
- We start online monitoring: every 10 minutes, the data of all metrics are transmitted to the model or models. We get the result - anomaly score, and if the result is not zero, in addition we get a list of metrics whose behavior is currently abnormal.
- The result is sent to the general monitoring system, where it becomes part of common dashboards and other traditional monitoring tools.
Tests
No implementation takes place without checks. We chose our own ERP (monolith, Weblogic , Oracle , 4500 metrics) and the routing system of our entire monitoring system, 7 million metrics per minute, carbon-c-relay (1200 metrics) as test systems.
Dumps of all metrics were used as input data, and the days on which failures were recorded were also indicated. To evaluate the result, we introduced the following concepts:
- The number of errors of the second kind - when the traditional monitoring system or the support team found a failure, but the SIAT did not.
- The number of correct detections is when both traditional monitoring and SIAT have discovered a problem.
- The number of errors of the first kind is when SIAT detected a deviation of behavior, and the support team did not detect it.
We did not find a single error of the second kind for both systems tested. The number of correct detections — 85% of the total number of failures found by SIAT , and in the case of a hardware failure — failed the RAID array on the database — SIAT detected degradation of behavior with an exact indication of the metrics associated with the database seven hours before reaching set threshold in the monitoring system.
The remaining 15% of these SIAT failures are attributable to errors of the first kind — anomalous behavior that the support team cannot explain. This is probably due to the fact that when building a model, those metrics that have a functional sense but do not have a noticeable effect on the overall behavior of the system were automatically included. After several false positives, the IT expert may mark these metrics as unimportant and remove them from the model, having previously agreed with SME .
The results showed that this product fully automates the process of detecting failures (including hidden ones), timely localizing the incident and assessing its scale.
What's next
Now we are accumulating experience in using the product for various types of hardware and software systems in order to analyze the applicability of this approach to various systems: network devices, IoT devices, cloud microservices, and so on.
At the moment, the task of rebuilding the model is the bottleneck. This requires significant computational power, but, fortunately, the recalculation can be performed on an isolated machine, exporting the result as a finished model. The very same monitoring in real time does not require significant expenditure of resources and is performed in parallel with the traditional monitoring on the same equipment.
Conclusion
Summing up, I want to note that the use of a combination of traditional monitoring techniques and machine learning algorithms allows you to build a simple model that helps to respond on time, find out the origin of the problem, and keep the system in working condition.
In addition to the promising technology SIAT , we are analyzing the possibility of using another technology NEC - Next Generation Log Analytics . The technology allows the use of machine learning algorithms and the use of system logs to determine the anomalies associated with the internal state of the product, which do not affect the overall degradation of the system in terms of performance.
And what analytics for monitoring IT systems do you use?
Source: https://habr.com/ru/post/442620/
All Articles