Overclock event handling up to 1.6 million per second
When the participants of HighLoad ++ came to the report of Alexander Krasheninnikov , they hoped to hear about handling 1,600,000 events per second. Expectations did not materialize ... Because during the preparation for the performance, this figure flew to 1,800,000 - so, on HighLoad ++, reality exceeds expectations.
3 years ago, Alexander told us how they built a scalable near-realtime event handling system in Badoo. Since then, it has evolved, volumes have grown in the process, it had to solve scaling and fault tolerance tasks, and at a certain point, radical measures were needed - a change of the technological stack .

')
From the decryption, you will learn how Badoo replaced the Spark + Hadoop bundle with ClickHouse, saved hardware 3 times and increased the load 6 times , why and with what means to collect statistics in the project, and what to do with this data.
About speaker: Alexander Krasheninnikov ( alexkrash ) - Head of Data Engineering in Badoo. Engaged in a BI-infrastructure, scaling under load, leads teams that build data processing infrastructure. Loves everything distributed: Hadoop, Spark, ClickHouse. I am sure that cool distributed systems can be prepared from OpenSource.
If we have no data, we are blind and cannot manage our project. That is why we need statistics - to monitor the viability of the project. We, as engineers, should strive to improve our products, but if you want to improve, measure. I follow this motto in my work. First of all, our goal is business value. Statistics provides answers to business questions . Technical metrics are technical metrics, but business is also interested in indicators, and they should also be considered.
I define the life cycle of statistics with 4 points, about each of which we will talk separately.
In the application, we collect several metrics. First of all, these are business metrics . If you have a photo service, for example, you wonder how many photos you upload per day, per hour, per second. The following metrics are “semi-technical” : the responsiveness of the mobile application or site, the work of the API, how quickly the user interacts with the site, the installation of applications, the UX. Tracking user behavior is the third important metric. These are systems like Google Analytics and Yandex. Metrics. We have our own great tracking system in which we invest a lot.
In the process of working with statistics, many users are involved - these are developers and business analysts. It is important that everyone speak the same language, so you need to agree.
Formalizing the structure of business events is when a developer tells how many registrations we have, the analyst understands that he was given information not only about the total number of registrations, but also broken down by country, gender and other parameters. And all this information is formalized and is in the public domain for all users of the company . The event has a typed structure and a formal description. For example, we store this information in our own format in Protocol Buffers .
Description of the event "Registration":
The registration event contains information about the user, the field, the time of the event and the country of registration of the user. This information is available to analysts, and, further, business understands that we generally collect.
The formal description is a uniformity for developers, analysts and the food department. Then this information penetrates the description of the application business logic with a red thread. For example, we have an internal system for describing business processes and there is a screen in it that we have a new feature.
In the product requirements document there is a section with instructions that when a user interacts with an application in this way, we must send an event with exactly the same parameters. Subsequently, we will be able to validate how well our features work, and that we have correctly measured them. The formal description allows us to further understand how to store this data in the database: NoSQL, SQL or others. We have a data schema , and this is awesome.
In some analytical systems, which are provided as a service, there are only 10 to 15 events in the stock photography. We have this number increased by more than 1000 and is not going to stop - it is impossible to live without a single registry .
We decided that statistics is important and described a certain subject area - this is already good, you can live on.
We decided to build the system in such a way that when a business event takes place - registration, sending a message, like - then simultaneously with the preservation of this information, we separately send some statistical event.
It is processed completely independently of the data warehouses in which the application is running, because the data flow passes through a separate processing pipeline.
Description via EDL:
We have a description of the registration event. An API is automatically generated, accessible to developers from code that allows you to send statistics in 4 lines.
EDL based API:
This is our external system. We do this because we have incredible services that provide an API for working with data about photos, about something else. They all store data in cool newfangled bases, for example, in Aerospike and CockroachDB.
When you need to build some kind of reporting, you don’t have to go and beg: “Guys, how much do you have here and how much?” - all data is sent to a separate flow. Processing conveyor - external system. From the application context, we unbind all the data from the business logic repository, and send it further to a separate pipeline.
Phase Collect assumes the availability of application servers. We have this PHP.
This is a subsystem that allows you to send to another pipeline what we did from the context of the application. Vehicles are selected solely from your requirements, depending on the situation in the project.
The transport has the characteristics, and the first is the delivery guarantee. Characteristics of transport: at-least-once, exactly-once, you choose statistics for your tasks, based on how important these data are. For example, for billing systems it is unacceptable that the statistics reflect more transactions than there are - this is money, that’s not the case.
The second parameter is binding for programming languages. You need to somehow interact with the transport, so it is selected under the language in which the project is written.
The third parameter is scalability. Since we are talking about millions of events per second, it would be good to keep in mind the reserve for further scalability.
There are many transport options: application RDBMS, Flume, Kafka or LSD. We use LSD - this is our special way.
LSD has nothing to do with banned substances. This is a lively, very fast streaming demon that does not provide any agent to write to it. We can tyunit it, we have integration with other systems : HDFS, Kafka - we can peretimlivat sent data. LSD does not have a network call on INSERT, and it can manage the network topology.
The most important thing is that this is OpenSource from Badoo - there is no reason not to trust this software.
If this were a perfect demon, then instead of Kafka we would discuss LSD at every conference, but in every LSD there is a fly in the ointment. We have our limitations, which we live with, which suit us: there is no replication support in LSD and it guarantees delivery at-least once . Also for cash transactions it is not the most suitable transport, but in general it is necessary to communicate with money only through “acid” databases - supporting ACID .
Based on the results of the previous series, we received a formal description of the data, generated from them an excellent, convenient API for developers to send events , and figured out how to transport this data from the application context to a separate pipeline . Already not bad, and we come to the next phase.
We collected data from registrations, uploaded photos, polls - what to do with all this? From this data we want to get graphs with a long history and raw data . Charts understand everything - you do not need to be a developer to understand the curve that the company's revenue is growing. Raw data is used for operational reporting and ad-hoc. For more complex cases, our analysts want to perform analytical queries on this data. Both that, and that functionality are necessary to us.
Graphics are different types.

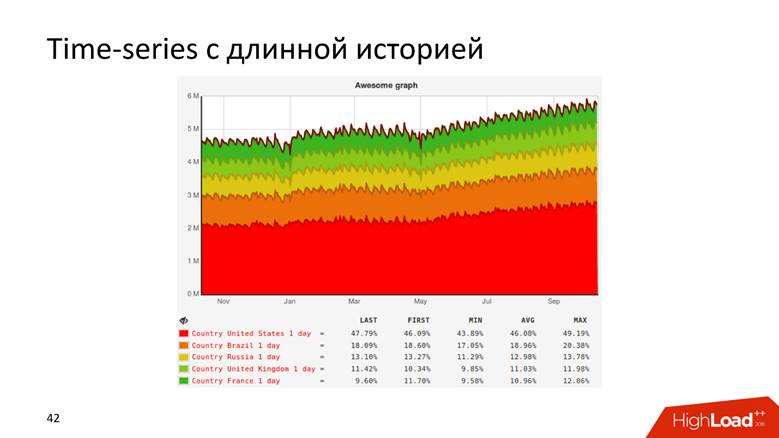
Or, for example, a graph with a history that shows data for 10 years.
Charts are even such.
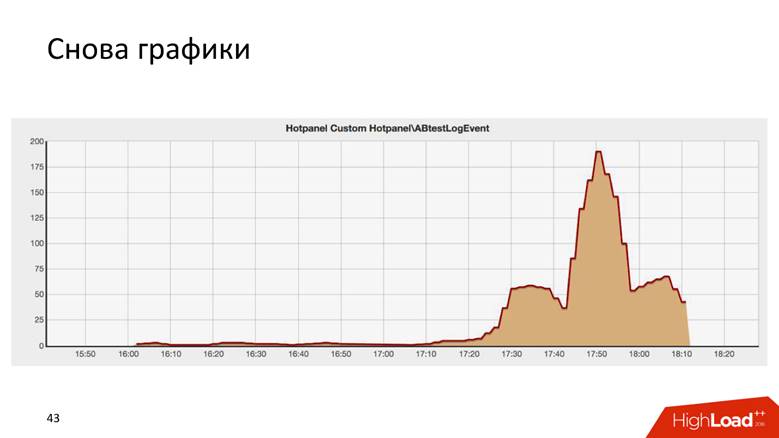
This is the result of some AB-test, and it is surprisingly similar to the Chrysler building in New York.
There are two ways to draw a graph: a request for raw data and a time series . Both approaches have disadvantages and advantages, which we will not dwell on in detail. We use a hybrid approach : we keep a short “tail” of raw data for operational reporting, and a time series for long-term storage. The second is calculated from the first.
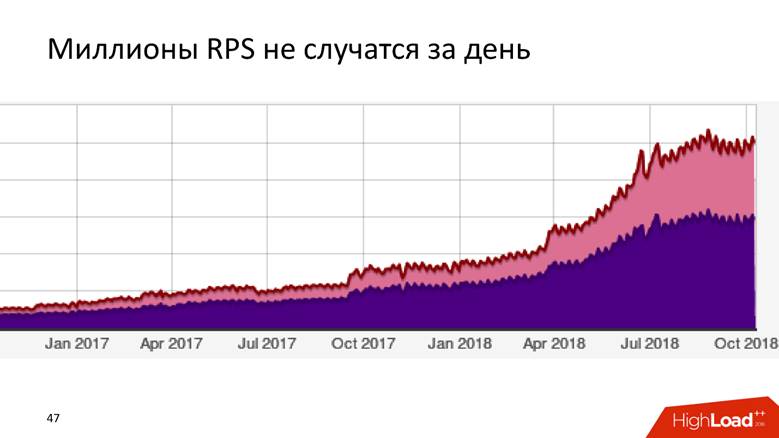
It's a long story — millions of RPS don't happen in a day. Badoo is a company with a ten-year history, and it can be said that the data processing system grew with the company.
At first we had nothing. We started collecting data - it turned out 5,000 events per second. One MySQL host and nothing else! Any relational database management system will cope with this task, and it will be comfortable with it: you will have transactionality - put data, get requests for it - everything works great and works well. So we lived for a while.
At some point there was a functional sharding: registration data - here, and about photos - there. So we lived up to 200,000 events per second and began to use different combined approaches: to store not raw data, but aggregated data, but so far within the relational database. We store counters, but the essence of most relational databases is such that it will be impossible to perform a DISTINCT query on this data later - the algebraic counter model does not allow you to calculate DISTINCT.
We in Badoo have the motto “Unstoppable force” . We were not going to stop and grew further. At the moment when they crossed the threshold of 200,000 events per second , they decided to create a formal description, which I mentioned above. Before that, there was a certain chaos, but now they received a structured registry of events: they began to scale the system, hooked up Hadoop , all the data went to Hive-tables.
Hadoop is a huge software package, file system. For distributed computing, Hadoop says: "Put the data here, I will let you perform analytical queries on them." So we did - we wrote a regular calculation of all the graphs - it turned out great. But schedules are valuable when they are updated promptly - once a day, looking at the updated schedule is not so fun. If we rolled out to production something that leads to a fatal error, we would like to see the graphics fall immediately, and not every other day. Therefore, the entire system began to degrade over time. However, we realized that at this stage you can stick to the selected stack of technologies.
At the stage from 400,000 to 800,000 events per second , we replaced Hadoop in its pure form and Hive, as an analyst, performed Spark Streaming , wrote generic map / reduce and incremental calculation of metrics. 3 years ago I told how we did it. Then it seemed to us that Spark would live forever, but life decided otherwise - we rested against the limitations of Hadoop. Perhaps if we had other conditions, we would continue to live with Hadoop.
Another problem, in addition to calculating graphs on Hadoop, was incredible four-story SQL queries that analysts drove, and the graphs are not updated quickly. The fact is that there is quite a tricky job with the operational processing of the data, so that it was realtime, fast and cool.
Badoo is served by two data centers located on two sides of the Atlantic Ocean - in Europe and North America. To build a single reporting, you need to send data from America to Europe. It is in the European data center that we keep all statistics records, because there is more computing power. Roundtrip between data centers of the order of 200 ms - the network is quite delicate - making a request to another DC is not the same as going to the next rack.
When we started to formalize events, both developers and product managers became involved, everyone liked everything - there was just an explosive growth of events . At this time, it was time to buy iron into the cluster, but we didn’t really want to do that.
When we passed the peak of 800,000 events per second , we learned that Yandex had put ClickHouse into OpenSource and decided to try it. They crammed the car of the cones , while they were trying to do something, and as a result, when everything worked, they organized a small reception on the first million events. Probably, on ClickHouse it would be possible to finish the report.
But this is not interesting, so let's continue to talk about data processing.
ClickHouse is a hyip of the last two years and does not need to be presented: only on HighLoad ++ in 2018 I remember about five reports about it, as well as seminars and seminars.
This tool is designed to solve exactly the tasks that we set for ourselves. There is a realtime update and the chips that we received at the time from Hadoop: replication, sharding. There was no reason not to try ClickHouse, because we understood that with the implementation on Hadoop we already broke through the bottom. The tool is cool, and the documentation is generally fire - I wrote there myself, I like everything very much, and everything is great. But we had to solve a number of issues.
How to transfer the whole flow of events to ClickHouse? How to combine data from two data centers? From what we came to the admins and said: "Guys, let's populate ClickHouse", they will not make the network twice as thick, and the delay is two times less. No, the network is still as thin and small as the first paycheck.
How to store the results ? At Hadoop, we understood how to draw graphics - but how to do it on the magic ClickHouse? Magic wand not included. How to deliver results to time series storage?
As my lecturer at the institute said, we will consider 3 data schemes: strategic, logical and physical.
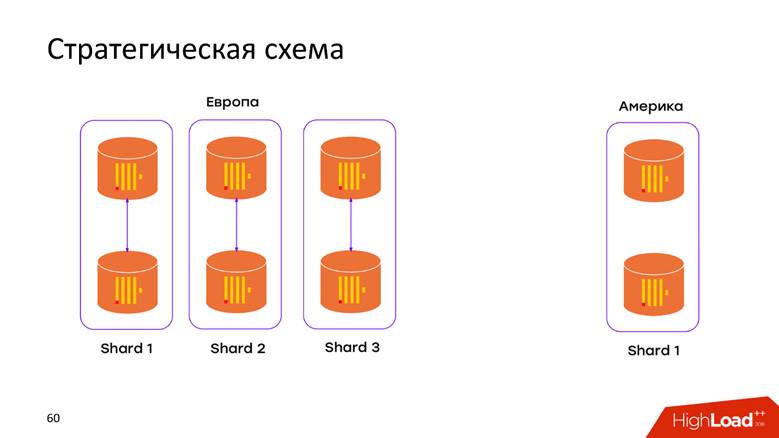
We have 2 data centers . We learned that ClickHouse knows how to know nothing about DC, and just populated into each DC over the cluster. Now the data does not move through the cross-Atlantic cable - all data that occurred in DC is stored locally in its cluster. When we want to make a request on the combined data, for example, to find out how many registrations are in both DCs, ClickHouse gives us this opportunity. Low latency and availability for a request - just a masterpiece!
Again the questions: how will our data fit into the ClickHouse relational model, what to do in order not to lose replication and sharding? The ClickHouse documentation is extensively described, and if you have more than one server, you will come across this article. Therefore, we will not go into what is in the manual: replications, sharding, and requests for all shard data.
The logic circuit is the most interesting. In one pipeline, we handle heterogeneous events. This means that we have a stream of heterogeneous events : registrations, voices, photo uploads, technical metrics, tracking user behavior — all of these events have completely different attributes . For example, I looked at the screen on a mobile phone - I need a screen id, I voted for someone - I need to understand whether the vote was for or against. All these events have different attributes, different schedules are drawn on them, but all this must be processed in a single pipeline. How to put it in a ClickHouse model?
Approach # 1 - per event table. This first approach, we extrapolated from the experience gained from MySQL - created a label for each event in ClickHouse. It sounds pretty logical, but we ran into a number of difficulties.
We have no restrictions on the fact that the event will change its structure when today's build comes out. A patch can be done by any developer. The scheme is generally mutable in all directions. The only required-field is the timestamp event and what the event was. Everything else changes on the fly, and, accordingly, these labels need to be modified. ClickHouse has the ability to perform ALTER on a cluster , but this is a delicate, gentle procedure that is difficult to automate so that it works flawlessly. Therefore, it is a minus.
We have more than a thousand different events, which gives us a high INSERT rate for one machine - we constantly record all the data in a thousand tables. For ClickHouse this is an anti-pattern. If Pepsi slogan - "Live in big gulps", then ClickHouse - "Live in big batchy . " If this is not done, replication chokes, ClickHouse refuses to accept new inserts - an unpleasant scheme.
Approach # 2 is a wide table . Siberian men tried to slip the chainsaw rail and apply a different data model. We make a table with a thousand columns , where each event has reserved columns for its data. We have a huge sparse table - fortunately this did not go further than the development environment, because from the very first inserts it became clear that the scheme was absolutely bad, and we would not do that.
But still I want to use such a cool software product, a little bit more to finish - and it will be necessary.
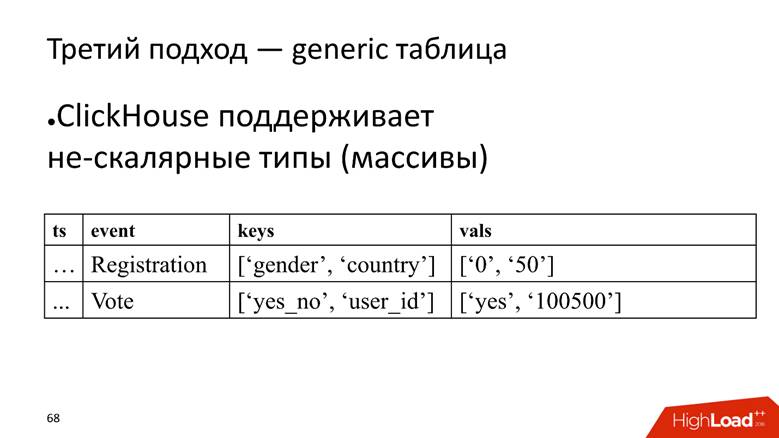
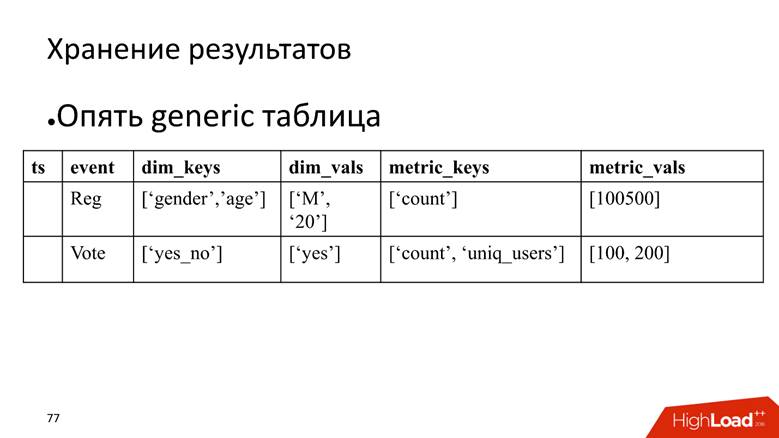
Approach # 3 - generic table. We have one huge table in which we store data in arrays, because ClickHouse supports non-scalar data types . That is, we start a column in which the names of the attributes are stored, and separately a column with an array in which the values of the attributes are stored.
ClickHouse here performs its task very well. If we only needed to insert data, we would probably squeeze 10 more times on the current installation.
However, the fly in the ointment is that this is also an anti-pattern for ClickHouse - to store arrays of strings . This is bad, because arrays of strings take up more disk space - they hurt worse than simple columns and are more difficult to process . But for our task, we turn a blind eye to this, as the merits outweigh.
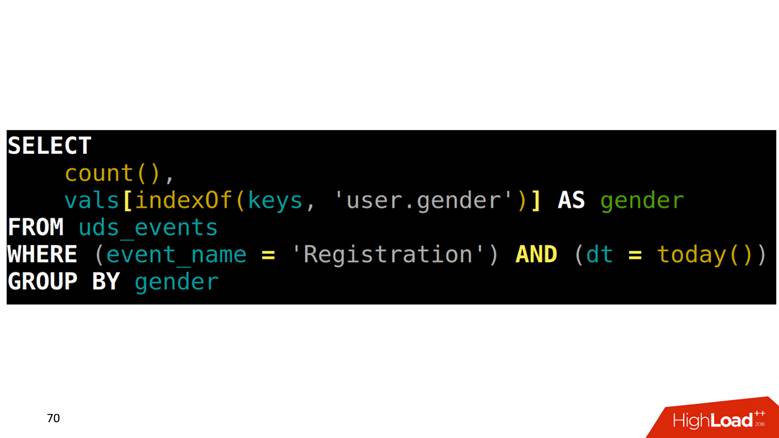
How to make a SELECT from such a table? Our task is to calculate registrations grouped by gender. You must first find in one array which position corresponds to the gender column, then climb into another column with this index and retrieve the data.
Since all events are described, they have a strict structure, we create a four-story SQL query for each type of event, execute it and save the results to another table.
The problem is that in order to draw two neighboring points on the graph, you need to scan the entire table . Example: we look at the registration for the day. This event is from the topmost row to the next to last. Scanned once - great. After 5 minutes, we want to draw a new point on the graph - again we scan the range of data that intersects with the previous scan, and so for each event. It sounds logical, but it doesn't look great.
In addition, when we take some strings, we still need to count the results under the aggregation . For example, there is a fact that the servant of God registered in Scandinavia and was a man, and we need to calculate summary statistics: how many registrations, how many men, how many of them are people, and how many from Norway. This is called in terms of analytical databases ROLLUP, CUBE and GROUPING SETS - turn one line into several.
Fortunately, ClickHouse has a tool for solving this problem, namely the serialized state of aggregate functions . This means that you can scan a piece of data once and save these results. This is a killer feature . Three years ago, we did exactly this on Spark and Hadoop, and it's cool that, in parallel with us, Yandex’s best minds implemented an analogue in ClickHouse.
We have a slow query - count unique users today and yesterday.
Physically, we can make a SELECT for the state of yesterday, get its binary representation, save it somewhere.
For today, we simply change the condition that it will be today:
:
, - . . , , , , ClickHouse, : «, ! , !»
, , . , . . — SQL-, . , , .
, - time series. : , , , time series.
time series : , , timestamp . , , . . , , , — , . , , ClickHouse -, , .
, , ClickHouse:
time series 2 , 20 20-80 . . ClickHouse GraphiteMergeTree , time series, .
8 ClickHouse , 6 - , 2 : 2 — , . 1.8 . , 500 . , 1,8 , 500 ! .
2 . . 3 , CPU — 4 . , .
, , , . , , ClickHouse 3 000 . , , , overkill.
, , . ClickHouse, . , , , . , 8 3–4 . — .
, ? time series, time series , , , .
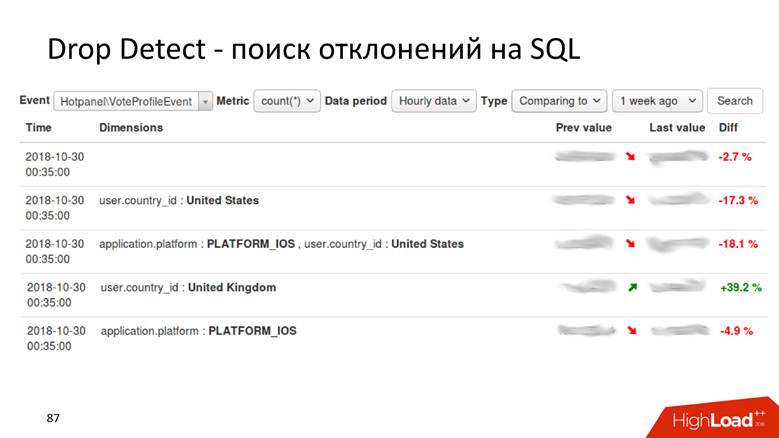
Drop Detect — SQL : SQL- , , .
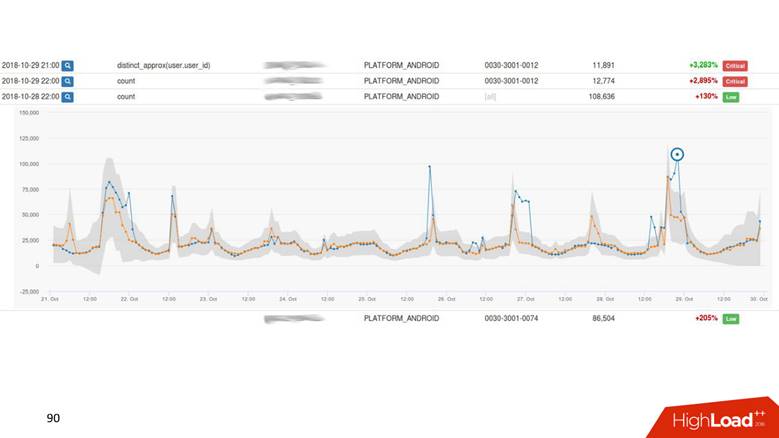
Anomaly Detection — . , , 2% , — 40, , , , .
— , , - , Anomaly Detection.
, time series . : , , . time series . , , . , drop detection — , .
UI.
. - , — . -, .
, , . , : 1000 — alarm, 0 — alarm. .
Anomaly Detection , . Anomaly Detection Exasol , ClickHouse. Anomaly Detection 2 , .
, , 4 .
, , , . , , . , .
3 years ago, Alexander told us how they built a scalable near-realtime event handling system in Badoo. Since then, it has evolved, volumes have grown in the process, it had to solve scaling and fault tolerance tasks, and at a certain point, radical measures were needed - a change of the technological stack .
')
From the decryption, you will learn how Badoo replaced the Spark + Hadoop bundle with ClickHouse, saved hardware 3 times and increased the load 6 times , why and with what means to collect statistics in the project, and what to do with this data.
About speaker: Alexander Krasheninnikov ( alexkrash ) - Head of Data Engineering in Badoo. Engaged in a BI-infrastructure, scaling under load, leads teams that build data processing infrastructure. Loves everything distributed: Hadoop, Spark, ClickHouse. I am sure that cool distributed systems can be prepared from OpenSource.
Statistics collection
If we have no data, we are blind and cannot manage our project. That is why we need statistics - to monitor the viability of the project. We, as engineers, should strive to improve our products, but if you want to improve, measure. I follow this motto in my work. First of all, our goal is business value. Statistics provides answers to business questions . Technical metrics are technical metrics, but business is also interested in indicators, and they should also be considered.
The life cycle of statistics
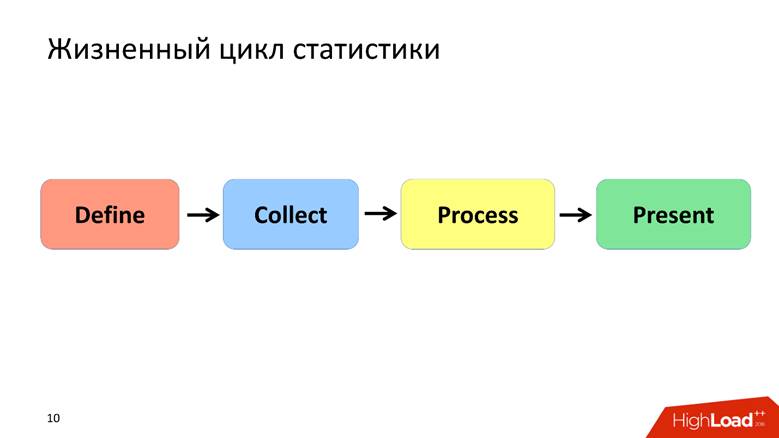
I define the life cycle of statistics with 4 points, about each of which we will talk separately.
Define Phase - Formalization
In the application, we collect several metrics. First of all, these are business metrics . If you have a photo service, for example, you wonder how many photos you upload per day, per hour, per second. The following metrics are “semi-technical” : the responsiveness of the mobile application or site, the work of the API, how quickly the user interacts with the site, the installation of applications, the UX. Tracking user behavior is the third important metric. These are systems like Google Analytics and Yandex. Metrics. We have our own great tracking system in which we invest a lot.
In the process of working with statistics, many users are involved - these are developers and business analysts. It is important that everyone speak the same language, so you need to agree.
You can negotiate orally, but much better when it happens formally - in a clear structure of events.
Formalizing the structure of business events is when a developer tells how many registrations we have, the analyst understands that he was given information not only about the total number of registrations, but also broken down by country, gender and other parameters. And all this information is formalized and is in the public domain for all users of the company . The event has a typed structure and a formal description. For example, we store this information in our own format in Protocol Buffers .
Description of the event "Registration":
enum Gender { FEMALE = 1; MALE = 2; } message Registration { required int32 userid =1; required Gender usergender = 2; required int32 time =3; required int32 countryid =4; } The registration event contains information about the user, the field, the time of the event and the country of registration of the user. This information is available to analysts, and, further, business understands that we generally collect.
Why do we need a formal description?
The formal description is a uniformity for developers, analysts and the food department. Then this information penetrates the description of the application business logic with a red thread. For example, we have an internal system for describing business processes and there is a screen in it that we have a new feature.
In the product requirements document there is a section with instructions that when a user interacts with an application in this way, we must send an event with exactly the same parameters. Subsequently, we will be able to validate how well our features work, and that we have correctly measured them. The formal description allows us to further understand how to store this data in the database: NoSQL, SQL or others. We have a data schema , and this is awesome.
In some analytical systems, which are provided as a service, there are only 10 to 15 events in the stock photography. We have this number increased by more than 1000 and is not going to stop - it is impossible to live without a single registry .
Define Phase Summary
We decided that statistics is important and described a certain subject area - this is already good, you can live on.
Phase Collect - data collection
We decided to build the system in such a way that when a business event takes place - registration, sending a message, like - then simultaneously with the preservation of this information, we separately send some statistical event.
In the code, statistics are sent simultaneously with the business event.
It is processed completely independently of the data warehouses in which the application is running, because the data flow passes through a separate processing pipeline.
Description via EDL:
enum Gender { FEMALE = 1; MALE = 2; } message Registration { required int32 user_id =1; required Gender user_gender = 2; required int32 time =3; required int32 country_id =4; } We have a description of the registration event. An API is automatically generated, accessible to developers from code that allows you to send statistics in 4 lines.
EDL based API:
\EDL\Event\Regist ration::create() ->setUserId(100500) ->setGender(Gender: :MALE) ->setTime(time()) ->send(); Event Delivery
This is our external system. We do this because we have incredible services that provide an API for working with data about photos, about something else. They all store data in cool newfangled bases, for example, in Aerospike and CockroachDB.
When you need to build some kind of reporting, you don’t have to go and beg: “Guys, how much do you have here and how much?” - all data is sent to a separate flow. Processing conveyor - external system. From the application context, we unbind all the data from the business logic repository, and send it further to a separate pipeline.
Phase Collect assumes the availability of application servers. We have this PHP.
Transport
This is a subsystem that allows you to send to another pipeline what we did from the context of the application. Vehicles are selected solely from your requirements, depending on the situation in the project.
The transport has the characteristics, and the first is the delivery guarantee. Characteristics of transport: at-least-once, exactly-once, you choose statistics for your tasks, based on how important these data are. For example, for billing systems it is unacceptable that the statistics reflect more transactions than there are - this is money, that’s not the case.
The second parameter is binding for programming languages. You need to somehow interact with the transport, so it is selected under the language in which the project is written.
The third parameter is scalability. Since we are talking about millions of events per second, it would be good to keep in mind the reserve for further scalability.
There are many transport options: application RDBMS, Flume, Kafka or LSD. We use LSD - this is our special way.
Live streaming daemon
LSD has nothing to do with banned substances. This is a lively, very fast streaming demon that does not provide any agent to write to it. We can tyunit it, we have integration with other systems : HDFS, Kafka - we can peretimlivat sent data. LSD does not have a network call on INSERT, and it can manage the network topology.
The most important thing is that this is OpenSource from Badoo - there is no reason not to trust this software.
If this were a perfect demon, then instead of Kafka we would discuss LSD at every conference, but in every LSD there is a fly in the ointment. We have our limitations, which we live with, which suit us: there is no replication support in LSD and it guarantees delivery at-least once . Also for cash transactions it is not the most suitable transport, but in general it is necessary to communicate with money only through “acid” databases - supporting ACID .
Collect Phase Summary
Based on the results of the previous series, we received a formal description of the data, generated from them an excellent, convenient API for developers to send events , and figured out how to transport this data from the application context to a separate pipeline . Already not bad, and we come to the next phase.
Process Phase - Data Processing
We collected data from registrations, uploaded photos, polls - what to do with all this? From this data we want to get graphs with a long history and raw data . Charts understand everything - you do not need to be a developer to understand the curve that the company's revenue is growing. Raw data is used for operational reporting and ad-hoc. For more complex cases, our analysts want to perform analytical queries on this data. Both that, and that functionality are necessary to us.
Charts
Graphics are different types.
Or, for example, a graph with a history that shows data for 10 years.
Charts are even such.
This is the result of some AB-test, and it is surprisingly similar to the Chrysler building in New York.
There are two ways to draw a graph: a request for raw data and a time series . Both approaches have disadvantages and advantages, which we will not dwell on in detail. We use a hybrid approach : we keep a short “tail” of raw data for operational reporting, and a time series for long-term storage. The second is calculated from the first.
How we grew to 1.8 million events per second
It's a long story — millions of RPS don't happen in a day. Badoo is a company with a ten-year history, and it can be said that the data processing system grew with the company.
At first we had nothing. We started collecting data - it turned out 5,000 events per second. One MySQL host and nothing else! Any relational database management system will cope with this task, and it will be comfortable with it: you will have transactionality - put data, get requests for it - everything works great and works well. So we lived for a while.
At some point there was a functional sharding: registration data - here, and about photos - there. So we lived up to 200,000 events per second and began to use different combined approaches: to store not raw data, but aggregated data, but so far within the relational database. We store counters, but the essence of most relational databases is such that it will be impossible to perform a DISTINCT query on this data later - the algebraic counter model does not allow you to calculate DISTINCT.
We in Badoo have the motto “Unstoppable force” . We were not going to stop and grew further. At the moment when they crossed the threshold of 200,000 events per second , they decided to create a formal description, which I mentioned above. Before that, there was a certain chaos, but now they received a structured registry of events: they began to scale the system, hooked up Hadoop , all the data went to Hive-tables.
Hadoop is a huge software package, file system. For distributed computing, Hadoop says: "Put the data here, I will let you perform analytical queries on them." So we did - we wrote a regular calculation of all the graphs - it turned out great. But schedules are valuable when they are updated promptly - once a day, looking at the updated schedule is not so fun. If we rolled out to production something that leads to a fatal error, we would like to see the graphics fall immediately, and not every other day. Therefore, the entire system began to degrade over time. However, we realized that at this stage you can stick to the selected stack of technologies.
For us, Java was a novelty, we liked it, and we realized that we could do it differently.
At the stage from 400,000 to 800,000 events per second , we replaced Hadoop in its pure form and Hive, as an analyst, performed Spark Streaming , wrote generic map / reduce and incremental calculation of metrics. 3 years ago I told how we did it. Then it seemed to us that Spark would live forever, but life decided otherwise - we rested against the limitations of Hadoop. Perhaps if we had other conditions, we would continue to live with Hadoop.
Another problem, in addition to calculating graphs on Hadoop, was incredible four-story SQL queries that analysts drove, and the graphs are not updated quickly. The fact is that there is quite a tricky job with the operational processing of the data, so that it was realtime, fast and cool.
Badoo is served by two data centers located on two sides of the Atlantic Ocean - in Europe and North America. To build a single reporting, you need to send data from America to Europe. It is in the European data center that we keep all statistics records, because there is more computing power. Roundtrip between data centers of the order of 200 ms - the network is quite delicate - making a request to another DC is not the same as going to the next rack.
When we started to formalize events, both developers and product managers became involved, everyone liked everything - there was just an explosive growth of events . At this time, it was time to buy iron into the cluster, but we didn’t really want to do that.
When we passed the peak of 800,000 events per second , we learned that Yandex had put ClickHouse into OpenSource and decided to try it. They crammed the car of the cones , while they were trying to do something, and as a result, when everything worked, they organized a small reception on the first million events. Probably, on ClickHouse it would be possible to finish the report.
Just take ClickHouse and live with it.
But this is not interesting, so let's continue to talk about data processing.
Clickhouse
ClickHouse is a hyip of the last two years and does not need to be presented: only on HighLoad ++ in 2018 I remember about five reports about it, as well as seminars and seminars.
This tool is designed to solve exactly the tasks that we set for ourselves. There is a realtime update and the chips that we received at the time from Hadoop: replication, sharding. There was no reason not to try ClickHouse, because we understood that with the implementation on Hadoop we already broke through the bottom. The tool is cool, and the documentation is generally fire - I wrote there myself, I like everything very much, and everything is great. But we had to solve a number of issues.
How to transfer the whole flow of events to ClickHouse? How to combine data from two data centers? From what we came to the admins and said: "Guys, let's populate ClickHouse", they will not make the network twice as thick, and the delay is two times less. No, the network is still as thin and small as the first paycheck.
How to store the results ? At Hadoop, we understood how to draw graphics - but how to do it on the magic ClickHouse? Magic wand not included. How to deliver results to time series storage?
As my lecturer at the institute said, we will consider 3 data schemes: strategic, logical and physical.
Strategic storage scheme
We have 2 data centers . We learned that ClickHouse knows how to know nothing about DC, and just populated into each DC over the cluster. Now the data does not move through the cross-Atlantic cable - all data that occurred in DC is stored locally in its cluster. When we want to make a request on the combined data, for example, to find out how many registrations are in both DCs, ClickHouse gives us this opportunity. Low latency and availability for a request - just a masterpiece!
Physical storage scheme
Again the questions: how will our data fit into the ClickHouse relational model, what to do in order not to lose replication and sharding? The ClickHouse documentation is extensively described, and if you have more than one server, you will come across this article. Therefore, we will not go into what is in the manual: replications, sharding, and requests for all shard data.
Logical storage scheme
The logic circuit is the most interesting. In one pipeline, we handle heterogeneous events. This means that we have a stream of heterogeneous events : registrations, voices, photo uploads, technical metrics, tracking user behavior — all of these events have completely different attributes . For example, I looked at the screen on a mobile phone - I need a screen id, I voted for someone - I need to understand whether the vote was for or against. All these events have different attributes, different schedules are drawn on them, but all this must be processed in a single pipeline. How to put it in a ClickHouse model?
Approach # 1 - per event table. This first approach, we extrapolated from the experience gained from MySQL - created a label for each event in ClickHouse. It sounds pretty logical, but we ran into a number of difficulties.
We have no restrictions on the fact that the event will change its structure when today's build comes out. A patch can be done by any developer. The scheme is generally mutable in all directions. The only required-field is the timestamp event and what the event was. Everything else changes on the fly, and, accordingly, these labels need to be modified. ClickHouse has the ability to perform ALTER on a cluster , but this is a delicate, gentle procedure that is difficult to automate so that it works flawlessly. Therefore, it is a minus.
We have more than a thousand different events, which gives us a high INSERT rate for one machine - we constantly record all the data in a thousand tables. For ClickHouse this is an anti-pattern. If Pepsi slogan - "Live in big gulps", then ClickHouse - "Live in big batchy . " If this is not done, replication chokes, ClickHouse refuses to accept new inserts - an unpleasant scheme.
Approach # 2 is a wide table . Siberian men tried to slip the chainsaw rail and apply a different data model. We make a table with a thousand columns , where each event has reserved columns for its data. We have a huge sparse table - fortunately this did not go further than the development environment, because from the very first inserts it became clear that the scheme was absolutely bad, and we would not do that.
But still I want to use such a cool software product, a little bit more to finish - and it will be necessary.
Approach # 3 - generic table. We have one huge table in which we store data in arrays, because ClickHouse supports non-scalar data types . That is, we start a column in which the names of the attributes are stored, and separately a column with an array in which the values of the attributes are stored.
ClickHouse here performs its task very well. If we only needed to insert data, we would probably squeeze 10 more times on the current installation.
However, the fly in the ointment is that this is also an anti-pattern for ClickHouse - to store arrays of strings . This is bad, because arrays of strings take up more disk space - they hurt worse than simple columns and are more difficult to process . But for our task, we turn a blind eye to this, as the merits outweigh.
How to make a SELECT from such a table? Our task is to calculate registrations grouped by gender. You must first find in one array which position corresponds to the gender column, then climb into another column with this index and retrieve the data.
How to draw graphs on this data
Since all events are described, they have a strict structure, we create a four-story SQL query for each type of event, execute it and save the results to another table.
The problem is that in order to draw two neighboring points on the graph, you need to scan the entire table . Example: we look at the registration for the day. This event is from the topmost row to the next to last. Scanned once - great. After 5 minutes, we want to draw a new point on the graph - again we scan the range of data that intersects with the previous scan, and so for each event. It sounds logical, but it doesn't look great.
In addition, when we take some strings, we still need to count the results under the aggregation . For example, there is a fact that the servant of God registered in Scandinavia and was a man, and we need to calculate summary statistics: how many registrations, how many men, how many of them are people, and how many from Norway. This is called in terms of analytical databases ROLLUP, CUBE and GROUPING SETS - turn one line into several.
How to treat
Fortunately, ClickHouse has a tool for solving this problem, namely the serialized state of aggregate functions . This means that you can scan a piece of data once and save these results. This is a killer feature . Three years ago, we did exactly this on Spark and Hadoop, and it's cool that, in parallel with us, Yandex’s best minds implemented an analogue in ClickHouse.
Slow request
We have a slow query - count unique users today and yesterday.
SELECT uniq(user_id) FROM table WHERE dt IN (today(), yesterday()) Physically, we can make a SELECT for the state of yesterday, get its binary representation, save it somewhere.
SELECT uniq(user_id) 'xxx' AS ts, uniqState(user id) AS state FROM table WHERE dt IN (today(), yesterday()) For today, we simply change the condition that it will be today:
'yyy' AS ts and WHERE dt = today() and the timestamp we will call “xxx” and “yyy”. , , 2 . SELECT uniqMerge(state) FROM ageagate_table WHERE ts IN ('xxx', 'yyy') :
- , ;
- ;
- .
, - . . , , , , ClickHouse, : «, ! , !»
, , . , . . — SQL-, . , , .
, - time series. : , , , time series.
time series : , , timestamp . , , . . , , , — , . , , ClickHouse -, , .
, , ClickHouse:
— « », — .
time series 2 , 20 20-80 . . ClickHouse GraphiteMergeTree , time series, .
8 ClickHouse , 6 - , 2 : 2 — , . 1.8 . , 500 . , 1,8 , 500 ! .
Hadoop
2 . . 3 , CPU — 4 . , .
Process
, , , . , , ClickHouse 3 000 . , , , overkill.
, , . ClickHouse, . , , , . , 8 3–4 . — .
Present —
, ? time series, time series , , , .
Drop Detect — SQL : SQL- , , .
Anomaly Detection — . , , 2% , — 40, , , , .
— , , - , Anomaly Detection.
Anomaly Detection
, time series . : , , . time series . , , . , drop detection — , .
UI.
. - , — . -, .
Present
, , . , : 1000 — alarm, 0 — alarm. .
Anomaly Detection , . Anomaly Detection Exasol , ClickHouse. Anomaly Detection 2 , .
, , 4 .
, , , . , , . , .
HighLoad++ , HighLoad++ - . , , :)
, PHP Russia , , . , , , 1,8 /, , 1 .
Source: https://habr.com/ru/post/442616/
All Articles