Why traffic graphics "lie"
Dealing with DDoS protection 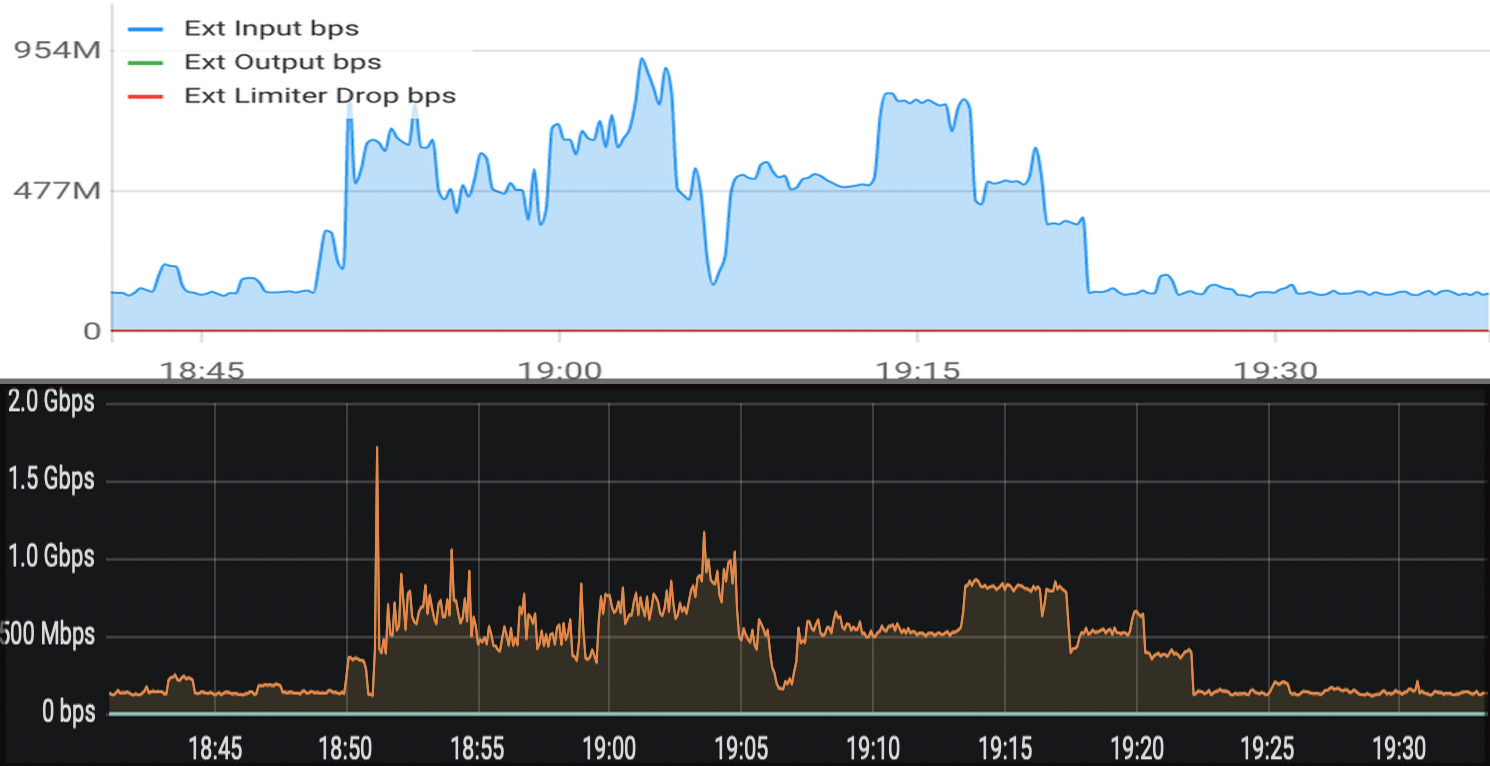 It is brought to the client’s site to carry out load testing, protection tests, to help repel attacks. Often you observe a situation when the same traffic differs graphs in different systems. A brief explanation of “think differently” does not inspire confidence. Therefore, described the reasons for a separate article. The article will be useful to novice engineers from the network operation and those who have to deal with graphs.
The reasons for the divergence of testimony divided into three groups:
1. Counting
2. Collection and storage
3. Display
I will start with the main reason for the discrepancy and which is most often overlooked.
')
1. Engineers often believe that the minimum size of a “packet” is 64 bytes.
2. Network equipment differently counts the amount of information transmitted.
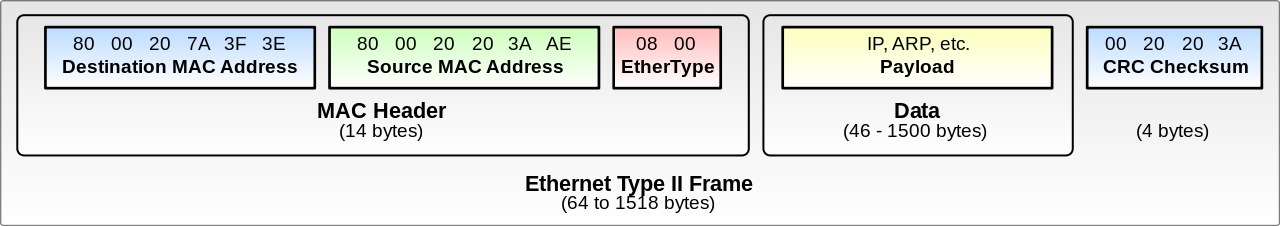 The origins of the errors and answers are in this picture.
I recall the structure of the Ethernet headers
For example, we will do calculations for 10 GbE. Through 10 GbE interface, the maximum passes 10000000000 bits (10 ^ 10).
We translate header sizes from octets to bits.
* The use of overlay technologies on the transport network affects the initial size of the PDU , which reduces the maximum pps.
** For example, took the VLAN. Frame handling with vlan IDs on network interfaces may vary. Some increase the MTU, others reduce the maximum payload size.
Calculate the maximum and minimum speed in the PDU per second with full utilization of the interface (wirespeed)
Those. through 10 GbE interface the maximum passes ~ 14,88 Mpps. For simplicity, remembering the name of the zigapacket.
I'll also note that max pps and min pps differ by more than 18 times . For this reason, when considering antiDDoS solutions, you need to pay attention to the performance in Mpps. Often the vendor declares performance in Gbps, silent in the packages. Description of methods for assessing the performance of protection systems is a topic for a separate large article.
Network equipment can read PDU size at different levels and exclude fields from counting. Frequent sets of fields for counting:
Now let's calculate the readings on the graph when the TCP SYN Flood attacks on wirespeed without and using vlan.
So with the full utilization of the 10 GbE interface on the graph, you can observe a speed of 4.43 Gbps.
Therefore, when comparing speed values in different systems, you need to understand how the size of the PDU is considered. To simplify the comparison, we made for ourselves a calculator showing the speed when counting different headers.
The following two other groups of causes affect the smoothing of the peaks and are applicable to all speed plots.
Usually counters are counted showing the absolute value of the processed bytes and packets. To display the speed you need to calculate the derivative.
The accuracy of the graph is highly dependent on the counter survey rate. The less often, the more averaging. For example, it is customary for operators to take values every five minutes. Therefore, with Pulse Wave DDoS attacks, the graphics profiles in the monitoring system and the filtering system will be very different.
Often, the cyclic database (rrd) approach is used to store counter values. In order to save resources, data for different periods are stored with different accuracy. The farther into the past, the more sparse the values, the greater the averaging.
Different systems may have different retention policy, therefore, retrospectively looking at charts you can observe different values.
Usually there is a limit on the number of displayed points on the chart. If for the requested period there are more points, then when displaying, points are consolidated. Most often, neighboring points consolidate into one with an average value. This averaging smooths the peaks.
Illustrative example:

Additional discrepancies in the readings add graphing tools. For bit charts, they can use different degrees to display the same prefix. More details can be read ru.wikipedia.org/wiki/ Binary_pods
In general, counters on network equipment show the amount of information processed in bytes. If you do not convert, the graph will show the speed in Bps (bytes per second), and not in bps (bits per second).
Charts are a useful and informative tool. Looking at the correct set of graphs, you can quickly find answers to many questions. But when working with graphs, you need to understand the nuances, especially when correlating graphs from different systems. Therefore, the first time looking at the chart, find out:
It is brought to the client’s site to carry out load testing, protection tests, to help repel attacks. Often you observe a situation when the same traffic differs graphs in different systems. A brief explanation of “think differently” does not inspire confidence. Therefore, described the reasons for a separate article. The article will be useful to novice engineers from the network operation and those who have to deal with graphs.The reasons for the divergence of testimony divided into three groups:
1. Counting
2. Collection and storage
3. Display
1. Counting
I will start with the main reason for the discrepancy and which is most often overlooked.
')
1. Engineers often believe that the minimum size of a “packet” is 64 bytes.
2. Network equipment differently counts the amount of information transmitted.
The origins of the errors and answers are in this picture.1.1 RTFM
I recall the structure of the Ethernet headers
For example, we will do calculations for 10 GbE. Through 10 GbE interface, the maximum passes 10000000000 bits (10 ^ 10).
We translate header sizes from octets to bits.
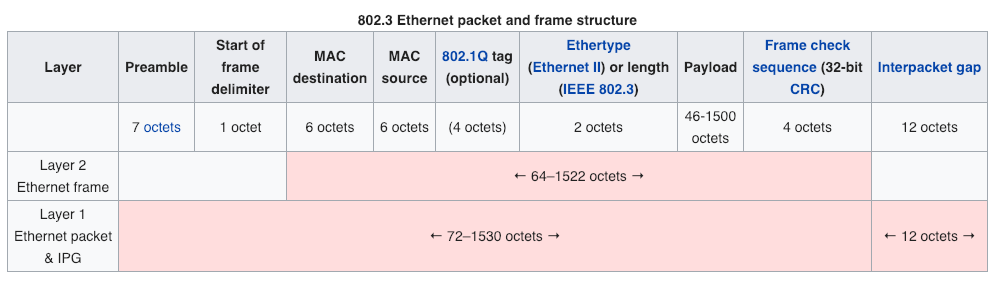
| bytes | bits | |
|---|---|---|
| L1 Header size | 20 | 160 |
| L2 MAC Header size | 14 | 112 |
| L2 FCS size | four | 32 |
| L2 VLAN size | four | 32 |
| Payload min | 46 | 368 |
| Payload max | 1500 | 12,000 |
| Total | ||
| Min payload w / o VLAN | 84 | 672 |
| Min payload w VLAN | 88 | 704 |
| Max payload w / o VLAN | 1538 | 12304 |
| Max payload w VLAN | 1542 | 12336 |
* The use of overlay technologies on the transport network affects the initial size of the PDU , which reduces the maximum pps.
** For example, took the VLAN. Frame handling with vlan IDs on network interfaces may vary. Some increase the MTU, others reduce the maximum payload size.
Calculate the maximum and minimum speed in the PDU per second with full utilization of the interface (wirespeed)
| Max pps | 14880952 .38 |
| Max pps w VLAN | 14204545.45 |
| Min pps | 812743 .8231 |
| Min pps w VLAN | 810635.5383 |
Those. through 10 GbE interface the maximum passes ~ 14,88 Mpps. For simplicity, remembering the name of the zigapacket.
I'll also note that max pps and min pps differ by more than 18 times . For this reason, when considering antiDDoS solutions, you need to pay attention to the performance in Mpps. Often the vendor declares performance in Gbps, silent in the packages. Description of methods for assessing the performance of protection systems is a topic for a separate large article.
1.2 Features of calculating the size of the PDU
Network equipment can read PDU size at different levels and exclude fields from counting. Frequent sets of fields for counting:
- L2 Data or IP packet len
- L2 Data + MAC Header
- L2 Data + MAC Header + FCS (CRC Checksum)
Now let's calculate the readings on the graph when the TCP SYN Flood attacks on wirespeed without and using vlan.
| PDU size (bytes) | Gbps multiplier | ||
|---|---|---|---|
| 10 9 | 2 30 | ||
| Pps w / o vlan = 14880952.38 | |||
| L1 | 84 | ten | 9.313225746 |
| L2 | 64 | 7.6190 47619 | 7.095791045 |
| L2 w / o FCS | 60 | 7.1428 57143 | 6.652304104 |
| L2 Data (IP + TCP) | 40 | 4.761904762 | 4.434869403 |
| Pps w vlan = 14204545.45 | |||
| L1 | 88 | ten | 9.313225746 |
| L2 | 68 | 7.727272727 | 7.196583531 |
| L2 w / o FCS | 64 | 7.272727273 | 6.773255088 |
| L2 Data (IP + TCP) | 40 | 4.545454545 | 4.23328443 |
So with the full utilization of the 10 GbE interface on the graph, you can observe a speed of 4.43 Gbps.
Therefore, when comparing speed values in different systems, you need to understand how the size of the PDU is considered. To simplify the comparison, we made for ourselves a calculator showing the speed when counting different headers.
The following two other groups of causes affect the smoothing of the peaks and are applicable to all speed plots.
2. Collection and storage
2.1 Counter Poll Frequency
Usually counters are counted showing the absolute value of the processed bytes and packets. To display the speed you need to calculate the derivative.
The accuracy of the graph is highly dependent on the counter survey rate. The less often, the more averaging. For example, it is customary for operators to take values every five minutes. Therefore, with Pulse Wave DDoS attacks, the graphics profiles in the monitoring system and the filtering system will be very different.
2.2 Data Consolidation (Retention Policy)
Often, the cyclic database (rrd) approach is used to store counter values. In order to save resources, data for different periods are stored with different accuracy. The farther into the past, the more sparse the values, the greater the averaging.
Different systems may have different retention policy, therefore, retrospectively looking at charts you can observe different values.
3. Display
3.1 Number of points on the chart
Usually there is a limit on the number of displayed points on the chart. If for the requested period there are more points, then when displaying, points are consolidated. Most often, neighboring points consolidate into one with an average value. This averaging smooths the peaks.
Illustrative example:
3.2 Binary Prefixes
Additional discrepancies in the readings add graphing tools. For bit charts, they can use different degrees to display the same prefix. More details can be read ru.wikipedia.org/wiki/ Binary_pods
3.3 Units of measurement
In general, counters on network equipment show the amount of information processed in bytes. If you do not convert, the graph will show the speed in Bps (bytes per second), and not in bps (bits per second).
Conclusion
Charts are a useful and informative tool. Looking at the correct set of graphs, you can quickly find answers to many questions. But when working with graphs, you need to understand the nuances, especially when correlating graphs from different systems. Therefore, the first time looking at the chart, find out:
- what and how is going;
- how is stored;
- as displayed.
Source: https://habr.com/ru/post/441694/
All Articles